Article
Chest Expansion Measurement in 3-Dimension by
Using Accelerometers
Kittidej Arthittayapiwat
1,a,*, Prapawadee Pirompol
2,b, and Pranchalee Samanpiboon
1,c1 Department of Control System and Instrumentation Engineering, Faculty of Engineering, King Mongkut’s University of Technology Thonburi, Bangkok 10140, Thailand
2 Department of Physical Therapy, Srinakharinwirot University, Ongkharak, Nakhonnayok, Thailand Email: a[email protected] (Corresponding author), b[email protected],
Abtract. The chest expansion measurement is a part of physical therapy to track the progress of rehabilitation for checking the performance of lungs. The chest expansion mechanismmoves like pump handle and bucket handle. These two movements cause the chest move many directions. For tracking the chest movement in each direction, the MEMS accelerometers are used to measure acceleration in each axis. Consequently, acceleration is converted to displacement by double integration. The acceleration from accelerometer in each axis is affected from the earth gravityforce. Thus, rotation matrix is used for compensating the earth gravity force. It can track the acceleration vectors while rotating. The known movement from robot is simulated similar the chest expansion. 60 sets of accelerometer data were collected from robot demonstration and were analyzed for testing the accuracy of sensor and algorithm. For the highest expansion, the chest expansion measurement must be performed while doing deep breathe inhale and exhale. The deep breath signal is a low frequency and there is high frequency noise. Therefore, a low-pass filter was used for eliminating high frequency noise. The accelerometers and VICON’s markers were placed together on the body. The displacement results from accelerometers were compared with the displacement of VICON motion analysis system to find the accuracy of our purposed device. The average error of 20 sets of acceleration data from accelerometers which referred with VICON motion analysis is 7.195±4.361 mm. Accelerometer result trend follows VICON motion analysis and corresponds to each other.
Keywords: Chest expansion, accelerometer, gyroscope, displacement, gravity compensation, rotation matrix.
ENGINEERING JOURNAL Volume 23 Issue 2 Received 2 August 2018
1. Introduction
In the future, the death rate trend of global population will be increasing. Until 2030, the Chronic Obstructive Pulmonary Disease (COPD) or the disease that happen in lungs will become the fourth leading cause of death. The total death rate of COPD would be 7.8% of the population [1]. Pulmonary rehabilitation program including body exercise and breathing exercise is used for improving the physical function. The chest expansion measurement is an important part of this rehabilitation. It is used for measuring an ability of respiration and tracking the body physiology improvement [2][3][4].
The physical therapy clinics in Thailand actually measure the chest expansion by using body tape. While the patient breathing deep inhale and exhale, the force from body tape holding does not equal in each time and the force from different measuring person. Thus, they cause the final result error of chest expansion. Using body tape to measure the chest expansion, it can measure only one dimension. The result is how long of tape appears when deep inhale and exhale. Nevertheless, the chest expansion moves more than one direction.
Consequently, the chest expansion measurement devices need to improve the efficiency. Recently, there are many techniques or devices for measuring the chest expansion. The microphone is used for measuring the sound while breathing. It can measure flow rate of breath and integrate for converting flow rate to volume of air lungs. Analyzing the volume of lungs to observe the chest expansion but the environment sound affects to noise of system [5]. By using a sonar technique, the ultrasound wave is sent from transmitter to the chest and receiver received the reflection. It can measure the time duration of wave reflection and converts to chest expansion length [6]. The microwave like high radio frequency is used to measure the chest expansion by placing the Rx-Tx antennas on front and back of human body. When the chest expanded, high radio frequency signal must pass through many layers of body such as skin, muscle, fat, lungs, etc., the power of signal will be lost. The power lost can measure the chest expansion [7]. The clothes affect to ultrasound and microwave techniques. The laser interferometer measures the vibration of the light reflection on chest. There is a change in the vibration signal when the chest is expanded and impressed leading the location of the light to be significant [8]. Chest expansion is measured by using camera. Webcam camera captures the chest movement while the patient is in laying-down posture and the moving distance in captured images is analyzed [9]. In another research, infrared cameras track the marker that placed on chest. While the movement of marker is measured, it also represents the movement of the chest. Thus, the body posture and position of marker affect to the measured result [10]. The clinical device for measuring the chest expansion is Respiratory Inductance Plethemography (RIP) band which inductance depends on the length of coil inside RIP band. Therefore, inductance change stands for the perimeter of chest [11]. The accelerometer is used to measure the acceleration and tilt and calculate the respiratory waveform. It is compared with the result from RIP band [12] and nasal pressure sensor [13] to find the accuracy of sensor.
Motion analysis system (VICON) is the gold standard motion capturing that can measure the body movement by tracking the markers placed on body. ECG, RIP band and nasal sensor are compared with VICON motion analysis for observing the respiratory patterns such as normal breath, irregular breath, deep breath and apnea [14]. The next research studied about thorax movement with VICON [15]. They placed more than 100 markers and observed the thoracic movement mechanism. For comparing the VICON with higher standard 3D scan namely Single-Photon Emission Computed Tomography (SPECT) system [16], the result shows that the VICON has suitable resolution and reliability for measuring the chest expansion.
However, VICON is not proper in clinical measurement because it is expensive and complicate to install. The light from environment affects the system. Therefore, the objective of this work is the device design that places on human body to measure the chest expansion. From the chest expansion mechanism, it moves more than one direction and the accelerometer was chosen for measuring 3 directions of acceleration such as X, Y and Z axes. After that, the acceleration is converted to displacement and compared the displacement result with VICON motion analysis system to find the accuracy.
2. Materials and Methods
earth gravity force thus the rotation matrix was used to compensate this effect. Afterward, acceleration was converted to displacement by using double integration.
Fig. 1. System block diagram.
2.1. Respiratory and Chest Expansion System
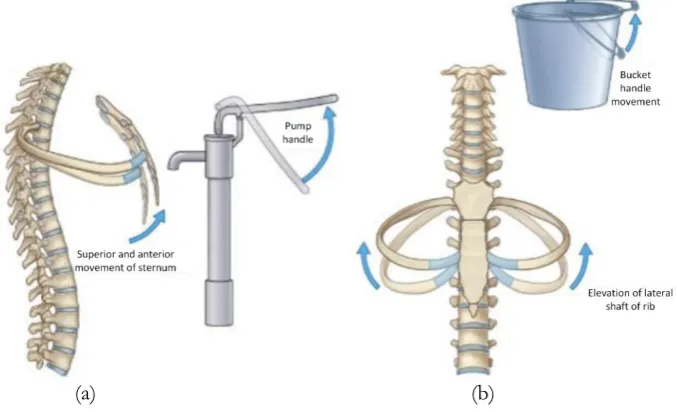
Respiratory System is the process for exchanging oxygen and carbon dioxide inside the lungs. In each lung has 2 thin tissues such as Parietal Pleura and Visceral Pleura. There are Pleural space and Pleural Fluid between them. It causes elasticity and makes the lungs and thorax move together. The thoracic cage contains sternum, costal cartilage and ribs. The main respiratory muscle is diaphragm. When it is pressing down, the volume inside the lungs is increasing and the air can flow into the lungs. Until the pressure inside the lungs equals outside, the diaphragm relaxes and moves back. The air flows out of the lungs and the volume decreases to normal. Therefore, the diaphragm and lungs movements affect the chest expansion. The sternum movement changes the dimensions of the thorax in the anteroposterior direction, it is called “pump handle”. And the ribs movement changes the lateral dimensions of the thorax when the shafts are elevated, it is called “bucket handle” [17]. The two types of chest expansion is illustrated in Fig. 2.
(a) (b)
Fig. 2. The chest expansion movement [17] (a) pump handle and (b) bucket handle.
2.2. Accelerometer and Gyroscope
[image:3.595.75.521.125.165.2] [image:3.595.130.469.372.578.2]their result. The chest expansion movement is slow and has little acceleration then we used ±2g and ±250°/s for our research.
Fig. 3. The accelerometer specification [18] (a) the acceleration in each axis and (b) the mechanism inside the accelerometer.
2.3. Butterworth Digital Low-pass Filter
The acceleration from accelerometer has high frequency because the mechanism inside the sensor has spring and actually sways. The high frequency noise is eliminated by digital low-pass filter. Butterworth low-pass filter is simple to design and has good response for low frequency [20]. The 2nd order Butterworth low-pass filter transfer function (𝐺(𝑠)) is shown in Eq. (1).
𝐺(𝑠) = 𝜔𝑐2
𝑠2+𝑠√2𝜔𝑐+𝜔𝑐2 (1)
And the bilinear transformation for changing Laplace-transform to Z-transform is
𝑠 = 2
𝑇𝑠
1−𝑧−1
1+𝑧−1 (2)
By 𝑇𝑠 is sampling time and substitutes Eq. (2) into Eq. (1) and specifies cutoff frequency (𝜔𝑐). The Z-transform of Butterworth low-pass filter transfer function (𝐺(𝑧)) is shown in Eq. (3).
𝐺(𝑧) = 0.20111−0.6223𝑧1+2𝑧−1−1+0.4268𝑧+𝑧−2 −1 (3)
The transfer function of 𝐺(𝑧)is the relation between output and input. The discrete-time equation, Eq. (4), was converted to find the coefficients.
𝑦[𝑘] = 0.2011𝑥[𝑘] + 0.4022𝑥[𝑘 − 1] + 0.211𝑥[𝑘 − 2] + 0.6223𝑦[𝑘 − 1] − 0.4268𝑦[𝑘 − 2] (4)
where 𝑦[𝑘] and 𝑥[𝑘] are the output and input at current sampling respectively. Therefore, the coefficients of input and output will be multiplied by data at current and previous sampling, 𝑘, and obtain the filtered data.
2.4. Gravity Compensation
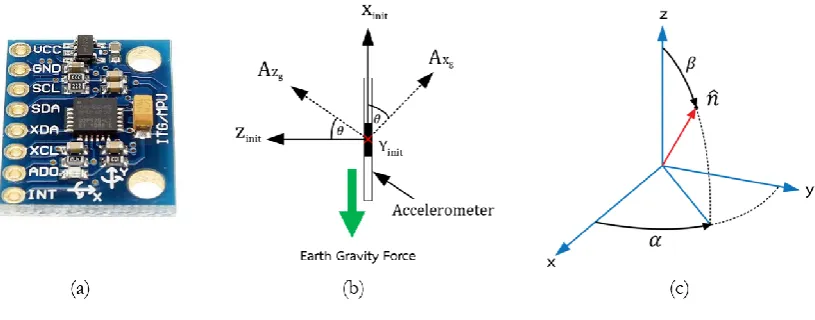
MPU-6050 (InvenSense Inc., USA) accelerometer and gyroscope module is shown in Fig. 4(a) for measuring acceleration in the earth, the earth gravity force affects the accelerometer data. Incorrect acceleration also makes incorrect result. The vector of each accelerometer axis is illustrated in Fig. 4(b) and the equation of acceleration that affected from the earth gravity force is shown in Eq. (5).
[image:4.595.113.503.115.264.2]So the real acceleration is
𝐴𝑟𝑒𝑎𝑙= 𝐴𝑚𝑒𝑎𝑠𝑢𝑟𝑒− 𝑔 (6)
The earth gravity force was compensated by using the rotation matrix. It tracks the object at body frame that moved from reference frame and rotates back to reference point. The rotation matrix contains vectors and angles [21] as shown in Fig. 4(c).
Fig. 4. Vectors of each axis (a) MPU-6050 accelerometer and gyroscope module (b) accelerometer axes and the earth gravity force vector and (c) vector from 3 axes and affected angles.
From Fig. 4(c), the vector (𝑛̂) contains 3 vectors shown in Eq. (7).
𝑛̂ = (𝑐𝑜𝑠𝛼 𝑠𝑖𝑛𝛽, 𝑠𝑖𝑛𝛼 𝑠𝑖𝑛𝛽, 𝑐𝑜𝑠𝛽) = (𝑛1, 𝑛2, 𝑛3) (7)
The rotation matrix of vector and angle [22] is shown in Eq. (8).
𝑅(𝜃, 𝑛̂) = [
𝑐 + (𝑛1)2(1 − 𝑐) 𝑛
1𝑛2(1 − 𝑐) − 𝑠𝑛3 𝑛1𝑛3(1 − 𝑐) + 𝑠𝑛2
𝑛2𝑛1(1 − 𝑐) + 𝑠𝑛3 𝑐 + (𝑛2)2(1 − 𝑐) 𝑛2𝑛3(1 − 𝑐) − 𝑠𝑛1
𝑛3𝑛1(1 − 𝑐) − 𝑠𝑛2 𝑛3𝑛2(1 − 𝑐) + 𝑠𝑛1 𝑐 + (𝑛3)2(1 − 𝑐)
] (8)
where 𝑐 = 𝑐𝑜𝑠𝜃, 𝑠 = 𝑠𝑖𝑛𝜃 and then the vector (𝑛̂) and angle (𝜃) from angular velocity are
𝑛̂ =|𝜔𝜔′′|= 𝜔′
√𝜔𝑥́ 2+𝜔𝑦́ 2+𝜔𝑧́ 2
= [𝑛𝑥, 𝑛𝑦, 𝑛𝑧] = [𝑛1, 𝑛2, 𝑛3] (9)
𝜃 = |𝜔′|∆𝑇 (10)
where 𝜔′ is angular velocity of 3-axis angular velocity and ∆𝑇 is sampling time.
[image:5.595.104.512.202.362.2]2.5. Displacement from Acceleration
The acceleration’s unit is 𝑚𝑠2 and acceleration integration obtains velocity (𝑣(𝑡)) and the unit is
𝑚
𝑠. Then,
velocity integration obtains displacement (𝑑(𝑡)) and the unit is 𝑚. Finally, the displacement from acceleration is converted by double integration and equations are shown in Eq. (11) to (13).
Fig. 5. Block diagram of rotation matrix used concept [21].
𝑣(𝑡) = 𝑣0+ ∫ 𝑎(𝑡)𝑑𝑡𝑡𝑡
0 (11)
𝑑(𝑡) = 𝑑0+ ∫ 𝑣(𝑡)𝑑𝑡𝑡𝑡0 (12)
And then
𝑑(𝑡) = 𝑑0+ 𝑣0(𝑡 − 𝑡0) + ∫ ∫ 𝑎(𝜏)𝑑𝜏𝑑𝑡𝑡𝑡0 𝑡𝑡0 (13)
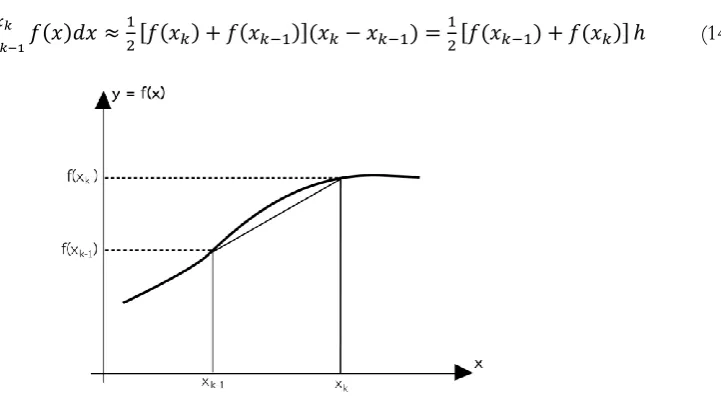
In discrete-time system, the trapezoidal rule is approximated the result from integration or estimated the area under the function curve [23] as shown in Fig. 6. The equation of trapezoidal rule is
∫𝑥𝑘 𝑓(𝑥)𝑑𝑥 ≈21[𝑓(𝑥𝑘) + 𝑓(𝑥𝑘−1)](𝑥𝑘− 𝑥𝑘−1) =12[𝑓(𝑥𝑘−1) + 𝑓(𝑥𝑘)]
𝑥𝑘−1 ℎ (14)
Fig. 6. Discrete-time integration by using trapezoidal rule.
[image:6.595.146.448.166.349.2] [image:6.595.160.521.522.730.2]𝑦[𝑛] = 𝑦[𝑛 − 1] + 1
2𝑓𝑠(𝑥[𝑛 − 1] + 𝑥[𝑛]) (15)
where 𝑦[𝑛] is output at current sample, 𝑥[𝑛] is input at current sample and 𝑓𝑠 is sampling frequency.
2.6. Experiments
Deep breath inhale and exhale were performed to measure the chest expansion. The sensors that including accelerometers and VICON markers will be placed on body around chest and measure displacement while staying with arm-elevated posture. This research is offline measurement, the data will be acquired in 3 breathing cycles and calculated for testing the accuracy of proposed device. At preliminary, we tested our proposed device with robot that moves regularly and stable. Finally, we placed the sensor on subject body and compared the measured result with VICON motion analysis.
2.6.1. Robot moving demonstration
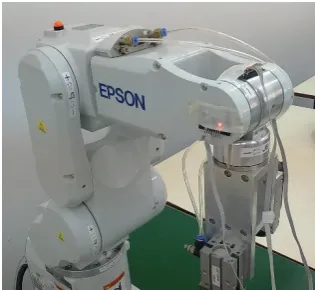
The known rotation and displacement from the robot demonstration is used for measuring the accuracy of sensor and algorithm. Accelerometer was placed on the EPSON CA-A601S robot and shown in Fig. 7. to demonstrate the movement like the chest expansion movement. The repeatability of this robot is ±0.02 mm which means if the robot moves to one position on XYZ-plane, the position error from the reference point will not be more than ±0.02 mm.
Fig. 7. Accelerometer on EPSON CA-A601S robot.
2.6.2. Chest expansion measurement
[image:7.595.236.394.372.517.2]Fig. 8. Sensors placement position on body [24].
2.6.3. Accelerometer data calculation
The accelerometers’ data used Butterworth digital low-pass filter to eliminate the high frequency noise. Next, the acceleration is affected from the earth gravity force and then used rotation matrix to compensate this effect. The data without the earth gravity force still has offset, thus it was eliminated by using mean value subtraction. We sampled the data in period of deep-exhaling to deep-inhaling. Finally, the acceleration was converted to displacement by double integration.
3. Results and Discussion
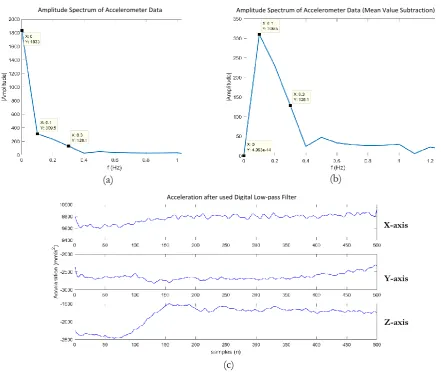
The chest expansion measurement must measure while deep breath inhale and exhale for maximum expansion length. Hence, the deep breath process has low frequency around 0.1-0.3 Hz [14]. The acceleration result of deep breath from accelerometer is shown in Fig. 9(a). The data was acquired with 50 millisecond of sampling period. For maximum expansion, the posture is important. Arm-elevated posture makes the air can flow fluently to lungs and prevents the main shoulder contraction [2]. The chest can expand to maximum and the posture is illustrated in Fig. 9(b).
Fig. 9. The result of deep breath action (a) acceleration data from accelerometer and (b) accelerometer’s vector and arm-elevated posture.
In frequency domain referred in Fig. 10(a), the deep breath signal has low frequency and high amplitude at 0-0.3 Hz. At 0 Hz is offset of signal. This offset is rejected by mean value subtraction without effect to other frequencies and the result is shown in Fig. 10(b). The high frequency noise is eliminated by using Butterworth low-pass filter. Refer to Fig. 10(c), the data is smoother than previous.
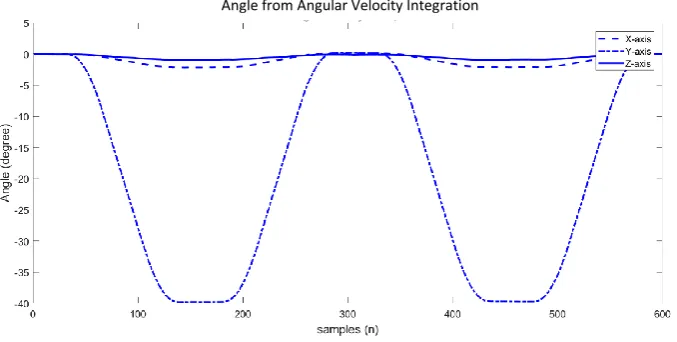
[image:8.595.128.469.72.175.2] [image:8.595.79.511.422.598.2]accelerometer at Y-axis. The rotation around Y-axis causes the acceleration at X and Y axes changed. The angle of angular velocity integration is shown in Fig. 12. It is around 40° at Y-axis.
Figure 13(a) shows the acceleration that passed the gravity compensation algorithm by using rotation matrix. The period of integration was selected from the cycle of robot rotation. The integration range is chosen from stable at the first value until the next stable value. The displacement of double integration is shown in Fig. 13(b). The displacements of X, Y and Z axes are –1.411, 6.428 and -22.46 mm respectively. The total displacement is
𝑡𝑜𝑡𝑎𝑙 𝑑𝑖𝑠𝑝𝑙𝑎𝑐𝑒𝑚𝑒𝑛𝑡 = √(𝐷𝑖𝑠𝑝𝑥)2+ (𝐷𝑖𝑠𝑝𝑦) 2
+ (𝐷𝑖𝑠𝑝𝑧)2
[image:9.595.69.511.242.614.2]= √(−1.411)2+ (6.428)2+ (−22.46)2= 23.404 𝑚𝑚.
Fig. 10. Deep breathe signal data (a) frequency of raw data, (b) frequency of data from mean value subtraction and (c) acceleration data after used Butterworth low-pass filter.
(a)
Amplitude Spectrum of Accelerometer Data
(b)
Amplitude Spectrum of Accelerometer Data (Mean Value Subtraction)
(c)
X-axis
Y-axis
Z-axis
Fig. 11. The acceleration of accelerometer from robot movement at 40° rotation.
Fig. 12. The angle of angular velocity integration from robot movement at 40° rotation.
Therefore, the error of displacement between robot movement and accelerometer at 40° of rotation is 3.915 mm. The data was acquired for 60 sets including15°, 30° and 40° of rotation. The average displacement error and standard deviation of total displacement result from robot demonstration is around 2.242±2.018 mm.
X-axis
Y-axis
Z-axis Acceleration from Accelerometer
[image:10.595.129.468.312.483.2]Fig. 13. The result after used algorithm (a) acceleration after used algorithm and (b) the displacement from double integration of acceleration.
Fig. 14. Data from VICON motion analysis while deep breathing.
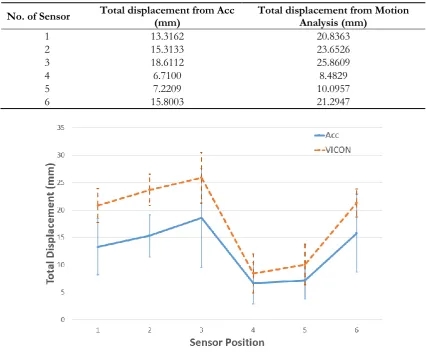
The VICON motion analysis gave X, Y and Z axes result of each marker. The 3 cycles of deep breathing data was plotted by MATLAB and illustrated in Fig. 14. The S1 to S6 represent the marker positions on body as referred to Fig. 8. The summarized displacement result of accelerometers and VICON motion analysis from subject measurement is shown in Table 1 and the graph is illustrated in Fig. 15. The result trend of
(a)
Acceleration with Rotation Matrix
(b)
[image:11.595.82.517.505.682.2]accelerometer follows the VICON motion analysis. The average error and standard deviation are around 7.195±4.361 mm.
Table 1. Displacement result from accelerometer and VICON motion analysis.
No. of Sensor Total displacement from Acc(mm) Total displacement from Motion Analysis (mm)
1 13.3162 20.8363
2 15.3133 23.6526
3 18.6112 25.8609
4 6.7100 8.4829
5 7.2209 10.0957
6 15.8003 21.2947
Fig. 15. Mean and SD of total displacement at each sensor position.
4. Conclusion
At present, the chest expansion is important for physical therapy clinic to track the physical function improvement. The chest expansion moves more than one direction and contains anteroposterior and lateral directions. The MPU-6050 module, consisted of digital accelerometer and digital gyroscope, is used to measure the acceleration in 3 axes in this research. The angular velocity was measured by gyroscope and converted to angular of sensor tilt. Butterworth low-pass filter was used to eliminate the high frequency noise because it is simple to design and implement. The earth gravity force in acceleration data was compensated by rotating the data to reference frame and subtracting with the earth gravity force to eliminate the effect. After that, we used the double integration to convert the acceleration to displacement. For testing the accuracy of sensor and algorithm, the robot was brought to demonstrate the movement that known displacement and moves similar the chest expansion. The displacement from accelerometer showed correctly result. The average error and standard deviation is around 2.242±2.018 mm from 60 sets of data collection. Next, the proposed device was used to measure the chest expansion of human. The result of our proposed device had trend as same as the result from VICON motion analysis. The average error and standard deviation is 7.195±4.361 mm. These results are acceptable to use in practical clinic by the physical therapy expert.
[image:12.595.84.511.139.494.2]sampling rate has low resolution and obtains the error in integration process. The future work we will increase the sampling rate of data acquisition to reduce the error. Next challenge, the online measurement will be developed.
Acknowledgement
This work is supported by Petchra Pra Jom Klao Master’s Degree Research Scholarship from King Mongkut’s University of Technology Thonburi. And very thankfully to Physical Therapy Department from Srinakharinwirot University.
References
[1] C. D. Mathers and D. Loncar, “Projections of global mortality and burden of disease from 2002 to 2030,” PLoS Medicine, vol. 3, no. 11, pp. 2011-2030, Nov. 2006.
[2] J. M. H. Moll and V. Wright, “An objective clinical study of chest expansion,” Annals of the Rheumatic
Diseases, vol. 31, no. 1, p. 1, Jan. 1972.
[3] Ö. İ. Memetoğlu, B. Bütün, and I. Sezer, “Chest expansion and modified Schober measurement values in a healthy, adult population,” Archives of Rheumatology, vol. 31, no. 2, pp. 145-150, 2016.
[4] A Kittidej, P Prapawadee, and S Pranchalee, “Study on chest expansion in lateral plane using accelerometers,” in Proceeding of 139th The IIER International Conference, December 2017, pp. 4-8.
[5] R. G. Manjunatha, N. Ranjith, Y. V. Meghashree, K. Rajanna, and D. R. Mahapatra, “Identification of different respiratory rate by a piezo polymer based nasal sensor,” Sensors IEEE, vol. 2013, pp. 1-4, 2013. [6] R. Dey, U. Thakur, L. Sunny, L. D'Almeida, and K. Chakravarty, “Digital chest expansion measurement
& its biomedical application,” in E-Health and Bioengineering Conference, November 2015, pp. 1-4.
[7] G. B. Gentili, V. Tesi, M. Linari, and M. Marsili, “A versatile microwave plethysmograph for the monitoring of physiological parameters,” IEEE Transaction on Biomedical Engineering, vol. 49, no. 10, pp. 1204-1210, Oct. 2002.
[8] I. Milesi, M. Norgia, P. P. Pompilio, C. Svelto, and R. L. Dellaca, “Measurement of local chest wall displacement by a custom self-mixing laser interferometer,” IEEE Transaction on Instrumentation and
Measurement, vol. 60, no. 8, pp. 2894-2901, Aug. 2011.
[9] Y. W. Bai, W. T. Li, and C. H. Yeh, “Design and implementation of an embedded monitor system for body breath detection by using image processing methods,” in Digest of Technical Papers International
Conference on Consumer Electronics, February 2010, pp. 193-194.
[10] X. Gao, E. Shahhaidar, C. Stickley, and O. Boric-Lubecke, “Respiratory angle of thoracic wall movement during lung ventilation,” IEEE Sensor Journal, vol. 16, no. 13, pp. 5195-5201, July 2016. [11] K. P. Cohen, W. M. Ladd, D. M. Beams, W. S. Sheers, R. G. Radwin, W. J. Tompkins, and J. G. Webster,
“Comparison of impedance and inductance ventilation sensors on adults during breathing, motion, and simulated airway obstruction,” IEEE Transaction on Biomedical Engineering, vol. 44, no. 7, pp. 555-566, July 1997.
[12] P. D. Hung, S. Bonnet, R. Guillemaud, E. Castelli, and P. T. N. Yen, “Estimation of respiratory waveform using an accelerometer,” in IEEE International Symposium on Biomedical Imaging: From Nano to
Macro, 2008, pp. 1493-1496.
[13] A. Bates, M. J. Ling, J. Maan, and D. K. Arvind, “Respiratory rate and flow waveform estimation from tri-axial accelerometer data,” in IEEE International Conference on Body Sensor Networks, 2010, pp. 145-150. [14] G. Shafiq and K. C. Veluvolu, “Multimodal chest surface motion data for respiratory and cardiovascular
monitoring,” Scientific Data, vol. 4, p. 170052, 2017.
[15] K. Appelt, “Biomechanics of the thoracic spine—Development of a method to measure the influence of the rib cage on thoracic spine movement,” doctoral dissertation, Center for Surgery, Institute for Trauma Surgery and Biomechanics, University of Ulm, Germany, 2012.
[16] J. E. McNamara, B. Feng, K. Johnson, S. Gu, M. A. Gennert, and M. A. King, “Motion capture of chest and abdominal markers using a flexible multi-camera tracking system for correcting motion-induced artifacts in cardiac SPECT,” in IEEE Nuclear Science Symposium Conference Record, 2007, pp. 4289-4293.
[18] Gunjanpatel. (2016). Accelerometer Sensor Specifications [Online]. Available: https://gunjanpatel.wordpress.com/2016/07/14/accelerometer-sensor-specifications/ [Accessed: 1 May 2018]
[19] D. H. Titterton and J. L. Weston, “Gyroscope technology 1,” in Strapdown Inertial Navigation Technology. London: The Institution of Electrical Engineers, London, 1997, pp. 58-59.
[20] L. F. Chaparro, “Introduction to the design of discrete filters,” in Signals and Systems Using MATLAB. Elsvier Inc., 2010, pp. 654-658.
[21] A. J. Hanson, “Road map to quaternion visualization,” in Visualizing Quaternions. Elsevier Inc., 2006, pp. 46-48.
[22] A. Janota, V. Šimák, D. Nemec, and J. Hrbček, “Improving the precision and speed of Euler angles computation from low-cost rotation sensor data,” Sensors, vol. 15, no. 3, pp. 7016-7039, Mar. 2015. [23] C. J. Zarawski, “Numerical integration and differentiation,” in An Introduction to Numerical Analysis for
Electrical and Computer Engineers. John Wiley & Sons, 2004, pp.371-375.
![Fig. 3. The accelerometer specification [18] (a) the acceleration in each axis and (b) the mechanism inside the accelerometer](https://thumb-us.123doks.com/thumbv2/123dok_us/8106567.235267/4.595.113.503.115.264/fig-accelerometer-specification-acceleration-axis-mechanism-inside-accelerometer.webp)
![Fig. 8. Sensors placement position on body [24].](https://thumb-us.123doks.com/thumbv2/123dok_us/8106567.235267/8.595.79.511.422.598/fig-sensors-placement-position-body.webp)