M
ULTIPLEXED
P
ROTEIN
D
ETECTION
Thesis by
Habibullah Ahmad
In Partial Fulfillment of the Requirements for the degree of
Doctor of Philosophy
CALIF ORNIA INSTITUTE OF TECHNOLOGY
Pasadena, California 2011
© 2011
Habibullah Ahmad
This work is dedicated to my mother,
Acknowledgements
The pursuit of a PhD is one of the most ambitious goals I have ever undertaken. The
past several years have been a period of intense scientific, intellectual, and personal
growth for me; I have learned in equal measures new technical skillsets, how to conduct
scientific research, and much about who I am as a person and who I want to be. The
wonderful environment of Caltech has played a huge role in my growth, and I am deeply
indebted to many people for this.
I would like to thank my advisor, Dr. Jim Heath, for the opportunity to work in his lab,
and for working harder than any of his students to keep it well-funded. His focus on
meaningful, immediate science afforded me great motivation throughout my studies,
and his scientific vision is truly exceptional and inspirational. I would also like to thank
Dr. Michael Ogawa, my undergraduate research advisor at Bowling Green State
University. Dr. Ogawa was instrumental in kindling my interest in chemistry, and he
provided me amazing opportunities while I worked in his lab. The impact of his
nurturing and encouragement cannot be understated, and without him, I simply would
not have pursued my studies at Caltech. I’m also indebted to Dr. Peter Willis and Dr.
Kristen Beverly, who have remained the best of my mentors in the lab; they patiently
I’ve had the privilege of working with truly excellent colleagues throughout my studies.
I’m particularly appreciative of Dr. Michael McAlpine, with whom I had a very
productive working relationship that yielded several papers related to nanowire-based
electronics on flexible substrates. Likewise, Dr. Rong Fan was also an immense credit to
my scientific development and he worked with me extensively on DNA patterning
projects. Together, Mike and Rong created an incredibly productive, synergistic,
collaborative atmosphere which I hope to find or establish wherever I go. I would also
like to thank Dr. Jun Wang, with whom I worked on a variation of the blood chip, Young
Shik Shin, who worked with me on improving DNA flow patterning, and Alex Sutherland,
who made concrete contributions to my microfluidic robotics project.
Scientific work aside, I would like to acknowledge all of my colleagues in the Heath lab
over the years. With rare exception, they have made working here a genuine pleasure,
and I count many of them among my personal friends. My office mates, Johnny Green,
Akram Boukai, Rob Beckman, Yuri Bunimovich, John Nagarah, Ke Xu, Alex Sutherland,
Himanshu Mishra, and Joey Varghese, deserve special mention. I’d like to thank Kevin
Kan and Diane Robinson for all their cheerful help and friendship over the years; in
addition, Dian Buchness, Agnes Tong, Steve Gould, and Joe Drew have all patiently
attended to so many of my needs during my time here. I would like to specially thank
Mike Roy, who was extremely helpful and meticulous with my machining needs at work,
I would also like to thank Mike Krout, who has been a close personal friend and (perhaps
unknowingly) a continuous source of inspiration for me to persevere throughout my
years here.
I must briefly make mention of some of the personal friends who have added color to
my life during my time here. Rafed Al-Huq, Yusef Attia, Ali Gurel, Yernur Burketbeyevich
Rysmagambetov, Saken Sherkhanov, Mansur Wadalawala, Mehmet Yenmez, and
Bahattin Yildiz are among the best friends I have had, and they each supported me
through the lows and helped me celebrate the highs.
Finally, and most importantly, I would like to thank Amina Ahmad and Amin Ahmad, my
mother and my brother. They have both been unyielding sources of support and
encouragement throughout my life, they have pushed me personally to achieve my full
potential, and they have always looked out for my best interests. Both have made
immense sacrifices in their own lives to give me the opportunity to pursue my PhD, and I
Abstract
This thesis describes the development of microfluidic platforms that enable cheap,
facile, rapid, and multi-parameter protein sensing. The first section of this work
describes two strategies for high density DNA microarray patterning: microcontact
printing and flow patterning. A protocol is provided for micron-scale alignment of
multiple PDMS stamps to a single substrate, and a simple strategy to allow very low
aspect-ratio stamping is enumerated.
The second section describes the formation of high density antibody microarrays using
flow patterned DNA microarrays in conjunction with DEAL chemistry, and applies these
microarrays to biological measurements. The platform’s performance is first
characterized using a human chorionic gonadotropin assay, and is subsequently used to
stratify 22 cancer patients from frozen serum samples by quantifying the levels of
twelve serum proteins. A microfluidic plasma separation device is then detailed to allow
for similar measurements from fresh finger pricks of blood.
The third section of this work outlines improvements to the flow patterning platform
through two alternate schemes: covalent attachment and DMSO patterning. Both
protocols are shown to dramatically increase the consistency of microarray elements
across a single chip when compared to the initial method. Theoretical simulations are
The fourth section describes the design and fabrication of a robotics system that is
capable of autonomously interfacing and manipulating PDMS substrates, and its
application to producing barcode microarrays. The resulting substrates show
unprecedented consistency from chip to chip, and we demonstrate through massively
parallel single-cell measurements that data derived from different substrates is
statistically indistinguishable.
Finally, we introduce an integrated software and hardware package designed to
facilitate and automate microfluidic control at the laboratory level. We further provide
the technical details of a related system which optimizes and comprehensively
automates microfluidic blood assays such that even non-technical users who have never
worked with microfluidics can regularly obtain the same standard of data that is
Table of Contents
________________________________________________________________________
Acknowledgements ……….. iv
Abstract ……… vii
Table of Contents ………. ix
List of Figures ……… xiii
Chapter 1: Introduction ……… 1
1.1 Introduction ……… 1
1.2 DNA Patterning ……… 5
1.3 Technical Issues ……….. 7
1.4 Chemistry ………. 10
1.5 Flow Patterning ……… 12
1.6 Thesis Overview ……….. 15
1.7 Figures ……… 19
1.8 References ……….. 25
Chapter 2: Integrated barcode chips for rapid, multiplexed analysis of proteins in microliter quantities of blood ……….. 27
2.1 Introduction ……….. 27
2.2 Results and Discussion ……… 29
2.2.2 Assay Sensitivity as a Function of DNA Patterning
Concentration ………. 32
2.2.3 Multi-parameter Analysis of Frozen Serum Samples 34
2.2.4 Multi-parameter Fresh Blood Analysis ……… 38
2.3 Conclusions ……….. 39
2.4 Experimental Methods ………. 40
2.4.1 Micropatterning of Barcode Arrays ……… 40
2.4.2 Fabrication of IBBCs ………. 41
2.4.3 Clinical Specimens of Cancer Patient Sera ………….. 41
2.4.4 Collecting a Finger Prick of Blood ……….. 42
2.4.5 Quantification and Statistics ………. 44
2.5 Figures ……… 45
2.6 Tables ………. 55
2.6 References ……….. 59
Chapter 3: Chemistries for Patterning Robust DNA MicroBarcodes Enable Multiplex Assays of Cytoplasm Proteins from Single Cancer Cells ………. 61
3.1 Introduction ………. 61
3.2 Results and Discussion ………. 63
3.2.1 Device Design and Functionalization Schemes …... 63
3.2.2 DMSO Mechansim and Simulations ………. 65
3.2.3 Covalent Attachment Mechanism and Comparison 68
3.3 Conclusions ……… 72
3.4 Experimental Section ………. 73
3.4.1 Microfluidic Chip Fabrication for DNA Patterning 73
3.4.2 Patterning of DNA Barcode Arrays ………. 74
3.4.3 Microfluidic Chip Fabrication for Multi-protein Detection ……… 75
3.4.4 Cell Culture ……….. 76
3.4.5 Multi-protein Detection ……… 76
3.4.6 On-chip Cell Lysis and Multiplexed Intracellular Protein Profiling from Single Cells ……….. 77
3.4.7 Data Analysis ………. 78
3.4.8 Molecular Dynamic Simulations ………. 78
3.5 Figures ………. 80
3.6 Tables ……….. 89
3.7 References ………. 91
Chapter 4: A Robotics Platform for Automated Batch Fabrication of High Density, Microfluidics-Based DNA Microarrays, with Applications to Single Cell, Multiplex Assays of Secreted Proteins ………. 94
4.1 Introduction ……… 94
4.2 Experimental Section ……….. 97
4.2.1 Robtics Design ……… 97
4.2.2 Substrate Fabrication ……… 100
4.3 Results and Discussion ………. 102
4.3.1 Pattern Fidelity and Chip-to-Chip Consistency … 102 4.3.2 Single Cell Studies ………. 103
4.4 Conclusions ……….. 108
4.5 Figures ………. 110
4.6 References ……… 117
4.7 Appendix A: Source Code ………. 119
Chapter 5: An Integrated Hardware and Software System for Automating Microfluidics ……… 204
5.1 Introduction ……… 204
5.2 Methods and Materials ……… 207
5.2.1 Software ……….. 207
5.2.2 Hardware ………. 207
5.2.3 Microfluidics ………. 209
5.3 Results and Discussion ………. 210
5.4 Conclusions ……….. 215
5.5 Figures ………. 217
5.6 References ……… 222
5.7 Appendix A: PCB Design ………. 223
List of Tables and Figures
________________________________________________________________________
Chapter 1
Figure 1.7.1 Microcontact printing schematic and results …. 19
Figure 1.7.2 Stamp fabrication and alignment ………. 20
Figure 1.7.3 MA-6 derived alignment quality ………. 21
Figure 1.7.4 Common stamp failure modes ………. 22
Figure 1.7.5 Surface contamination from PDMS stamps ….. 23
Figure 1.7.6 Discontinuous array features via flow patterning 24
Chapter 2
Figure 2.5.1 Blood Separation and DEAL barcode scheme .. 45
Figure 2.5.2 DNA oligomer orthogonality ……….. 46
Figure 2.5.3 Flow patterning technique overview ………….. 47
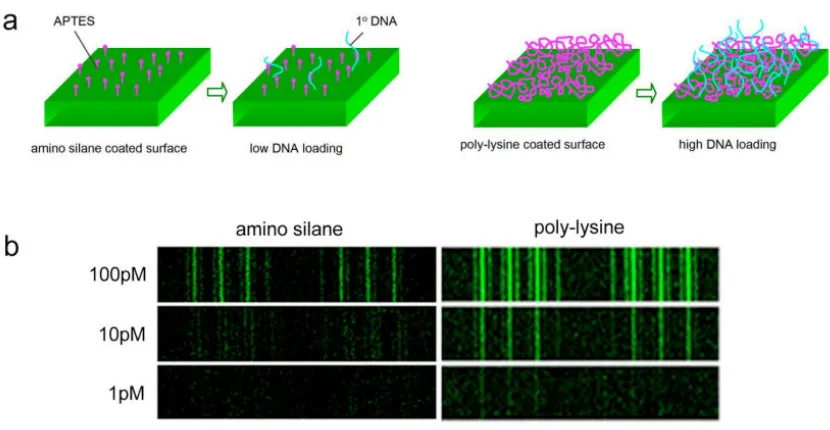
Figure 2.5.4 Surface coating effect on DNA barcode loading 48
Figure 2.5.5 DNA Barcode sensitivity ……… 49
Figure 2.5.6 hCG calibration curves ……… 50
Figure 2.5.7 Blood assay protein cross reactivity ………. 51
Figure 2.5.8 Blood assay protein calibration curves ……….. 52
Figure 2.5.9 Frozen patient sera data and analysis …………. 53
Table 2.6.1 Protein panel and corresponding DNAs ………. 55
Table 2.6.2 DNA oligomer sequences ………. 56
Table 2.6.3 Patient medical records ……… 57
Chapter 3
Figure 3.5.1 Covalent and DMSO patterning schemes …… 80
Figure 3.5.2 DNA deposition mechanism ……… 81
Figure 3.5.3 Theoretical models explain DMSO patterning 82
Figure 3.5.4 PDMS patterning characterization ……… 83
Figure 3.5.5 DMSO effects on water-DNA interactions …. 84
Figure 3.5.6 Raw data comparing patterning schemes ….. 85
Figure 3.5.7 Single cell experiment scheme and data …….. 86
Figure 3.5.8 Antibody cross-reactivity ……….. 87
Figure 3.5.9 Protein calibration curves ………. 88
Table 3.6.1 DNA oligomer sequences ……… 89
Table 3.6.2 Antibody panel and corresponding DNA ……. 90
Chapter 4
Figure 4.5.1 Robotics component overview ……… 110
Figure 4.5.2 Barcode substrate preparation ………. 111
Figure 4.5.3 Machine-made barcode fidelity and repeatability 112
Figure 4.5.4 Single cell secretion experiment overview … 113
Scheme 4.5.1 Robotics simplified pressure system ……….. 115
Scheme 4.5.2 Robotics process flowchart ………. 116
Chapter 5
Figure 5.5.1 Portable, USB solenoid control hardware ……. 217
Figure 5.5.2 Fully automated blood chip hardware ………… 218
Figure 5.5.3 Laboratory microfluidic control software ……. 219
Figure 5.5.4 Fully automated blood chip software …………. 220
Chapter 1
1.1 Introduction
Throughout the 1990s, the ongoing Human Genome Project promised to provide a
quantum leap forward in our understanding of developmental and disease biology.
While the genome did provide indispensable insight, it became clear in the decade that
followed that the proteome was a far richer target in this regard. Although the genetic
code may initially define a biological system, its subsequent contributions can vary
wildly as a result of external factors that simply cannot be captured within the
nucleobase sequence. Conversely, the proteome explicitly represents the end product
of a system’s configuration, and its characterization can yield a much greater
understanding of what that system is trying to accomplish and how.
As the importance of measuring proteins came into focus in the past decade, so too did
competing philosophies of how to study them. The previous half century was
dominated by so-called “reductionist” biology, wherein scientists tried to understand
the complexities of biological systems by breaking them down into their most basic
subunits (i.e. proteins) and then exhaustively characterizing those individually1. Thus,
pathway models described biological functions as discrete, autonomous collections of
proteins that adhere to a rigid script of interactions to produce a desired outcome.
that proteins can have rich interaction profiles that entwine multiple, seemingly
unrelated pathways into overarching protein networks. The central tenet of the
systems biology philosophy, then, is that for any characterization of a protein to be
meaningful, it must be placed in the context of its surrounding network2. Just as a DNA
sequence alone cannot accurately predict the resulting system, nor can a single protein
in isolation accurately describe a biological system’s state.
This principle is readily illustrated in cancer systems. Broadly speaking, a cancerous
state results when regulatory mechanisms of a cell become damaged by deletion,
constitutive activation, etc. and the cell proliferates unchecked. However, the
malfunction may be ascribed to damage in any of several pathways that converge upon
that regulatory mechanism, and so a measurement of the latter alone will not
necessarily provide actionable treatment information unless further enumerated3.
Reciprocally, the systems biology approach predicts that a disruption in one part of a
protein network will affect many other nodes at varying magnitudes. By simultaneously
monitoring multiple nodes within a network, it may be possible to recognize
“fingerprints” that are bespoke to a particular disease or variant thereof. Ideally, with
regular monitoring, these perturbations may be detected before they grow to
consequential levels. Indeed, positive treatment prognoses for many cancers are highly
dependant on how early they are detected. Thus, embracing a systems biology
proteome diagnostics, and this is the driving principle for much of the work in this
thesis.
Accurately characterizing protein expression levels is particularly challenging because,
unlike DNA, proteins cannot be arbitrarily amplified. Among the known blood
proteome, proteins can range in concentration from up to 109 pg/mL to as low as 1
pg/mL and below4, and proteins found in the least abundance are suspected to be the
most useful indicators in many cases. Cytokines, responsible for cell-to-cell
communication, are almost exclusively in the 100 pg/mL and lower regime, as their local
effective concentrations are highly diluted upon introduction to the main bloodstream.
Detection of such rare proteins is further complicated by the overabundance of
albumin, which can contribute to nonspecific fouling and constitutes a significant noise
source for most types of measurements.
Today, the gold standard for quantitative protein measurements remains the ELISA.
This assay uses a sandwich of antibodies to specifically immobilize and identify a target
protein via a chromogenic readout. However, the technique scales very poorly and is
ill-suited to the requirements of a systems biology-derived diagnostic on account of cost,
sample consumption, and labor required. To fill this void, there have been concerted
and very promising strides towards harnessing electronic measurements to detect
proteins via chemically gated field effect transistors (FETs)5, impedance spectroscopy6,
work was aimed at producing functionalized silicon nanowire sensors, although those
results are not included here. Instead, we focused on traditional optical detection and
developed an assay that leverages the ELISA concept, but adds small refinements that
allow the creation of high density antibody microarrays which spatially distinguish
individual protein assays. Specifically, the DNA Encoded Antibody Library (DEAL)
technique decorates capture antibodies with unique sequences of ssDNA; when
introduced to a standard DNA microarray, a mixture of such antibodies self-assemble via
complementary hybridization so that each DNA spot assays a unique protein8. Following
analyte capture, the assay is completed with biotinylated secondary antibodies, which
are then developed with fluorescently-tagged streptavidin. A standard microarray
scanner quantitates the fluorescent readout.
The development of DEAL provided an opportunity to simultaneously perform
multiplexed protein sandwich assays at drastically higher densities than the 96-well
plates utilized for traditional ELISAs. Using a standard DNA microarray as a substrate
meant that each protein assay was performed within a 150µm spot, and was separated
by just 150µm from the next assay. When coupled with microfluidic technology, this
newfound density enabled massively parallel protein measurements from rare samples.
Yet, on the scales of either microfluidics or biology, a 300µm pitch can hardly be
considered “dense”; microchannels are readily fabricated in the low-micron range, while
to generate DNA microarrays that matched these dimensions in the hopes of enabling
novel experiments at the single cell level.
1.2 DNA Patterning
In order to serve as a practical replacement for the larger, traditionally-spotted DNA
microarrays, our new substrates had to fulfill several requirements. Fundamentally, it
was critical to have arbitrary control over feature size and morphology in the low micron
range. Ideally, the new patterning method should also not be constrained by a rigid
array architecture, i.e. it should allow for irregular spacing among features, and it should
also have some provision for positional control of patterned elements. These latter
requirements are important if elements of the array need to interact with predefined
features on a substrate or within a microfluidic circuit. Among the practical constraints
was that the patterning procedure be relatively rapid, easy to execute, and ideally it
could be performed in our own lab. Finally, a low-cost solution was preferred.
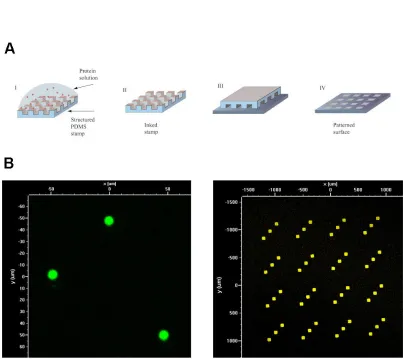
Microcontact printing (µCP), one of a battery of soft lithography techniques developed
by the Whitesides group9,10, emerged as an ideal candidate which fulfilled most of the
aforementioned requirements. The process is directly analogous to a macroscale
rubber stamp, wherein ink is applied to a featured surface which is then brought into
stamp (Figure 1.7.1a). By substituting a PDMS device for the rubber stamp, µCP inherits
all the dimensional and morphological flexibility of long-standing microfabrication
techniques. Moreover, because the technique is parallel in nature, patterning
thousands of feature instances for an array takes no more time than patterning a single
one. Finally, µCP fares well from a cost perspective.
The obvious potential of this technique in the DNA microarray arena led to a 2004
report of high quality, patterned DNA deposition with feature sizes as small as 1µm via
µCP. However, the technique involved a cumbersome, 45-minute inking process which
reduced its viability for high throughput production of multi-component microarrays11.
This was closely followed by a report detailing a much faster and more convenient
procedure wherein DNA first adheres to the hydrophobic PDMS stamp via van der Waals
interactions with its bases, and is then efficiently transferred to a positively-charged
substrate via electrostatic interactions along the phosphate backbone12. This latter
work inspired our efforts, and we quickly reproduced its results within the lab (Figure
1.7.1b). However, two unresolved technical issues prevented the platform’s immediate
1.3 Technical Issues
Creation of a multi-component DNA library via µCP is predicated upon the ability to
align multiple stamps precisely to their target substrate (Figure 1.7.2a); as the feature
density shrinks, so too does positioning tolerance. While solutions for this requirement
have recently been reported13-15, at the time it remained an open problem. We tackled
the issue by capitalizing on the fine alignment capabilities of a Karl Süss MA-6
photolithography apparatus, which is designed to facilitate micron-scale alignment
between photomasks and substrates. Ideally, an inked PDMS stamp would simply
replace or be affixed to the photomask, while our microarray substrate would be placed
on the wafer chuck below. However, when initiating alignment, the MA-6 performs a
mandatory “wedge error correction” (WEC) routine wherein the substrate is briefly
brought into contact with the photomask to ensure that the two are parallel before it
drops down to the specified alignment gap. Thus, the substrate would be inked without
any opportunity for alignment.
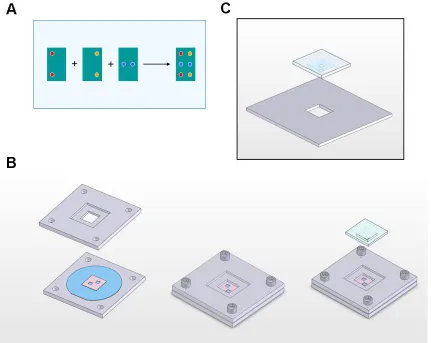
To circumvent this problem, the photomask was replaced by a precisely machined 1/8”
thick plate bearing a central cutout. At the same time, the PDMS stamps were cast
using a special aluminum stencil which creates a two-tiered substrate: the bottom tier’s
dimensions correspond to the photomask plate’s cutout, but it is marginally (ca. 25µm)
thicker and bears the desired microfeatures on its underside; the top tier simply
and the resulting stamp structure. In practice, substrates are loaded into the MA-6 and
allowed to perform WEC against the bare photomask plate. Once the alignment gap is
established, an inked stamp is inserted into the plate’s cutout; the stamp’s lip precisely
positions the lower tier’s microfeatures slightly below the plate surface. At this stage,
fine alignment can be achieved by matching corresponding fiducials on the
optically-transparent stamp and the substrate underneath via the MA-6’s micromanipulators.
Printing is accomplished by slowly reducing the alignment gap until the substrate and
stamp make contact, as readily evidenced by a contrast change in the stamp features.
Finally, the alignment gap is re-introduced, the spent stamp is lifted out, and the system
is ready to load the next inked stamp. Once WEC is performed, the entire loading and
alignment procedure for subsequent stamps generally requires only a couple of
minutes.
The MA-6-based approach to multiple stamp alignment proved a satisfactory solution,
exhibiting low-micron alignment precision and a fast, cheap, and non-demanding
protocol. Figure 1.7.3 demonstrates the quality of alignment achieved across a variety
of µCP patterns. Indeed, the solution proved so robust that minor variations of it have
subsequently been employed to align densely-featured fluidic control and flow layers
during PDMS fabrication, to align completed microfluidic molds with finely-featured
Silicon substrates16, and even to position SNAP17 nanowire masters onto their target
The second major technical challenge related to microcontact printing of DNA
microarrays derives from the deformable nature of PDMS. Specifically, feature height
becomes an important parameter that must be carefully tuned according to feature size
and feature density to prevent aberrant ink transfer18,19. Excessively tall features (high
aspect ratio) are prone to tearing upon demolding, and can buckle or collapse laterally
during stamping. Conversely, shorter features (low aspect ratio) are resistant to those
failure modes but become prone to “roof collapse,” wherein recessed areas between
features sag or collapse onto the substrate (Figure 1.7.4). Most approaches to
mitigating these issues focus on low aspect ratio features and make additional
provisions to prevent roof collapse. The most basic such strategy is to simply add broad
support structures in close proximity to small features of interest11. However, this still
results in extraneous, though controlled, ink transfer, and is clearly not an ideal solution
when creating large, high-density microarrays. An alternative solution is to utilize
customized, harder formulations of PDMS20-22 that are more resistant to deformation;
these result in significantly better feature fidelity which extends well into the
sub-micron range.
We developed a method for stamping low aspect ratio features that avoids specialty
materials and is trivial to integrate into the standard PDMS fabrication workflow. By
introducing a rigid material within the body of the stamp, the degree of deformation
allowed at the stamp surface is significantly reduced. We implemented this solution by
into our aluminum casting stencil (Figure 1.7.3a) and degassing, the glass support is
introduced parallel to the underlying wafer and pushed firmly to the bottom of the
stencil. The result is an exceedingly thin layer of PDMS along the bottom of the stamp
which is chemically adhered to the rigid glass slide during the curing process, leaving
little room for unwanted deformation or sagging. We found this to be an excellent
solution in the low micron regime relevant to our microarray fabrication, but did not
perform limit testing to determine if the benefits extend to sub-micron features. For
our purposes, the reinforced stamps were easily able to pattern 5µm-tall features at
1mm intervals – a lateral aspect ratio of 200:1 – without any threat of roof collapse.
This represents a significant advance over unmodified stamping limits, and eliminates
the last technical hurdle for practical microarray production via microcontact printing.
1.4 Chemistry
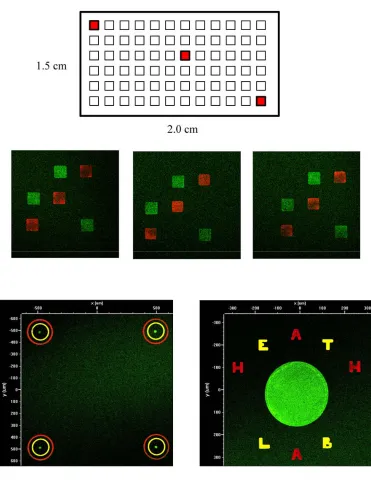
With our mechanical limitations resolved, we began generating microarrays tailored to
investigate single-cell secretions. The goal was to create a large array of “bulls-eye”
structures wherein the central spot of each would, using DEAL reagents, immobilize a
single cell while the surrounding rings captured its secreted cytokines (Figure 1.7.4).
However, we quickly found that stamped microarrays behaved very differently than
spotted ones when used for DEAL assays. An investigation using fluorescent reagents
they formed a completely inverted pattern wherein the complimentary DNA spot was
not populated at all while the surrounding background areas were intensely patterned
(Figure 1.7.5a).
After considerable study, we found the behavior was an indirect result of contaminants
that leach from our PDMS stamps and are co-deposited with DNA; during the initial
blocking step of the DEAL process, BSA is preferentially recruited to these contaminants
and very efficiently prevents subsequent assembly of the capture antibody. The finding
was not unprecedented23,24, particularly among polar inks25, and we tried a slew of
methods to suppress it. A lengthy swelling procedure26 designed to remove
un-crosslinked monomers from bulk PDMS failed to alleviate the problem. Attempts to
mask the contaminants by adding a fluoropolymer coating (DuPont Teflon AF) or
patterned photoresists to the stamp surface yielded a sharp decrease in feature fidelity
and degraded many of the PDMS’s physical characteristics required for µCP.
Rather than remove the PDMS contaminants, an alternative strategy lay in omitting BSA
from our DEAL protocol. While other biological blocking agents, such as casein, yielded
similarly inverted patterns, we found that PEGylating the substrate did not inhibit
capture antibodies from hybridizing with their target DNA spots. However, PEG also
proved insufficient for blocking non-patterned areas effectively, as electrostatic
interactions between the capture antibody’s DNA and the aminated surface yielded
substrate with acetic anhydride, yielding a negatively-charged carboxylate surface. The
combination of surface treatments finally provided a µCP-generated DNA microarray
that was usable for DEAL experiments (Figure 1.7.5c), but due to lingering unease about
PDMS contamination, concerns about DNA loading, and the concurrent development of
an alternative patterning technique, we did not push this technology forwards.
1.5 Flow Patterning
The strikingly inverted images that we first obtained when performing DEAL assays on
stamped microarrays inspired a new approach to DNA patterning. If regions of our
substrate which had come into contact with PDMS and BSA were particularly resistant
to further protein aggregation, while non-contacted areas readily adsorbed DNA-laden
antibodies despite BSA blocking, why not invert the paradigm? Here, a PDMS slab
would contact all the “background” areas of the substrate while maintaining recessed
regions that correspond to the desired microarray features. Put simply, a PDMS device
bearing channels would be bonded to a substrate and the channels filled with DNA
solutions, thereby depositing DNA according to the channel morphology. Thus, in a
somewhat convoluted way, the very simple idea of flow patterning was conceived.
Initial attempts at flow patterning relied on electrostatic interactions with a
solutions were flushed away and rinsed with PBS buffer. While fluorescently-tagged
oligomers indicated that the technique produced the expected patterns, DEAL
experiments revealed that an insufficient amount of DNA was immobilized via this
procedure, as evidenced by poor assay sensitivities. Consequently, we allowed our
patterning solutions to evaporate and thereby deposit a significant fraction of their DNA
on the substrate surface. This was followed by thermal or UV27 crosslinking and
produced densely-loaded patterns as desired. Moreover, the contamination principle
from our µCP experiments held, and the flow-patterned arrays exhibited extremely low
background during assays.
The flow patterning method is subject to a unique set of advantages and disadvantages
when compared with µCP. Chief among the former is certainly the useful contaminant
distribution, but there are additional benefits as well: because the procedure is an
evaporative one, the amount of DNA deposited can be directly tuned by altering the
patterning solution’s concentration – a relationship which was much more tenuous with
µCP. In addition, alignment issues amongst microarray elements become moot, as they
are all defined monolithically with photolithographic precision. However, flow
patterning is hamstrung by the fact that its reagent channels must be topologically
continuous; when implemented in traditional 2D microfluidics, this prohibits
discontinuous features such as traditional microarray spots and severely limits the scope
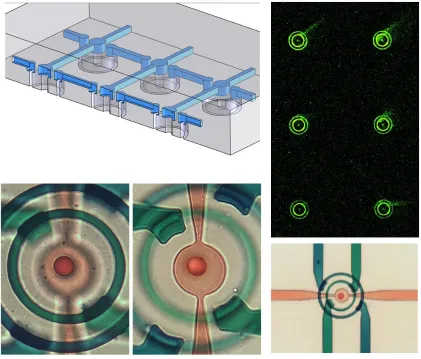
We sought to address this limitation by developing a 3D microchannel network, and
targeted production of the same bulls-eye structure patterned earlier via µCP. The key
component required for such a network is the crossover channel which transfers fluid
between the upper and lower layers of a 2-layer network. Although multiple methods
for accomplishing this have been reported 28-30, we developed a very simple protocol
which does not require any extra steps during PDMS fabrication. Specifically, we
generated a two-level lower flow layer from SU-8 wherein flow channels were patterned
at 25µm height and crossover points were patterned as 50µm-tall posts that overlapped
them. The upper flow layer was simply patterned at a uniform 25µm height. During
device fabrication, the lower layer was spin-coated with PDMS at 5000 RPM for 60
seconds, yielding a very thin layer of PDMS. It is unclear if the tall posts protrude from
the thin layer at this stage, or if they are covered by a thin membrane which is ruptured
during curing (as the PDMS shrinks) or demolding. In any case, standard 2-layer
protocols applied to these photoresist masters yield functional interlayer vias in unit
yield. Figure 1.7.6 demonstrates successful implementation of a 3D flow patterning
network to create a microarray comprised of 49 discontinuous, 3-element bulls-eye
features.
The bulls-eye patterns, though a strong technical demonstration of our patterning
capabilities, were never utilized for single-cell secretion studies. Among its demerits, it
proved to be an inefficient architecture which would not scale well as more array
“barcode” microarray, gained traction as a high density, trivially fabricated alternative.
These barcode substrates have unlocked a unique opportunity in our lab to measure
multiple intracellular and secreted proteins from single cells, and they have played a
fundamental role in several publications which are not detailed in this thesis. They
continue to constitute an instrumental component in the majority of our lab’s ongoing
biological projects.
1.6 Thesis Overview
This thesis discusses the development of the flow patterned DNA microarrays into a
robust platform that is capable of supporting accurate, consistent, and convenient
bioassays for clinical diagnostics. Chapter 2 introduces the aforementioned barcode
morphology and demonstrates its utility as a substrate for the DEAL platform. We
demonstrate that the sensitivity of DEAL assays is directly dependant on the substrate’s
DNA loading, and take advantage of this fact to measure proteins with a dynamic range
of over five orders of magnitude. The technology is validated by correctly determining
the levels of human chorionic gonadotropin (hCG), a common pregnancy marker, from
two serum samples in a blind test. We then apply this platform to the analysis of a
dozen proteins from frozen cancer-derived serum samples. Finally, we adopt a
microfluidic circuit for blood plasma separation and use it in conjunction with our
blood samples. My contributions to this work include the conception and development
of DNA patterning techniques, preparation and execution of the hCG experiments, and
assistance in the adoption of the plasma separation microfluidics. Chapter 2 is largely
derived from © Nature Biotech.2008, 26(12), 1373-1378.
Chapter 3 describes significant improvements to the quality of barcode microarrays. We
found that our initial patterning protocols produced microarrays that yielded consistent
measurements over small areas, but varied widely across the substrate as a whole. In
order to make valid comparisons amongst single cell data or amongst multiple patient
samples analyzed on the same chip, the microarray must present consistent sensitivity
throughout. We describe two different strategies that help us to achieve this
consistency: one method utilizes covalent attachment of DNA to a modified substrate
surface, while a second method preserves the original scheme, but explores the
incorporation of DMSO (a common microarraying additive) with the patterning solution.
Both strategies yielded barcodes with far better consistency than our initial protocol. A
theoretical simulation was undertaken to explain the dramatic improvements achieved
by DMSO, and its mechanism was found to differ significantly in microfluidic systems
when compared to regular pin spotting. My contribution to this work was the
development and characterization of the covalent DNA patterning strategy. Chapter 3 is
Whereas Chapter 3 focused on improving consistency across single chips, Chapter 4
describes efforts to improve chip-to-chip consistency by automating the flow patterning
process. We describe the design and fabrication of a robotics system that is capable of
autonomously interfacing with and manipulating microfluidics systems. A modular
design philosophy enables it to process almost any flow-through microfluidic substrate
with little modification, although we focus on barcode chips. The pattern fidelity of
machine-made substrates is confirmed, and both intra- and inter-chip consistency is
investigated. Finally, a pair of substrates is used to perform massively parallel single-cell
secretion studies of a macrophage cell line, and a statistical analysis of the results
demonstrates that data from the two chips are indistinguishable. This chapter is derived
from a manuscript that is currently under review.
Finally, Chapter 5 describes an additional set of technologies that were developed to
facilitate and automate microfluidics-based experiments in anticipation of clinical trials
based on our blood chip. We first develop an intuitive, GUI-based software package
that is aimed at laboratory-scale microfluidic control and automation. We also describe
the design and fabrication of a self-contained, portable, and modular solenoid array for
microfluidic control, and integrate its operation with the aforementioned program.
Finally, we discuss the development and basic characterization of a second portable
system that optimizes and comprehensively automates microfluidic blood assays such
that even non-technical users who have never worked with microfluidics can regularly
anticipated to be the basis of upcoming clinical blood trials to characterize blood protein
1.7 Figures
1.8
References
1 Strange, K. The end of "naïve reductionism": rise of systems biology or renaissance of physiology? American Journal of Physiology - Cell Physiology 288, C968-C974, (2005).
2 Hood, L., Heath, J. R., Phelps, M. E. & Lin, B. Systems Biology and New Technologies Enable Predictive and Preventative Medicine. Science306,
640-643, (2004).
3 Weinberg, R. The Biology of Cancer. (Garland Sci., 2006).
4 Anderson, N. L. & Anderson, N. G. The human plasma proteome: history, character, and diagnostic prospects. Molecular and Cellular Proteomics1,
845-867, (2002).
5 Zheng, G., Patolsky, F., Cui, Y., Wang, W. U. & Lieber, C. M. Multiplexed electrical detection of cancer markers with nanowire sensor arrays. Nat Biotech 23, 1294-1301, (2005).
6 Kharitonov, A. B., Wasserman, J., Katz, E. & Willner, I. The Use of Impedance Spectroscopy for the Characterization of Protein-Modified ISFET Devices: Application of the Method for the Analysis of Biorecognition Processes. The Journal of Physical Chemistry B105, 4205-4213, (2001).
7 Osterfeld, S. J. et al. Multiplex protein assays based on real-time magnetic nanotag sensing. Proceedings of the National Academy of Sciences105,
20637-20640, (2008).
8 Bailey, R. C., Kwong, G. A., Radu, C. G., Witte, O. N. & Heath, J. R. DNA-Encoded Antibody Libraries: A Unified Platform for Multiplexed Cell Sorting and Detection of Genes and Proteins. Journal of the American Chemical Society 129, 1959-1967, (2007).
9 Kumar, A. & Whitesides, G. M. Features of gold having micrometer to centimeter dimensions can be formed through a combination of stamping with an elastomeric stamp and an alkanethiol ``ink'' followed by chemical etching. Applied Physics Letters63, 2002-2004, (1993).
10 Xia, Y. & Whitesides, G. M. SOFT LITHOGRAPHY. Annual Review of Materials Science28, 153-184, (1998).
11 Lange, S. A., Benes, V., Kern, D. P., Hörber, J. K. H. & Bernard, A. Microcontact Printing of DNA Molecules. Analytical Chemistry76, 1641-1647, (2004).
12 Thibault, C. et al. Direct microcontact printing of oligonucleotides for biochip applications. Journal of Nanobiotechnology3, 7, (2005).
13 Chakra, E. B., Hannes, B., Dilosquer, G., Mansfield, C. D. & Cabrera, M. A new instrument for automated microcontact printing with stamp load adjustment.
Review of Scientific Instruments79, 064102-064109, (2008).
14 Trinkle, C. A. & Lee, L. P. High-precision microcontact printing of
interchangeable stamps using an integrated kinematic coupling. Lab on a Chip11,
455-459, (2011).
16 Nagarah, J. M. et al. Batch Fabrication of High-Performance Planar Patch-Clamp Devices in Quartz. Advanced Materials22, 4622-4627, (2010).
17 Melosh, N. A. et al. Ultrahigh-Density Nanowire Lattices and Circuits. Science 300, 112-115, (2003).
18 Sharp, K. G., Blackman, G. S., Glassmaker, N. J., Jagota, A. & Hui, C.-Y. Effect of Stamp Deformation on the Quality of Microcontact Printing: Theory and Experiment. Langmuir20, 6430-6438, (2004).
19 Hui, C. Y., Jagota, A., Lin, Y. Y. & Kramer, E. J. Constraints on Microcontact Printing Imposed by Stamp Deformation. Langmuir18, 1394-1407, (2002).
20 Schmid, H. & Michel, B. Siloxane Polymers for High-Resolution, High-Accuracy Soft Lithography. Macromolecules33, 3042-3049, (2000).
21 Choi, K. M. & Rogers, J. A. A Photocurable Poly(dimethylsiloxane) Chemistry Designed for Soft Lithographic Molding and Printing in the Nanometer Regime.
Journal of the American Chemical Society125, 4060-4061, (2003).
22 Odom, T. W., Love, J. C., Wolfe, D. B., Paul, K. E. & Whitesides, G. M. Improved Pattern Transfer in Soft Lithography Using Composite Stamps.
Langmuir18, 5314-5320, (2002).
23 Böhm, I., Lampert, A., Buck, M., Eisert, F. & Grunze, M. A spectroscopic study of thiol layers prepared by contact printing. Applied Surface Science141,
237-243, (1999).
24 Glasmästar, K., Gold, J., Andersson, A.-S., Sutherland, D. S. & Kasemo, B. Silicone Transfer during Microcontact Printing. Langmuir19, 5475-5483, (2003).
25 Sharpe, R. B. A. et al. Ink Dependence of Poly(dimethylsiloxane) Contamination in Microcontact Printing. Langmuir22, 5945-5951, (2006).
26 Lee, J. N., Park, C. & Whitesides, G. M. Solvent Compatibility of
Poly(dimethylsiloxane)-Based Microfluidic Devices. Analytical Chemistry75,
6544-6554, (2003).
27 Cheung, V. G. et al. Making and reading microarrays. Nat Genet.
28 Anderson, J. R. et al. Fabrication of Topologically Complex Three-Dimensional Microfluidic Systems in PDMS by Rapid Prototyping. Analytical Chemistry72,
3158-3164, (2000).
29 David, J. & et al. Soft and rigid two-level microfluidic networks for patterning surfaces. Journal of Micromechanics and Microengineering11, 532, (2001).
30 Luo, Y. & Zare, R. N. Perforated membrane method for fabricating three-dimensional polydimethylsiloxane microfluidic devices. Lab on a Chip8,
Chapter 2
Integrated barcode chips for rapid, multiplexed analysis
of proteins in microliter quantities of blood
2.1 Introduction
inexpensive, noninvasive and informative clinical diagnoses, particularly in point-of-care settings.
2.2 Results and Discussion
2.2.1 Device design
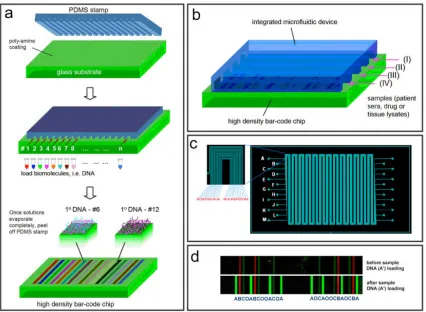
We first present an overview of the IBBC and then discuss control of assay sensitivity, extension of a single protein assay to an assay for a large panel of biomarkers and, finally, integration of plasma separation from whole blood, followed by the rapid measurement of a panel of protein biomarkers. Figure 2.5.1 shows the design of an IBBC for blood separation and in situ protein measurement. We designed a polydimethylsiloxane (PDMS)-on-glass chip to perform 8–12 separate multiprotein assays sequentially or in parallel, starting from whole blood.
array of single-stranded DNA (ssDNA) oligomers before assembly of the microfluidics chip. A full barcode is repeated multiple times within a single plasma-skimming channel, and each barcode sequence constitutes a complete assay.
2.2.2 Assay sensitivity as a function of DNA patterning concentration
obtained from an independent lab test. Even without quantification, the analyte concentrations can be estimated by eye through pattern recognition of the full barcode. The bar with the highest DNA-loading rendered the highest sensitivity, whereas the bar with lowest DNA-loading was used to discriminate samples with high analyte concentrations. For example, the 25,000 mIU/ml and 250 mIU/ml hCG samples can be visually distinguished using stripes patterned with lower DNA concentrations, whereas the stripes loaded from 200 mm DNA solutions do not readily distinguish these samples. For circumstances in which accurate photon counting is not available, visual barcode inspection permits a rough estimation of the target quantity—a potential point-of-care application. When levels of hCG are tracked during pregnancy, concentrations in the blood increase from ~5 mIU/ml in the first week of pregnancy to ~2 x 10⁵ mIU/ml 10 weeks after conception. The IBBC can cover such a broad physiological hCG range with reasonable accuracy.
<2% compared to the correctly paired antigen-antibody complexes (Figure 2.5.7). We also assayed serial dilutions (from 5 nM to 1 pM) for these proteins on the DEAL barcode chip to establish a set of calibration curves for future estimates of protein concentration in sera (Figure 2.5.8). We fixed all the parameters associated with laser scanning and fluorescence quantification (e.g., power, gain, brightness and contrast) and performed quantitative analysis. Depending on the antibodies used, the estimated sensitivity varies from <1 pM for IL-1β and IL-12 to ~30 pM for TGF-β and is comparable to the detection limits of ELISAs based on the same antibody pairs. For example, according to the specifications of commercial kits (eBioscience), the detection limit for cytokines like TNF-a and IL-1b is B8 pg/ml (~0.5 pM), which compares favorably with our observations. However, the statistical variation of the measured signals is relatively large compared to a commercial ELISA assay—a variation that likely arises from our manual chip manufacturing.
2.2.3 Multi-parameter analysis of frozen serum samples
formation, tumor progression and tumor metastasis21-23. Thus, this panel provides information relevant to multiple aspects of cancer.
Figure 2.5.9b shows fluorescence images, each depicting four sets of randomly picked barcodes obtained from the 22 patient samples. The medical records for all patients are summarized in Table 2.6.3. B01–B11 denote 11 samples from breast cancer patients, whereas P01–P11 are from prostate cancer patients. Many proteins were successfully detected with high signal-to-noise ratios, and the barcode signatures are distinctive from patient to patient, excepting the assays on P05, P04, P10 and B10. These assays are from individuals who are heavy smokers (~11–20 cigarettes daily). Only one serum sample (P06) from a heavy smoker did not exhibit a high background. This high background may result from elevated blood content of the fluorescent protein carboxyhemoglobin, which has been shown relevant to the pathogenesis of lung diseases of smokers24. Although we have also measured high background in a number of stored serum samples, we have never measured a high background in assays from very freshly collected blood, as described below. The results imply that, at least for stored samples, some prepurification of the plasma or serum will be required to assay serum protein levels.
B10 that had high nonspecific background. We independently validated our PSA measurements using the standard ELISA for PSA in all patient sera. For eight of the prostate cancer patients, we compared these results with clinical ELISA measurements provided by the serum supplier. The results (Fig. 2.5.9c) validated the applicability of the DEAL barcodes for assaying complex clinical samples. However, the statistical accuracy of the PSA barcode assay was not high, revealing only a modest linear correlation between the ELISA and DEAL. Again, this is likely due to our manual chip manufacturing process. We are currently automating our barcode fabrication, assay execution and image quantification in an effort to bring statistical uncertainties to within 10–20%, which would be close to the state of the art.
of absolute protein levels indicate that the protein concentration ranges assessed by the DEAL barcode assay are clinically relevant for patient diagnostics. For example, the serum level of cytokines such as interleukins and tumor necrosis factors can reach ~10– 100 pg/ml in cancer patients25, ~500 pg/ml in rheumatoid arthritis patients and 41ng/ml26 in septic shock27. These levels can all be captured using the barcode assay format.
2.2.4 Multi-parameter fresh blood analysis
The ultimate goal behind developing the IBBC was to measure the levels of a large number of proteins in human blood within a few minutes of sampling that blood, to avoid the protein degradation that can occur when plasma is stored. In a typical 96-well plate immunoassay, the biological sample of interest is added, and the protein diffuses to the surface-bound antibody. Under adequate flow conditions, diffusion is no longer important, and the only parameter that limits the speed of the assay is the protein/antibody binding kinetics (the Langmuir isotherm)31, thus allowing the immunoassay to be completed in just a few minutes32. Flow through our plasma-skimming channels proceeds at velocities >~0.1 mm sec–1 and can operate continuously and with near 100% efficiency unless the blood flow is clogged.
The plasma proteins detected in this whole-blood analysis experiment included a cancer marker (PSA), four cytokines and three other functional proteins (complement C3, C-reactive protein (CRP) and plasminogen) involved in the complement system, inflammatory response, fibrin degradation and liver toxicity (Tables 2.6.1 and 2.6.2). After exposure of the barcode assay region to the separated, flowing plasma for 8 min, the detection antibody solution and the fluorescence probes were added to complete the assay. All proteins in the spiked blood were detected (Fig. 2.5.10b,c). Cytokines gave the strongest fluorescence signals because of higher affinities of their cognate antibodies. The measurement of the unspiked fresh blood established a baseline for a healthy volunteer, in which IL-6, IL-10, C3 and plasminogen were detected. Using IBBCs for the separation and analysis of very freshly collected blood consistently resulted in very clean DEAL barcodes, with little or no evidence of biofouling. We are planning a study to assess the importance of rapid measurements for obtaining accurate protein levels.
2.3 Conclusions
occur in sampled blood. Use of the IBBC represents a minimally invasive, low-cost and robust procedure, and potentially represents a realistic clinical diagnostic platform.
2.4 Experimental Methods
2.4.1 Micropatterning of barcode array.
2.4.2 Fabrication of IBBCs.
The fabrication of PDMS devices for the IBBCs was accomplished through a two-layer soft lithography approach. The control layer was molded from a SU8 2010 negative photoresist (~20 mm in thickness) silicon master using a mixture of GE RTV 615 PDMS prepolymer part A and part B (5:1). The flow layer was fabricated by spin-casting the pre-polymer of GE RTV 615 PDMS part A and part B (20:1) onto a SPR 220 positive photoresist master at 2,000 r.p.m. for 1 min. The SPR 220 mold was ~17 mm in height after rounding by thermal treatment. The control layer PDMS chip was then carefully aligned and placed onto the flow layer, which was still situated on its silicon master, and an additional 60 min thermal treatment at 80 °C was performed to enable bonding. Afterward, this two-layer PDMS chip was cut off the flow layer master and access holes were punched. Finally, the two-layer PDMS chip was thermally bonded onto the barcode-patterned glass slide, yielding a completed integrated blood barcode chip (IBBC). In this chip, the DEAL barcode stripes are oriented perpendicular to the microfluidic assay channels. Typically, 8–12 identical units were integrated in a single chip with the dimensions of 2.5 cm x 7cm.
2.4.3 Clinical specimens of cancer patient sera.
were European-American and the remaining three were Asian, Hispanic and African-American. The medical history is summarized in Supplementary Table 3.
2.4.4 Collecting a finger prick of blood.
The human whole blood was collected according to the protocol approved by the institutional review board of the California Institute of Technology. Finger pricks were performed using BD microtainer contact-activated lancets. Blood was collected with SAFE-T-FILL capillary blood collection tubes (RAM Scientific), which we prefilled with 80 µl of 25 mM EDTA solution. A 10 µl volume of fresh human blood from a healthy volunteer was collected in an EDTA-coated capillary, dispensed into the tube, and rapidly mixed by inverting a few times. The spiked blood sample was prepared in a similar way except that 40 µl of 25mM EDTA solution and
40 µl of recombinant solution were mixed and pre-added in the collection tube. Then 2 µl of 0.5 M EDTA was added to bring the total EDTA concentration up to 25 mM.
2.4.5 Quantification and statistics.
2.5 Figures
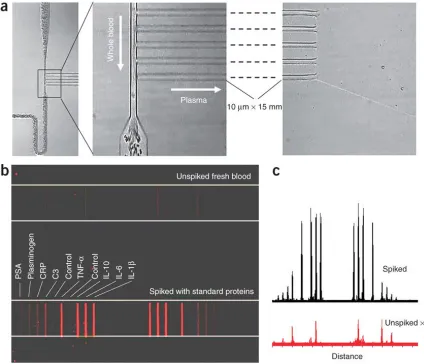
Figure 2.5.1 (a) Scheme depicting plasma separation from a finger prick of blood by harnessing the Zweifach-Fung effect. Multiple DNA-encoded antibody barcode arrays are patterned within the plasma-skimming channels for in situ protein measurements.
Figure 2.5.3 Microchannel-guided flow patterning of DEAL barcode arrays. (a)
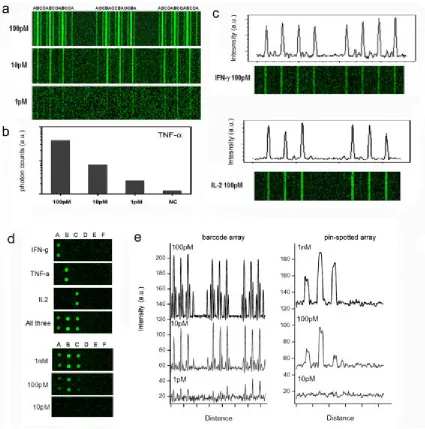
[image:62.612.113.539.168.480.2]Figure 2.5.5 Increased sensitivity observed in immunoassays run on DEAL barcode arrays. (a) Concentration-dependent fluorescence signal for the detection of three human cytokines (A: IFN-γ, B: TNF-α, C: IL-2, O: negative control) using a DEAL barcode array. The bar width is 20 µm. (b) Quantitation of fluorescence intensity vs. TNF-α concentration. (c) Measurements of individual proteins, IFN-γ and IL-2, reveal no distinguishable cross-reactivity. (d) Comparison of the microfluidics flow-patterned DEAL microarrays with DEAL microarrays patterned using a conventional DNA pin-spotting method. The spot size is ~150-200 µm. (e) Fluorescence line profiles for the
[image:64.612.114.539.75.504.2]Figure 2.5.6 (a) Fluorescence images of DEAL barcodes showing the measurement of a series of standard serum samples spiked with hCG. The bars used to measure hCG were patterned with DNA strand A at different concentrations. TNF-α encoded by strand B was employed as a negative control. The green bars (strand M) serve as references. (b)
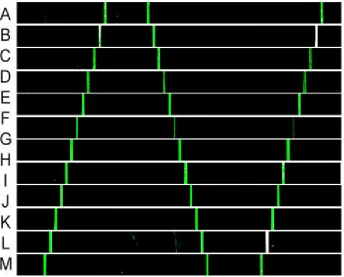
Figure 2.5.9 (a) Layout of the barcode array used in this study. Green denotes the reference (strand M). (b) Representative fluorescence images of barcodes used to measure the cancer marker PSA and 11 cytokines from 22 cancer patient serum samples. B01–B11, samples from breast cancer patients; P01–P11, samples from prostate cancer patients. The left and right columns represent measurements on different chips. (c) Validation of PSA DEAL barcode measurement using ELISA. x denotes PSA measurements were not provided by the serum supplier. Error bars, 1 s.d. (d)
[image:68.612.108.469.73.532.2]Figure 2.5.10 (a) Optical micrographs showing the effective separation of plasma from fresh whole blood. A few red blood cells occasionally seen downstream of the plasma channels did not affect the protein assay. (b) Fluorescence image of blood barcodes in two adjacent microchannels of an IBBC, on which both the unspiked and spiked fresh whole blood collected from a healthy volunteer were separately assayed. Eight plasma proteins are indicated. All bars, 20 µm wide. (c) Fluorescence line profiles of the barcodes for both unspiked and spiked whole blood samples. The distance corresponds to the full length shown in b.
2.6 Tables
DNA Code
Human Plasma Protein
Abbreviation
Panel 1
A/A' Interferon-gamma IFN-γ B/B' Tumor necrosis factor-alpha TNF-α
C/C' Interleukin-2 IL-2
D/D' Interleukin-1 alpha IL-1α E/E' Interleukin-1 beta IL-1β F/F' Transforming growth factor beta TGF-β G/G' Prostate specific antigen (total) PSA
H/H' Interleukin-6 IL-6
I/I' Interleukin-10 IL-10
J/J' Interleukin-12 IL-12
K/K' Granulocyte-macrophage colony stimulating factor GMCSF L/L' Monocyte chemoattractant protein -1 MCP-1 M/M' Blank control/reference
Panel 2
AA/AA' Interleukin-1 beta IL-1β
BB/BB' Interleukin-6 IL-6
CC/CC' Interleukin-10 IL-10 DD/DD' Tumor necrosis factor-alpha TNF-α
EE/EE' Complement Component 3 C3 FF/FF' C-reactive protein CRP GG/GG' Plasminogen Plasminogen HH/HH' Prostate specific antigen (total) PSA
Name Sequence
Tm °C
(50mM NaCl)
A 5'- AAA AAA AAA AAA AAT CCT GGA GCT AAG TCC GTA-3' 57.9 A' 5' NH3- AAA AAA AAA ATA CGG ACT TAG CTC CAG GAT-3' 57.2 B 5'-AAA AAA AAA AAA AGC CTC ATT GAA TCA TGC CTA -3' 57.4 B' 5' NH3AAA AAA AAA ATA GGC ATG ATT CAA TGA GGC -3' 55.9 C 5'- AAA AAA AAA AAA AGC ACT CGT CTA CTA TCG CTA -3' 57.6 C' 5' NH3-AAA AAA AAA ATA GCG ATA GTA GAC GAG TGC -3' 56.2 D 5'-AAA AAA AAA AAA AAT GGT CGA GAT GTC AGA GTA -3' 56.5 D' 5' NH3-AAA AAA AAA ATA CTC TGA CAT CTC GAC CAT -3' 55.7 E 5'-AAA AAA AAA AAA AAT GTG AAG TGG CAG TAT CTA -3' 55.7 E' 5' NH3-AAA AAA AAA ATA GAT ACT GCC ACT TCA CAT -3' 54.7 F 5'-AAA AAA AAA AAA AAT CAG GTA AGG TTC ACG GTA -3' 56.9 F' 5' NH3-AAA AAA AAA ATA CCG TGA ACC TTA CCT GAT -3' 56.1 G 5'-AAA AAA AAA AGA GTA GCC TTC CCG AGC ATT-3' 59.3 G' 5' NH3-AAA AAA AAA AAA TGC TCG GGA AGG CTA CTC-3' 58.6 H 5'-AAA AAA AAA AAT TGA CCA AAC TGC GGT GCG-3' 59.9 H' 5' NH3-AAA AAA AAA ACG CAC CGC AGT TTG GTC AAT-3' 60.8 I 5'-AAA AAA AAA ATG CCC TAT TGT TGC GTC GGA-3' 60.1 I' 5' NH3-AAA AAA AAA ATC CGA CGC AAC AAT AGG GCA-3' 60.1 J 5'-AAA AAA AAA ATC TTC TAG TTG TCG AGC AGG-3' 56.5 J' 5' NH3-AAA AAA AAA ACC TGC TCG ACA ACT AGA AGA-3' 57.5 K 5'-AAA AAA AAA ATA ATC TAA TTC TGG TCG CGG-3' 55.4 K' 5' NH3-AAA AAA AAA ACC GCG ACC AGA ATT AGA TTA-3' 56.3 L' 5' NH3-AAA AAA AAA AGC CGA AGC AGA CTT AAT CAC-3' 57.2 M 5'-Cy3-AAA AAA AAA AGT CGA GGA TTC TGA ACC TGT-3' 57.6 M' 5' NH3-AAA AAA AAA AAC AGG TTC AGA ATC CTC GAC-3' 56.9 AA' 5' NH3-AAAAAAAAAAGTCACAGACTAGCCACGAAG-3' 58
BB 5'-AAA AAA AAA AGC GTG TGT GGA CTC TCT CTA-3' 58.7 BB' 5' NH3-AAA AAA AAA ATA GAG AGA GTC CAC ACA CGC-3' 57.9 CC 5'-AAA AAA AAA ATC TTC TAG TTG TCG AGC AGG-3' 56.5 CC' 5' NH3-AAA AAA AAA ACC TGC TCG ACA ACT AGA AGA-3' 57.5 DD 5'-AAA AAA AAA AGA TCG TAT GGT CCG CTC TCA-3' 58.8 DD' 5' NH3-AAA AAA AAA ATG AGA GCG GAC CAT ACG ATC-3' 58
Name Sequence
Tm °C
(50mM NaCl)
EE 5'-AAA AAA AAA AGC ACT AAC TGG TCT GGG TCA-3' 59.2 EE' 5' NH3-AAA AAA AAA ATG ACC CAG ACC AGT TAG TGC-3' 58.4 FF 5'-AAA AAA AAA ATG CCC TAT TGT TGC GTC GGA-3' 60.1 FF' 5' NH3-AAA AAA AAA ATC CGA CGC AAC AAT AGG GCA-3' 60.1 GG 5'-AAA AAA AAA ACT CTG TGA ACT GTC ATC GGT-3' 57.8 GG' 5' NH3-AAA AAA AAA AAC CGA TGA CAG TTC ACA GAG-3' 57
HH 5'-AAA AAA AAA AGA GTA GCC TTC CCG AGC ATT-3' 59.3 HH' 5' NH3-AAA AAA AAA AAA TGC TCG GGA AGG CTA CTC-3' 58.6