THESES. SIS/LIBRARY R.G. MENZIES BUILDING N0.2 Australian National University Canberra ACT 0200 Australia
USE OF THESES
This copy is supplied for purposes of private study and research only. Passages from the thesis may not be copied or closely paraphrased without the
written consent of the author.
Telephone: "61 2 6125 4631 Facsimile: "61 2 6125 4063
THE DETERRING FORCES
Lualhati Dungca Bost
A thesis submitted for the degree of Doctor of Philosophy
at the Australian National University
MAP OF THE PHILIPPINES
---,
·~. \ REGION 9
\
'"
'\ \ c...•\
0
/?
-M/f'!OANAO SEA
C ELEBES SEA
DECLARATION
Except where indicated, this thesis represents original research I carried out as a scholar at the Department of Demography, Research School of Social Sciences, the Australian National University.
~a,!Ju~~<V~
ACKNOWLEDGEMENTS
I am grateful to all the people who have given me their invaluable time and support in carrying out this study. First of all, I would like to thank my supervisors Dr Terry Hull and Prof Gavin Jones, and Dr Philip Guest who was a supervisor in the first year of my studies, for their insightful advice and comments on my chapters and for generously sharing their materials.
I am also grateful to the various staff of the Demography Department for their academic or administrative assistance at various times in my studies: Prof Ian Diamond, Ms Milissa Habershusz, Mr Gavin Longmuir, Ms Kae Mardus, Prof Geoffrey McNicoll, Ms Pat Quiggin, Dr Kim Streatfield, Ms Deirdre Woods, and Ms Wendy Cosford who speedily and patiently edited initial drafts of my chapters. I am, however, solely responsible for whatever errors this thesis might have. I would also like to thank all the students in the Department, especially Tuning Adioetomo, with whom I have shared the woes and anxieties of writing a thesis.
I also thank the Australian National University for the facilities and the financial assistance in the form of postgraduate scholarship and fieldwork funding; the Population Institute of the University of the Philippines for their generosity in letting me use the 1986/87 Philippine Contraceptive Prevalence Survey data tape and the Institute's library, as well as members of the staff - Dr Corazon Raymundo, Dr Zelda Zablan, Dr Josefina Cabigon, Dr Aurora Perez and Dr Eliseo de Guzman -for sharing some of their papers with me; and all the government and non-government officials whom I interviewed for this study.
ABSTRACT
Compared to some of its neighbouring countries, fertility has declined only slow]y in the Philippines in the last two decades, with a total fertility rate of about six children in the early 1970s to about four children in the early 1990s. The relatively slow fertility decline of the 1970s decelerated in the 1980s. This slow decline is largely due to the relatively small rise in age at marriage and the stagnation in the use of modem contraception in the 1980s after a continuous rise in the previous decade. In addition, traditional methods - calendar rhythm and withdrawal - have continued to remain important in overall contraceptive prevalence, and the use of contraceptive methods has been characterised by relatively high failure rates. Three interwoven sets of forces have shaped fertility control attitudes, accessibility and practice in the Philippines: cultural-religious proscriptions, the decline in government support to the family planning
CONTENTS
Acronyms and initials xi
1. INTRODUCTION 1
1.1. OBJECTIVES OF THE STUDY 1
1.2. APPROACHES 1
1.2.1. Conceptual framework 1
1.2.2. Data and methods 3
1.2.3. Organization of the chapters 5
2. THE FILIPINA IN BER CULTURAL, SOCIAL, ECONOMIC AND
POLITICAL SETTING 6
2.1. MAGANDA: THE PHILIPPINES' EVE 6
2.2. MARIA CLARA: THEFILIPINA UNDER THE SPANISH RULE 7 2.3. THE FlLIPINA UNDER THE AMERICAN REGIME 7
2.4. TODAY'S FlLIPINA 9
2.4.1. Economic and political setting 9
2.4.2. Legal rights 11
2.4.3. Women in politics 15
2.4.4. Women at work 18
2.4.5. Women at home 29
2.5. CONCLUSION 35
3. PHILIPPINE POPULATION POLICY AND PROGRAM:
COMPETING INTEREST GROUPS 36
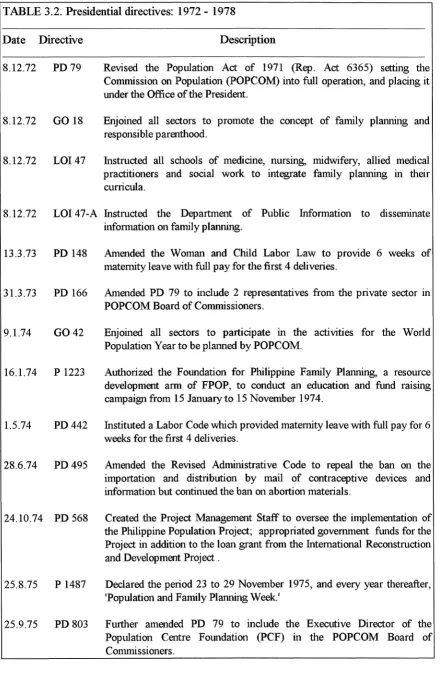
3 .1. THE MAKING OF THE FlRST NATIONAL POLICY AND PROGRAM 36 3.1.1. 'Anti-natalists' and 'Pro-natalists' 36 3.1.2. The rocky road to a policy and program 39 3.1.3. The resulting policy and program 44 3.2. APROGRAMUNDERADICTATORSHIP: 1972-1985 45 3 .2.1. Presidential directives: building up the program 45 3 .2.2. The Philippine Catholic hierarchy: 'Critical colla,boration' 49 3.2.3. The twilight years: a declining program 50
3.3. APROGRAMUNDERSIEGE: 1986-JUNE 1992 56
3 .3 .1. The Philippine Catholic hierarchy: 'Critical solidarity' 56 3.3.2. The Pro-Life movement and the Pro-Choice groups 58
3.3.3. The struggle for dominance 62
3 .4. BIRTH CON1ROL AS AN ISSUE IN THE 1992 ELECTIONS 75 3 .5. A NEW COMMITMENT: THE FIRST YEAR OF THE RAMOS ADMINISTRATION 78
3.6. SYNTHESIS 84
4. THE MOTIVATION TO CONTROL FERTILITY:
CHILDREN AS GIFTS OF GOD VERSUS THE ECONOMIC REALITIES 88 4.1. WHY So MANY CHILDREN?: THE CULTURAL SUPPORTS 88 4 .1.1. The fulfilment of men's and women's roles 88
4.1.2. Children as 'investments' 89
4.1.3. Children as source ofhappiness 92
4.1.4.'And God said: Halal': divine retribution and birth control 94
4.1.5. A balanced sex ratio 95
4.1.6. When couples disagree 97
4.2. THE PHILIPPINE CATHOLIC CHURCH: THE 'SILENT PAR'INER'? 107
4.2.1. Is family planning a sin? 107
4.3. THE PHILIPPINE POPULATION PROGRAM: 'SUCCESS ORF AILURE?' 111
4 .3 .1. Modifying family size norms 111
4.3.2.'Targeting' men 117
4.4. 'LIFEIS TooHARD':THEECONOMICANDPOLIDCAL TURMOIL
OF TIIE 1980s 119
4.5. CONCLUSION 121
5. ACCESS, ATTITUDES AND EXPERIENCE:
'NATURAL' VS 'ARTIFICIAL' METHODS 123
5.1. PROVIDINGTIIEMEIHODS: EFFORTSAND'NON-EFFORTS' 124 5 .1.1. The government family planning program:
a free choice of methods? 124
5 .1.2. The Philippine Catholic Church hierarchy and NFP advocates:
promoting natural methods or obstructing artificial methods? 136 5.1.3. Other providers: accessible methods? 147
5.2. ATTITUDESANDEXPERIENCE 151
5.3. CONCLUSION 159
6. THE DEMAND FOR BIRTH CONTROL:
'MET' AND 'UNMET' NEEDS 160
6.1. DEFINING'UNMETNEED': THEDEBATE 160
6.1.1. The conventional definition 160
6.1.2. Broader definitions 163
6.2. UNMETNEEDOFNON-USERS 164
6.2.1. Married women 164
6.2.2. Sex and single women 180
6.3. THE NEEDS OF USERS 185
6.3.1. More acceptable and less acceptable methods 185 6.3.2. More effective and less effective methods 189
6.4. DIFFERENTIALS IN UNMEr NEED 193
6.5. INDUCED ABORTION AS A BIR.TH CONTROL MEfHOD 199
6.5 .1. Legal status 199
6.5.2. Reported incidence 200
6.5.3. Safety 202
6.6. SYNTHESIS 205
7. SUMMARY AND CONCLUSIONS 207
7 .1. FERTILITY DECLINE AND CONTRACEPTIVE USE 207
7 .2. UNMET NEEDS FOR FAMILY PLANNING 210
7.3. DEIERRING FORCES 212
7.3.1. Cultural-religious proscription 212 7.3.2. Decline in government support to the family planning program 215
7.3.3. Economic setbacks 217
REFERENCES 222
TABLES
2.1 Female labour force 15 years old and over: 1957, 1967, 1977, 1987, 1989 21 2.2 Distribution across occupations of the working population 15 years old and over
by sex, and the female share of each occupation: 1970, 1990 23 2.3 Females in selected occupations: 1903, 1970 23 2.4 Percentage of never-married women by age: 1903-1990 30 2.5 Singulate mean age at marriage, by sex: 1903-1988 30 3 .1 Major events leading to the establishment of the first population policy and program:
3.2 Presidential directives: 1972 - 1978 46 4.1 Percentage of respondents expecting or receiving financial support from their children:
1973, 1983 91
4.2 Living arrangements of the elderly: 1980-1988 93 4.3 Percentage ofrespondents rating 'religious duty to have children' as very important,
by socioeconomic group, by country: 1973 95
4 .4 Percentage distribution of married women by reason for wanting a child or another
child, by number ofliving children: 1986/87 97
4.5 Decisionmakeronfamilyplanning: 1981-1991 98
4.6 Percentage distribution of married women by reason why husband objects to the use
of a family planning method: 1986/87 99
4.7 Logit regression coefficients for the initiative to practise family planning:
women who were not currently using a method but used a method before, 1986/87 101 4.8 Estimated probabilities for the initiative to practise family planning: women who
were not currently using a method but used a method before, 1986/87 102 4. 9 The sinfulness of family planning by religion: 1971, 1992 107 4.10 Episcopal Commission on Family Life seminars and workshops 109 4.11 IEC activities ofthePopulation Commission: 1985/1986 115 4.12 Percentage distribution of married women by whether they have received
instructions or messages on family planning since 1985: 1986/871 116 4 .13 PO PC OM activities to promote family planning among men: 197 4-87 118 4.14. Percentage of women ofreproductive age wanting to stop childbearing
by number ofliving children: 1968-1993 121
5.1 Percentage distribution of married women aged 15-49 by reason for not using
a family planning method: 1986/87 132
5.2 Unavailability of supplies and services: 1990, 1991 135 5. 3 Parishes by population and number of priests, and parishes with only one priest:
1983 137
5.4 Knowledge of the Catholic Church's official stand on the various methods:
1971-1992 139
5.5 Bills affecting the provision of some non-NFP methods: 1986-1992/1993 143 5.6 Percentage distribution of married women aged 15-49 by source and cost of method,
by year 149
5. 7 Percentage of married women aged 15-49 reporting the availability of a family planning method, by type and location of the family planning facility visited: 1986/87 151 5.8 Percentage distribution of married women aged 15-49 by reason for choosing
current birth control method: 1986/87 153
5 .9 Percentage distribution of married women by reason for not using a particular
birth control method: 1986/87 154
5.10 Percentage distribution of married women aged 15-49 by reason for discontinuing
a first birth control method: 1986/87 155
6.1 Parameters used in measuring unmet need for family planning:
a comparison of models 162
6.2 Proportions infecund among all currently married non-pregnant non-contracepting
women by age, by Southeast Asian country 166
6.3 Summary measures on number of acts of coitus in the last seven days of
non-pregnant women, by use of a birth control method, by age: 1986/87 167 6.4 Percentage distribution of reasons for not using family planning: 1986/87 168 6.5 Percentages not desiring pregnancy by number of living children,
by contraceptive use, by age: 1986/87 17 4
6.6 Distribution of non-pregnant non-contracepting women not desiring pregnancy
by reason for not using contraception: 1986/87 17 5 6.7 Percentage distribution of non-pregnant non-contracepting women not desiring
pregnancy and who ever used contraception by reason for not currently using
6. 8 Distribution of married women by need for contraception, by age,
by number of living children: 1986/87 178
6.9 Attitudes towards virginity and premarital sex: 1978-1991 181 6.10 Reportedincidenceofpremarital sex: 1977-1983 182 6 .11 Percentage distribution of married women by method currently used, by age,
by number ofliving children: 1986/87 186
6.12 Percentage distribution of women by method ever-used and currently used, by age:
1986/87 188
6.13 Contraceptive failure rates: Selected countries, 1976-1989 191 6 .14 Per capita GDP, poverty incidence and urban-rural distribution, by Region, by year 194 6.15 Distribution of married women aged 15-44 by socio-demographic characteristic,
by desire to stop or space pregnancies: women fully or partly exposed to the risk
of pregnancy, 1986/87 195
6.16 Estimated probabilities of using each method by married women aged 15-44 who did not wish to have another child: women fully or partly exposed to
the risk of pregnancy, 1986/87 196
6 .17 Estimated probabilities of using each method by married women aged 15-44 who wished to become pregnant after 2+ years: women fully or partly exposed
to the risk of pregnancy, 1986/87 197
6 .18 Philippine laws and regulations on induced abortion 199 6.19 Studies on incidence of induced abortion: 1967-1993 201 6.20 Abortion methods used in the Philippines: 1976-1983 203 6.21 Percentage distribution of induced abortion methods and providers: 1976-1983 204
FIGURES
1.1. Factors affecting the use of fertility control 2 2.1 Average annual GDP growth rate(%): Selected countries, 1965-1980, 1980-1986,
1980-1990 9
2.2 Women in Politics: 1946-1992 16
2.3 Literacy rate by age and sex: 1903-1990 19
2.4 Cumulative educational attainment of the population 25 years old and over by sex:
1948-1980 20
2.5 Percentage of age group enrolled in secondary education: Females in selected
countries: 1965, 1991 21
2.6 Registered overseas contract workers by occupation group: 1978-1987 25 2.7 Women in senior positions for selected countries: 1991 27 2.8 Mean number of hours per week spent on household chores by household members:
Laguna, 1985; Bicol, 1987 33
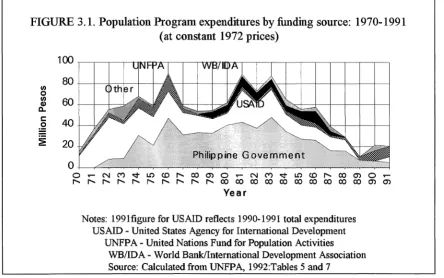
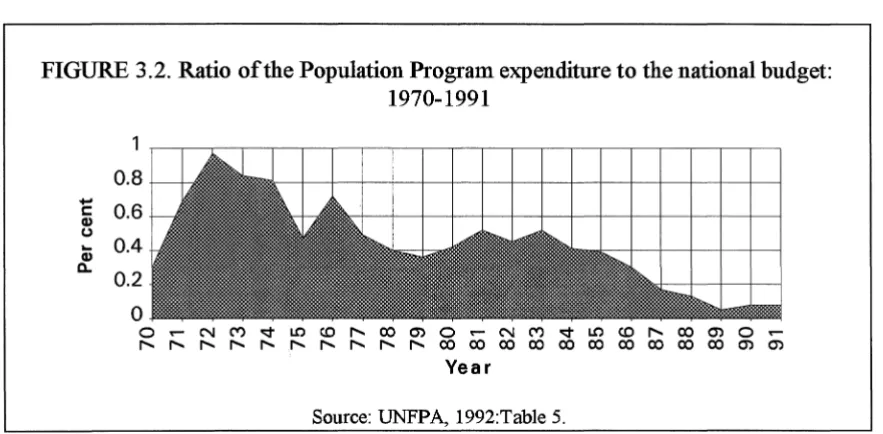
3 .1 Population Program expenditures by funding source: 1970-1991 53 3 .2 Ratio of the Population Program expenditures to the national budget: 1970-1991 54 3.3 Guide in identifying a Pro-Life political candidate: 1992 76 4.1 Husband's involvement in the practice of family planning: 1991 103 4.2 Some billboards and posters advocating family planning: 1982-1984 114 4.3 Philippine Population Program expenditures: 1970-1991 115 5 .1 Percentage distribution of married women aged 15-49 currently using a method,
by whether they obtained the method free, paid for it, or gave a donation to the
government clinic, hospital or worker: 1986/87 130 5.2 Philippine Population Program expenditures by activity: 1970-1991 135 5.3 Number of Catholics per priest, by region or country: 1983 137 5 .4 Percentage of adults who know their local government or Catholic Church officials:
1989 138
5.5 Percentage of married women aged 15-49 who named or had heard of each
family planning method: 1986/87 140
6.2 Percentage distribution of married women aged 15-44 by contraceptive method
currently used, by country: 1986-1989 187
6.3 Life-table probabilities of contraceptive discontinuation: 1986/87 189 6.4 Annual contraceptive discontinuation rates by reason for discontinuation: 1986/87 189 7.1. Total fertility rates: Selected ASEAN countries, 1950-55 - 1985-90 207 7 .2. Total fertility rates: Peninsular Malaysia, 1965-89 208 7.3. Singulate mean age at marriage: Selected ASEAN countries, 1960s - 1980s 208 7.4. Contraceptive prevalence rates(%) of married women ofreproductive age:
Selected ASEAN countries, 1960s-1990s 209
7 .5. Unmet need for family planning: Selected ASE AN countries, 1986/87 211 7.6. First-year probabilities of contraceptive failure: Selected countries, 1986-1989 212 7.7. Annual average growth rates of per capita real GDP at market prices:
Selected ASEAN countries, 1960-1991 218
7 .8. Industry including manufacturing as % of GDP: Selected ASEAN countries,
1970, 1980, 1991 218
7.9. Gross percentage of age group enrolled in primary education:
Females in selected ASEAN countries, 1960-1991 219 7 .10. Gross percentage of age group enrolled in secondary education:
Females in selected ASEAN countries, 1965 and 1991 220
APPENDIX TABLES
3 .1 Bills affecting the Population Program filed in the Eighth Congress: 1987-1991 246 3 .2 The population program controversy: list of selected newspaper articles,
1986- May 1992 249
4.1 Advantages and disadvantages of having children: 1973 252 4.2 Approval of family planning and closeness to the Catholic Church: 1967-1971 253 5 .1 Information, education, and communication materials produced to promote various
family planning methods: 1981, 1982 255
5 .2 Number of family planning workers who were given training on service delivery
bytypeofcourse: 1974/75-1982 255
5.3 Some researches conducted on various family planning methods: 1973-1987 256 5 .4 Distribution of family planning clinics by agency: 1987 257 5.5 NFP seminars provided by the Episcopal Commission on Family Life 258 5.6 Possible side effects, contraindications, myths and advantages of some non-NFP
methods from POPCOMs pre-marriage counselling handbook: 1981 259 6 .1. Logit regression coefficients for the use of a contraceptive method by married women
aged 15-44 who did not wish to have another child: women fully or partly exposed
to the risk of pregnancy, 1986/87 261
6.1. Logit regression coefficients for the use of a contraceptive method by married women aged 15-44 who wished to become pregnant after 2+ years: women fully or partly
exposed to the risk of pregnancy, 1986/87 262
APPENDIX DOCUMENTS
3.1 Republic Act 6365: The 1971 Population Act 263
3 .2 The 1987 Population Policy Statement 267
ASEAN
BBS
BOMP BSPO CBCP CBD CCMP COMELEC CPS CRTS CWL CWRDBS
DMPA DOHDSWD
ECFL FEER FBI FLA FPAP FPOPFf OW GABRIELA GO IDA INC IPC IPPF ISSA LOI LOM NCRFW NCSO NDS NEDA NEE COM NFP NGO NSCB NSCO NSO OEDB p PA PCF PD PDPW PFNFP PFPP
ACRONYMS AND INITIALS
Association of Southeast Asian Nations Barangay [village] Health Stations
Billing's Ovulation Method of the Philippines Barangay Supply Point Office (or Officer) Catholic Bishops' Conference of the Philippines Community-Based Distributor
Commercial Contraceptive Marketing Program Commission on Elections
Contraceptive Prevalence Surveys
Congressional Research and Training Service, Inc. Catholic Women's League
Center for Women's Resources Demographic Health Surveys
depo-medroxyprogesterone acetate, an injectable contraceptive Department of Health
Department of Social Welfare and Development Episcopal Commission on Family Life
Far Eastern Economic Review Family Health International Family Life Apostolate
Family Planning Association of the Philippines
Family Planning Organization of the Philippines (amalgamation ofFPAP and PPMP)
Full-time Outreach Worker
General Assembly Binding Women for Reforms, Integrity, Equality, Liberty and Action
General Order
International Development Association Iglesia Ni Cristo (Church of Christ)
Institute of Philippine Culture
International Planned Parenthood Federation Institute for Social Studies and Action Letter of Instruction
Letter of Implementation
National Commission on the Role of Women National Census and Statistics Office National Demographic Survey
National Economic Development Authority National Ecumenical Consultative Committee Natural Family Planning
Non-government Organization
National Statistical Coordinating Board National Statistical Coordinating Board National Statistics Office (formerly NCSO) Overseas Employment Development Board Proclamation
Periodic Abstinence
Population Center Foundation Presidential Decree
Philippine Development Plan for Women
PIC PL CPD
PNGOC POEA POMCH PONE PO PC OM PPMP RHU RPC RP CPS RPFS
sws
UCCP
UKP UNFPA
UPPI US AID USFDA WB WED PRO WFS WHCF
Philippine Independent Church
Philippine Legislators Committee on Population and Development Foundation, Inc.
Philippine NGO Council on Population, Health and Welfare Philippine Overseas Employment Administration (formerly OEDB) Project on Maternal and Child Health
Province ofNueva Ecija Commission on Population
Planned Parenthood Movement of the Philippines Rural Health Unit
Responsible Parenthood Council
1986/87 Republic of the Philippines Contraceptive Prevalence Survey 1978 Republic of the Philippines Fertility Survey (part of the WFS) Social Weather Station
United Church of Christ of the Philippines
Ugnayan ng Kababaihan sa Pulitika (Alliance of Women in Politics) United Nations Fund for Population Activities
University of the Philippines Population Institute United States Agency for International Development US Food and Drug Administration
World Bank
Women's Education Development Productivity and Research Organization World Fertility Surveys
1.1. OBJECTIVES OF THE STUDY
Chapter 1 INTRODUCTION
Compared to many of its neighbouring ASEAN countries, fertility has declined only slowly in the Philippines. From a total fertility rate of about seven children in the 1950s (UN, 1993), fertility has remained relatively high with about four children in the early 1990s (NDS 1993). In contrast, some neighbouring countries are nearing or have reached replacement fertility levels.
This study focuses on birth control as a determinant of fertility decline in the Philippines. It examines the cultural, socio-economic and political forces that have shaped birth control attitudes and accessibility in the Philippines, and the consequent contraceptive practice and unmet family planning needs of women.
1.2. APPROACHES
1.2.1. Conceptual framework
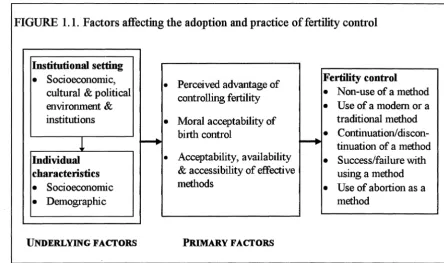
Figure 1 sets out the conceptual :framework guiding this study. The socio-economic, cultural and political environment together with individual characteristics make up the underlying factors affecting the use of fertility regulation, while Coale's (1973) three prerequisites for a major fall in marital fertility constitute the primary or direct factors.
There are various socio-economic factors that are deemed to reduce the advantage of large families and the acceptability of the concept and the means of effective fertility control. Most prominent among these factors are economic growth or development and/or modernization or 'Westernization' factors such as industrialization (or the shift
FIGURE 1.1. Factors affecting the adoption and practice of fertility control
Institutional setting
•
Socioeconomic,Perceived advantage of Fertility control
•
cultural & political
controlling fertility
•
Non-use of a methodenvironment &
•
Use of a modem or ainstitutions
•
Moral acceptability of traditional methodbirth control
•
Continuation/discon-l
--+ --+ tinuation of a methodIndividual
•
Acceptability, availability•
Success/failure with characteristics & accessibility of effective using a method•
Socioeconomic methods•
Use of abortion as a•
Demographic methodUNDERLYING FACTORS PRIMARY FACTORS
High levels of income do not, however, automatically bring about rapid fertility decline as evident in some oil-rich Arab countries; neither is it a prerequisite to a sharp fertility decline as shown in China and Sri Lanka (admittedly Sri Lanka has undergone a great deal of social change particularly mass schooling (Caldwell, 1980), and government pressure may have played a crucial role in China's fertility decline). Similarly, historical studies of European provinces showed that although a high level of social and economic development may have often accompanied a fall of fertility, it was not a precondition to fertility decline (Knodel and van de Walle, 1979; Watkins, 1986). Moreover, there was no clear threshold of development required for a fertility transition to begin.
The more recent experience of countries in Asia do not, however, always show similar speed in fertility decline among populations with similar cultures. For example, while the different Chinese populations have all experienced a steep decline in fertility, the Malay populations in Indonesia, Peninsular Malaysia and Singapore have shown varying speeds of decline. Political institutions - such as the government and its family planning program and religious institutions with political clout in some countries - play an equally crucial role in the Southeast Asian context (Hull, 1987; Jones, 1990b; Knodel, et al, 1987; Leete and Tan, 1993; Robinson and Rachapaetayakom, 1993;) in addition to socio-economic and cultural factors.
1.2.2. Data and methods
This study used both quantitative and qualitative data and methods. For data on socio-demographic characteristics of women, their reproductive desires, their contraceptive attitudes and practice, this study uses primary data from the Republic of the Philippines Contraceptive Prevalence Survey (RPCPS) using analytical techniques such as frequency and cross tabulations and calculation of various statistical measures such as central tendencies, variations, bivariate correlations, and multinomial logistic regressions. Censuses and surveys provided the secondary sources of data on individuals, while ethnographic studies or studies that conducted in-depth interviews with men and women complemented the quantitative data.
What is the quality of the RPCPS data? A Myers' index of3 indicates the robustness of the age data: the Myers' index theoretically ranges from 0, representing no preference for a particular digit, to 90, which means that all ages were reported at a single digit (Shryock and Siegel, 1976). Frequency tabulations of the variables used in this study did not show any codes not accounted for in the codebook. The adequacy, validity and reliability of the variables used in this study, for example, measures or indicators of reproductive desires, exposure to the risk of pregnancy, levels and trends of contraceptive prevalence are, however, discussed in succeeding relevant chapters.
For information on the institutional setting, this study used two types of sources. The first source constitutes interviews conducted with officials of organizations involved or concerned with birth control issues. These institutions are government and non-government organizations and the Catholic Church and NFP (Natural Family Planning) groups. Many of those interviewed were officials at the national level, while others were officials at either the regional or the provincial level. The interviews were held in April and May 1992, during the approach to and right after, the May 11 presidential election. At that time, there was a considerable concern among those advocating a stronger family planning program, as the life and direction of the government population program depended on the outcome of the election.
The basic questions asked of officials involved with the provision of family planning services revolved around the problems they had encountered in carrying out their duties and the possible solutions to these problems. These problems could be over logistics, i.e. funding, staff: equipment, or difficulties with other government institutions or officials, religious groups or other community organizations, or with clients and potential clients themselves. They were also asked what they thought of men's and women's wants and needs in terms of family planning.
in the process. Like the family planning providers, they were also asked about their perceptions of the family planning desires and needs of Filipino men and women.
The second source of materials on the institutional determinants are (in addition to books and academic journals) documents and reports from the different interest groups, and newspaper articles and periodicals that documented the debate on birth control in the Philippines.
1.2.3. Organization of the chapters
From the theoretical perspectives discussed earlier and with the above data and methods, the rest of the chapters are organized as follows. Chapters 2 and 3 prepare the groundwork for the analysis of the primary factors of fertility regulation which are motivation and the moral acceptability of controlling fertility, acceptability and availability of birth control methods. Chapter 2 examines the socio-economic, cultural and political context of Filipino women's lives, and identifies the factors that enhance or undermine their position in society and enable or deter them from meeting their needs, while Chapter 3 discusses the different interest groups and their interactions and conflicts to shape the Philippine population policy and program
Chapter 4 analyses the role of children in Philippine society, the moral acceptability of birth control, the motivations to control fertility, and the actions taken by institutions to strengthen or weaken these motivations. The succeeding chapter looks at the efforts and capability of different institutions to enhance or undermine women's access to family planning information, supplies and services and the subsequent access and attitudes towards contraceptive methods and services.
Chapter 6 reviews the various definitions of 'unmet need' before assessing the met and unmet birth control needs of Filipino women; it also gives the differentials in contraceptive use among different groups of women or the effect of women's socio-economic characteristics on their contraceptive use.
Chapter 2
THE FILIPINA IN HER CULTURAL, SOCIAL, ECONOMIC AND POLITICAL SETTING
2.1. MAGANDA: THE PHILIPPINES' EVE
Unlike Eve who was created from Adam's rib, in Philippine folklore Maganda (meaning beautiful) emerged simultaneously with Malakas (meaning strong) from the same piece of bamboo, symbolizing the equality of Filipino men and women (Vitug, 1985).
Before Spanish colonization (16th-19th century) women enjoyed a high status relative to men. Customary laws gave them the right to own and inherit property and engage in trade and industry. The property was divided equally among the legitimate children, although either parent might show a little partiality in giving a favourite son or daughter an extra jewel or a few pieces of gold (Agoncillo and Guerrero, 1977).
Women could also become priestesses. In fact there were more priestesses than priests according to Alzona (1933). They offered sacrifices; they officiated at marriages; they ministered to the sick They determined village and individual activities in accordance with the seasons (Guerrero, 1992).
Women could also succeed to the political leadership in the absence of a male heir (Agoncillo and Guerrero, 1977). Most prominent among the female rulers was Princess Urduja who, in 873, had an army of free women, slave girls, and female captives who fought just like men. She made incursions into the territories of her enemies, taking part in battle and engaging with warriors of repute (Mendoza-Guazon, 1951).
Although women had high status, they did not really have equal status to men as they could only become chieftains if there was no male heir. Moreover, the Code of Kalantiaw, promulgated in 1433 by the third chief of Panay, Datu Kalantiyaw, made women appear more as property than as men's equals:
VllI. Slavery for a daom [certain period of time] [shall be suffered]: by those who
steal away the women of the headmen; by him who keeps ill-tempered dogs that bite the headmen; by him who bums the field of another.
2.2. MARIA CLARA: THE FILIPINA UNDER THE SPANISH RULE
Maria Clara is the heroine of the 1886 novel Noli Me Tangere, titled in the English translation The Lost Eden, an irreverent satire against the colonizers (particularly the friars) by Jose Riza~ the Philippines' national hero. This novel, together with Rizal's other novel El Filibusterismo (The Filibuster), ultimately cost him his life and catalysed a revolution.
Maria Clara was 'as beautiful as the Virgin' (Rizal, 1961[1886]:406). Typical of the well-to-do young women of her time, Maria Clara was educated in a convent and was a pious, submissive, and obedient daughter. Betrothed to Crisostomo Ibarra, the hero in the nove~ she unknowingly betrayed him to protect the honour of her parents.
Although Maria Clara has been thought by many to be the model Filipina, Rizal did not consider her ideal. In his Letter to the Women of Malolos, Rizal admonished women not to be meek nor submissive, to fight for their rights, to continue striving for education and enlightenment, and to use their judgement and have an open mind (Orosa, 1963).
One woman whom Rizal would have considered ideal was Gabriela Silang after whom the Philippine women's movement umbrella organization was named. Gabriela took over the leadership of the revolt against the colonizers in the Ilocos region after her husband was shot by the Spaniards. She herself was killed in a clash with the enemies in
1763 (National Historical Institute, 1989).
Under Spanish rule the Filipina lost many of the rights accorded to her by customary law (Alzona, 1933; Cortes, 1982). Colonial law deprived her of the right to dispose of her personal property, to engage in business without her husband's consent, or to hold public office except that of a teacher. The husband had the duty to protect the wife and the latter the legal duty to obey him; as a rule she had to follow wherever he established residence.
2.3. THE FILIPINA UNDER THE AMERICAN REGIME
McKinley on 1December1898 to 'protect the natives ... in succeeding to the sovereignty of Spain' (Cited in Agoncillo and Guerrero, 1977:263).
This period saw huge numbers of women recruited into the work force. By 1903, close to a third of the women (29.4 per cent) were engaged in gainful occupations. Compared to the United States and its two other colonies, the proportion of working women in the Philippines was more than double that of the United States, three times that of Puerto Rico, and more than three times that of Cuba (US Bureau of Census,
1905).
More than three-quarters of the working Filipino women were employed in 'manufacturing and mechanical pursuits' (U.S. Bureau of Census, 1905:Table 53). 'Their cheap and docile labor was tapped for the embroidery industry launched during the early part of American colonial rule' ( del Rosario, 1985: 1 ). The women mainly produced cloth,
embroideries, and hats which were exported to the United States (Alzona, 1933:74). It was also during this period that the Filipina started regaining some of the rights she lost under Spanish rule. For example, in 1932 the married Filipina acquired the right to dispose of her personal property without the consent of the husband. In 1933 she acquired the right to vote (Alzona, 1933) and theoretically could occupy any public position.
The Filipina also acquired equal access to education up to the tertiary level. The national university, the University of the Philippines, admitted women to all its departments from its opening in 1908; the oldest university in the country, the University of Santo Tomas (founded in 1611), opened one of its schools (pharmacy) for the first time to women in 1924. By 1931, approximately 3,064 women held academic degrees, with teaching accounting for the largest number. The admission of women into the various professions did not, however, adversely affect the home according to Alzona (1933:59):
2.4. TODAY'S FILIPINA
2.4.1. Economic and political setting Economic problems
Before the outbreak of the Pacific War, the Philippines enjoyed a standard of living second only to Japan's in all Asia, a position it maintained up to the early 1960s (Abaya, 1990). Since then, the Philippines has become poor, with a per capita GNP income of US$730 in 1990, as against Japan's US$25,430 (World Bank, 1992:Table 1). Compared to neighbouring ASEAN countries, the Philippine economy has performed poorly, experiencing negative growth between 1980 and 1986 and an average annual GDP growth rate ofless than 1 per cent in the last decade (Figure 2.1 ).
Figure 2.1. Average annual GDP growth rate(%): Selected countries, 1965-1980, 1980-1986, 1980-1990
Sources: V\brld Bank, 1988, 1992:Table 1.
Ell! Indonesia Iii Malaysia D Philippines mSingapore Iii Thailand
Much higher incidence of poverty has been indicated by opinion polls such as the Bishops-Businessmen Conference (BBC) and the Ateneo Public Opinion Survey in which respondents representing households rated themselves. Seventy-four per cent in 1985 and 60 per cent in 1988 said they were poor; the rest said they were either 'on the borderline' or 'not poor' in equal proportions (Ateneo, 1988). By whichever measure, at least half of the population has been living in poverty.
Many reasons have been given to explain the poor economic performance, and one of these is the massive foreign debt incurred during the Marcos years. By 1990, the external debt equalled 69 per cent of the nation's GNP, while that of neighbouring countries (Thailand, 33 per cent; Malaysia, 48 per cent) created less burden (World Bank, 1992:Table 24). The debt has led to high interest rates, strong inflation, the crowding out of private capital and low spending on infrastructure; debt servicing has eaten up from a third to nearly two-fifths of government expenditure since 1987 (Tiglao,
1992b).
Pineda-Ofreneo (1991) traced the origins of the country's debt and poverty to the 'major flaw of the International Monetary Fund/World Bank programmes for the Philippines.' The banks extended massive loans to the Marcos regime during its 20-year rule. By the end of the Marcos rule, the country had incurred a foreign debt of US$28 billion dollars, a significant chunk of which was allegedly siphoned off by the Marcoses, their cronies and relatives.
Political instability
Philippine observers have frequently cited the country's political instability as the major cause of its economic underperformance since the early 1970s (Tiglao, 1992b). What happened in the 1970s and 1980s?
year of his second term as president, aware that the Constitution allowed only two terms, Marcos proclaimed martial law in September 1972. The dissent against the administration continued underground. The armed struggle was carried out not only by the arm of the Communist Party of the Philippines, the New People's Army, but also by the Muslim separatists, the Moro National Liberation Front.
On 21 August 1983, former Senator Benigno 'Ninoy' Aquino, Marcos's closest rival, was assassinated as he returned to the country to lead opposition to the Marcos regime. This plunged the nation in more than two years of crisis: Mass anti-Marcos rallies became almost weekly affairs (Far Eastern Economic Review, 1990:207); 18 domestic banks closed between August 1983 and August 1984 alone because of capital flight (National Commission on the Role of Filipino Women (NCRFW), 1985); household incomes fell to post-war levels with the country losing nearly a decade of growth (Tiglao, 1992c), while the inflation rate reached 50 per cent in 1984 (NSCB, 199l:Table 2.11 ). This chain of events culminated in the popularly supported military revolt, the 'People Power', in February 1986 with Corazon Aquino, Ninoy's widow, taking over the government.
Political stability was not achieved with the Aquino administration, however. Sporadic encounters with both the left-wing guerrilla rebels and the Muslim secessionists continued, although at an abating frequency. The new threat came from right-wing rebels: the Aquino government repelled seven coup attempts during its six-year term
The coup attempts were not the only factors arresting economic recovery during the Aquino regime. 'Government bungling of key programmes such as land reform and population control' (Cohen, 1990b:38), debilitating power shortages, the Gulf War, a global recession, and two devastating natural disasters (the earthquake in July 1989 and the eruption of Mt. Pinatubo in 1990) compounded the economic problems.
2.4.2. Legal rights 1950-1986
incapacitated persons' (Romero, 1975:515). With the amendments, she could now execute a will and succeed to the ownership of properties inherited from her husband. While as a general rule, the husband is the administrator of the conjugal partnership, the wife may now administer by authority of her husband or by order of the court. The husband may no longer dispose of conjugal property without the wife's consent (Romero, 1975).
Several inequalities remained in the civil code, however. 'The husband is responsible for the support of the wife and the rest of the family' and 'the wife manages the affairs of the household'; the husband has the right to fix the family residence, the preferential right to give or withhold consent to the marriage of a child (Romero, 1975:515); and the right to prevent his wife from practising her profession or business provided:
(1) His income is sufficient for the family, according to its social standing; and
(2) His opposition is founded on serious and valid grounds (National Commission on the Role ofWomen (NCRFW), 1985:20).
The husband has also the right to administer the children's property; only m his absence does this authority devolve on the mother (Cortes, 1975).
The civil code further provides that a person upon reaching age 21 is qualified for all aspects of civil life. However, if the person is female and above 21 but below 23, she cannot leave the parental home without the consent of the father or the mother except to become a wife, to exercise a profession, or if her father or mother remarries (NCRFW, 1985; Cortes, 1975).
The code also requires a widow to wait for 300 days before she can be issued a new marriage licence to avoid confusion in paternity (San Diego, 1975).
Divorce is not allowed except for Moslems although divorce is granted only after all possible means of reconciliation between husband and wife have failed (Diaz, 1986). Legal separation is permitted only on the grounds of (1) adultery on the part of the wife and concubinage on the part of the husband as defined in the penal code; or (2) an attempt by one spouse against the life of the other.
contact 'under scandalous circumstances', or the husband must have 'kept' (the word connotes a certain length of time and not only one contact) the mistress in the conjugal dwelling, or he must have cohabited with her in any other place (San Diego, 1975:31).
President Marcos added two other laws concerning women during his term Presidential Decree No. 46 in 1973 declared that a wife (and not a husband) cannot acquire property by gratuitous title except from her ascendants, descendants, parents-in-law, and collateral relatives within the fourth degree (Cortes, 1975). Presidential Decree No. 603 in 1975 proclaimed that the father and mother exercise joint parental authority and responsibility over their legitimate or adopted children. In case of disagreement however, the father's decision shall prevail unless there is a judicial order to the contrary (Romero, 1975).
Until 1972, the Filipina lost her citizenship if she married an alien (Cortes, 1975). With the 1973 Constitution, she retains 'her Philippine citizenship, unless by her act or omission she is deemed, under the law, to have renounced her citizenship' (Art. III, Sec. 2). Until 1975, the civil code provided that a widow who remarried lost parental authority over the children she conceived with the deceased husband but regained her parental authority over them upon the dissolution of her second marriage (NCRFW,
1985).
1987-1992 The Family Code
On 6 July 1987, President Corazon Aquino signed the Family Code, the first law passed under her administration which affected women (Reyes, 1992). With the new code, a wife can now exercise any legitimate profession, occupation, business or activity without the consent ofher husband (CWR, 1989b).
The Family Code, however, is fraught with defects judging by the number of bills seeking to amend it, according to Reyes (1992). For example, while the Family Code now provides for the joint administration of conjugal property, the husband's decision prevails in case of disagreement subject to recourse to the court by the wife for proper remedy, which must be availed of within five years from the date of the contract implementing such decision. While giving equal responsibility to husband and wife in the raising of children, the Family Code discriminates against women in granting the father final authority in the exercise of parental authority and legal guardianship over the property of the common child.
The Family Code is also inconsistent with the revised penal code. Although the Family Code provides for a single standard of fidelity, the revised penal code continues to distinguish between concubinage for men and adultery for women as grounds for legal separation.
The Eighth Congress
The Eighth Congress (1987-1992) enacted six laws concerning women (Reyes, 1992):
(1) Republic Act 6275 - strengthens the prohibition of discrimination against women with respect to terms and conditions of employment;
(2) Rep. Act. 6949 - declares March 8 of every year as National Women's Day;
(3) Rep. Act 6955 - bans the practice of matching Filipino women for marriage to foreign nationals on a mail order basis and other similar practices including the advertisement, publication, printing or distribution of brochures, fliers and other propaganda materials;
(4) Rep. Act 6972 - establishes a day care centre in every barangay (smallest political unit) within the framework of the total development and protection of children;
(5) Rep. Act 7322 - extends maternity benefits for those in the private sector from 45 to 60 days to parallel their counterparts in government;
(6) Rep. Act 7192 - promotes the equality of women with men in entering into contracts, membership in clubs, and admission to military schools. It also stipulates that a substantial portion of foreign aid shall be used to support programs and activities for women.
bills on women or did not get around to their final reading before the end of their term in 1992.
2.4.3. Women in politics
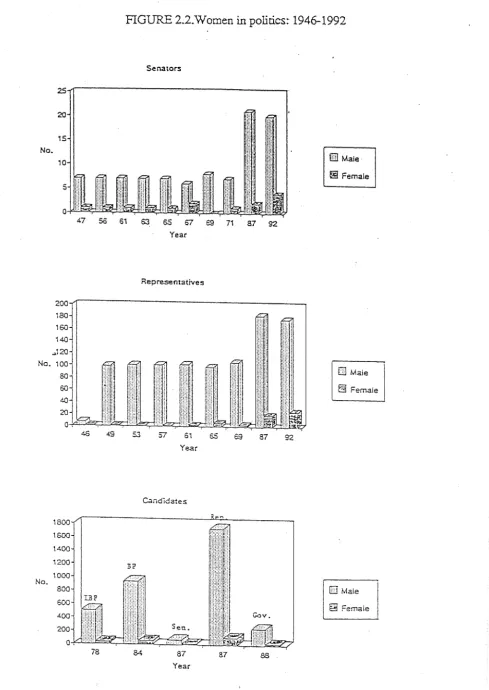
Women participate as much as men as voters: Commission on Election (Comelec) statistics show that a slightly higher number of women than men voted in 18 out of 22 elections between 1947 and 1988 (Tancangco, 1990). However, although the number of female politicians has increased over the years, politics continues to be dominated by men (Figure 2.2). On average, women have occupied less than 5 per cent of elective posts from 1946 to 1987. In the 1987 national elections, women constituted less than 10 per cent of candidates (Azarcon-de la Cruz, 1992); in the 1992 elections, women won only 10 per cent of the positions (Manila Chronicle, 1992d). Why is this so?
'Women belong to the bedroom,' said Marcos as he claimed to be 'embarrassed' to be competing against a woman, Corazon Aquino, in the 1985 presidential election (Richter, 1988:39). The prevalence of the three Gs - guns, goons, and gold - in Philippine elections has made electoral politics an exclusive game for men, according to Tancangco (1990). A married woman exhibiting public power can have the effect of downgrading her husband, according to Hollnsteiner (1981), except in those rare instance where he too is a political figure with a rank higher than hers.
Women themselves say that politics is not for women. In a 1978/1979 study of sex roles in Cebu province, 78 elite women gave the following responses to the open-ended question 'Why do women stay away from political activity?' :
Husbands do not want their wives to engage in politics (56%).
Politics is dirty (54%).
Politics is a man's world (52%).
Women are 'onion-skinned' and therefore unwilling to tolerate the gossip (28%).
Women sacrifice their reputation in politics (28% ).
Women should stay at home (26%).
Alternative activities (business, professions) are more lucrative (25%).
25
No.
200
130
160
140
~120
No. 100
80
60
40
20
Q,
1800 1600 1400
1200
1000
No.
[image:29.613.68.558.37.727.2]800 600 400 200
FIGURE 2.2.Wornen in politics: 1946-1992
Senators
Q ~ ~ ~ ~ ~ 69 TI ~ ~
Year
·>·.
4S 49 5.3
Representatives
61
Year
Candidates
Year
69 87
Note: IBP - Interim National Legislature
Cl Male
~Female
CJ Male
B Female
0 Male
@Female
The 1982 Values of Filipino Women National Study interviewed 500 men and 500 women aged 14-65 from ten communities representing the major ethnolinguistic groups in the Philippines. To the question 'Faced with a choice between a man and a woman, both of whom are equally qualified for a government position, to whom will the woman give her vote and why?' (Note that the same question was asked when the respondent was male to determine men's perceptions on women's attitudes) 78 per cent of the female respondents said they would choose the male candidate because
Men are more fit for political and government positions (55%).
Men are superior to women (38%).
Women are not supposed to engage in politics/others (7%).
(Cortes, 1988:54)
Female politicians and women's interests
Even if women hold political positions, they do not necessarily advance the cause of women. In the Eighth Congress (1987-1992), there were 19 women in the House of Representatives and two in the Senate, and although the bills enacted into law were composed by women, the majority of bills were introduced by men. A number of these bills came from the perspective of patriarchy and were inclined to perpetuate gender biases and prejudices, according to Reyes (1992).
2.4.4. Women at work
Education and employment
In the 1982 Values of Filipino Women National Study mentioned above, 500 women aged 14-65 were asked the following.
What do you consider the most important thing in life?
26% Education
26% A peaceful life, good relations with others, happiness 24% Good health
10% Wealth, economic well-being, satisfaction of basic needs
(Ibe, 1988:22)
What would you scry is the best thing that has happened in your life?
36% When I had a chance to study 33% When I got married
12% Having a family
10% Anything that has to do with the family well-being (Manalang, 1988: 113)
A woman has the right to _ _ _ _ _
34% Education
27% Decent paying job
24 % Equal treatment before the law (Cortes, 1988:50)
FIGURE 2.3. Literacy rate by age and sex: 1903-1990
1903
100
80 - F e m a l e
-O--Male
60
40
oL-~---~~-+-~~-+-~-+~~-+-~~~~~
10-14 15-20 21·24 ~ 35-44 45-54 .55-64 65+
100 T
90
i
80-70
l
60 .!.
501
401
30
l
20
t
10 I
a T 10-14
Age
1948 1970
100 -so I 80 .!.
7o I
.. ;I
5()
1
40
t
30 T
:r
0
15-19 20-24 25-34 35-44 45-54 S5-Q4 SS.. 10-14 15-19 20-24 25-34 35-44 45-54 S5..Q4 SS..
Age Age
1990
lCO T
~!
~
40
-30 I
~I
0
10-14 15-19 20-24 25-34 35-44 45-54 55-<>4 65+
Age
100
80
[image:33.608.35.571.38.731.2]60
FIGURE 2.4. Cumulative educational attainment of the population 25 years old and over by sex: 1948-1980
1948
- F e m a l e
---=>-Male
Year:s of schoolln<;1
1960 1970
60
i
~
AOl
20
l
o~I
_
__,____~----!
1-3 7-9 10 11-13
".'e4r.s ot =tie.cling Yeaf'3 of schooling
1980
Sources: Computed from BCS, 1956:Table 1; BCS, 1965:Table 14, NCSO, 1974:Table 111-8; NCSO, 1983:Table 5
80 70 60 50 40
30 20 10 0
Figure 2.5. Percentage of age group enrolled in secondary education: Females in selected countries, 1965, 1991
1965 1001
mlndonesia II Malaysia O Philippines mSingapore
a Thailand
Note: The data are estimates of the ratio of all females enrolled in secondary education to the country's population of secondary-age females. Although many countries consider secondary school age to be 12 to 17, others do not. Sources: \/\brld Bank, 1002:Table 30; 1994:Table 28.
With their relatively high educational achievement, it is therefore surprising that the proportion ofFilipinas in the labour force has not moved far from the 1957 rate of33 per cent (Table 2.1 ). One contributing factor could be the persistence of the traditional perception of male-female roles in Philippine society: the husband is the breadwinner and head of the household while the wife's primary duty is to look after the husband's and the children's needs. Another explanation could be the underreporting by women who consider themselves mainly as housewives when in fact they contribute labour in family enterprises or run petty businesses on the side. It should, however, be noted that the number of women working overseas has risen over the past few years, but these women are not included in the calculation of labour force participation rates. Overseas employment of women is :further discussed in a later section of this chapter.
TABLE 2.1. Female labour force 15 years old and over: 1957, 1967, 1977, 1987, 1989
Number (000) % of both sexes
1957 (May) 2,190 33
1967 (May) 4,728 36
1977 (October) 4,830 32
1987 (October) 8,243 37
1989 (October) 8,620 37
In a national survey on 1,595 females and 399 males by the Department of Sociology of the University of the Philippines on "Personalities, Stereotypes and Attitudes', the majority of both men and women either 'agreed' or 'strongly agreed' with the statements endorsing stereotype male-female roles (Castillo, 1979:Table 108):
If a man can afford it, he should not allow his wife to work (F:74%, M:82%). Most women are better off in the home than in a job or profession (F:69%, M:78%).
If a man and a woman are equally qualified for a job, the man should be given the position (F:66%, M:75%).
Married women cannot make long-range plans for their job or career because it depends on their husband's plans (F:55%, M:64%)
On the other hand, the majority of the men ( 5 5 per cent), but not the women ( 44 per cent), agreed with the statement: 'People think less of a man if his wife works.' There was, however, no overwhelming condemnation of the mother working outside the home as 41 per cent of the females and 30 per cent of the males agreed with the statement: 'A mother's working outside the home has a good effect on her children,' while close to half of both sexes disagreed.
Even if they contribute equally to the family income or are its principal source, women still consider their employment as secondary. Asked why married women work, an overwhelming majority (93 per cent of the 500 females and 89 per cent of the 500 males) in the 1982 Values of Filipino Women National Study answered: 'to augment the family income' (The, 1988: 19). Two per cent of females and 4 per cent of males said 'to find self-fulfilment.'
'Female' occupations
Maid, housekeeper, cook, laundress, seamstress, nurse, teacher: the jobs women take outside the home are very like the jobs they do inside it. Tables 2.2 and 2.3 give census data on usual gainful occupations broken down by sex.
TABLE 2.2. Distribution across occupations of the working population 15 years old and over by sex, and the female share of each occupation: 1970, 1990
% distribution % female
1970 1970 1990 1990 1970 1990
Occupation group M F M F
All 100 100 100 100 28 28
Professional, technical 4 14 5 15 60 56
Administrative,executive,managerial 1 1 4 7 26 40
Clerical 3 4 2 9 37 61
Service,sales 8 30 4 8 61 44
Agriculture,fishing 63 28 44 10 15 8
Production,transport,labour 21 22 35 42 28 32
Other 1 0 7 9 7 34
Sources: Calculated from NCSO, 1974:Table 11.8; NSO, 1992:Table 16.
TABLE2.3. Females in selected occupations: 1903, 1970
1903 1970 1970
Occupation %F %F % of broad
occupational group
Female-dominated occupations in 1970
Professional, technical, and related 100
Teachers, professors 35 72 61
Nurses and midwivesa 90 80 7
Production, transpor~ labour 100
Tailors, seamstresses, embroiderers 83 87 57
Spinners, weavers, dyersb 99 68 11
Other crafts 96 84 17
Services 100
Servants, housekeepers, cooks 40 85 76
TABLE 2.3. Females in selected occupations: 1903, 1970 (cont.)
Occupation
Top occupations
Directors, managers, working proprietors Government officials
Lawyers and jurists
Physicians, surgeons, dentists
1903 1970 %F
1 0 5
%F
33 10
8
31
Notes: a includes professional medical workers except physicians, surgeons and dentists in 1970 b includes knitters in 1970
Data for 1903 include age group 10 to 14; data for 197 0 only for 15 years old and over. Specific occupation breakdown not available in published succeeding censuses.
Sources: Calculated from USBC, 1905:Table 59; NCSO, 1974:Table 11.8.
Excluded in the census reports are women who worked as overseas contract workers. Some official statistics are available but these are not broken down by sex and are only on registered workers. Two work categories that are dominated by women are the service workers and entertainers. Figure 2. 6 shows that the number of registered service workers has increased eighteenfold and registered entertainers sixfold between 1978 and 1987. The proportion of service workers has also increased three times, while the proportion of registered entertainers declined in the early 1980s but rose to its previous level by 1986.
FJGURE 2.6. Registered overseas contract workers by occupation group: 1978-1987
400000
-:JSOOOO
l
JOOOOO
t
250000
-.j_ 200000
l
.
-
I
Sel'VICe worl<ers150000-· /
~
100000
Y~.
. . .
Entert2iner:s
soooor· ~~
a . . . .
197E 1979 1980 1981 1982 1983. 1984 1985 1586 1987
C"..her worker.;
Service worker.;
Ent e ru;in ers <J
y-~~c-~~o-~--<>-~--:i--~--::.--~~~
1980 1981 1983 1984 1985 1987
Source: NSCO, 1991: Tables 6-21A and B.
To obtain a more accurate number of female contract workers overseas, registered and unregistered, the Philippine Development Plan for Women (1989) asked Philippine embassies and consulates and non-government organizations ill countries where Filipma workers are highly visiole to provide estimates. In 1988, the embassies and consulates gave estimates for the following destination countries:
Middle East
Italy Spain Hong Kong Japan Singapore
Total
70,000 domestics, nurses, entertainers 50,000 mostly domestics
50,000 mostly domestics 38,000 mostly domestics 28,000 mostly entertainers 16,000 mostly domestics
The 252,000 total would mean a ratio of about one Filipina overseas worker for every 30 female workers in the Philippines.
This export of labour was legitimized early in the Marcos administration when it created the Overseas Employment Development Board (OEDB), later called Philippine Overseas Employment Administration (POEA) on 1May1974. The OEDB prided itself in calling this 'development strategy' as an 'imaginative scheme' to export surplus labour. Marcos considered Filipino labour the country's 'best weapon' for economic growth (Ramirez, 1987:2).
The jobs that most women have taken up abroad are the jobs which are most open to exploitation and abuse. Between 1985 and 1987, 1,539 Filipina contract workers, mainly maids and entertainers, filed the following complaints:
Maltreatment including physical/verbal abuse, poor accommodation and inadequate food (43%).
Breach of contract including contract substitution, pay irregularities (21 % ). Excessive workload, unregulated working hours (12%).
Sexual abuse - rape/attempted rape, forced into prostitution (7%). (PDPW, 1989:121)
Low pay
Because most women occupy low-paying 'female' jobs, they earn less than men on the average. And in the last two decades, these earnings have even declined: 67, 58 and 39 centavos for each peso earned by men in 1971, 1978 and 1986, respectively (computed fromBCSSH, 1971a-d:Tables 46 and 44; NCSOISH, 1978a-d,1986a-d:Table 6).
Even for similar work, women receive less than men according to a report by the Institute of Labor Studies of the Department of Labor and Employment (Tampus, 1992a). In a study of 114 manufacturing :finns in Metro Manila, male clerks receive P6,455 monthly and unskilled men P4,899; on the other hand, female clerks with the same number of years of experience got P4,597 and unskilled women P3,701. On the average, for every peso earned by the male worker, the female received only 37 centavos.
established firms. The study concluded that not even college education could ensure women they could get the same pay that their male counterparts receive for similar work.
The emigration of those in 'female' occupations with most prestige, teachers and nurses, attests to dissatisfaction with their lot. Filipina teachers who receive less than P4,000 (US$143) a month work as domestic helpers in Hong Kong or Europe where the pay offered can be up to five times as much (Cruz, 1991). As to nurses, the records of the Ministry of Labor and Employment show that a total of 21,948 nurses left the country as overseas contract workers, mostly to the Middle East, from 1975 to 1981. In 1985, some 30,000 Filipina nurses were working in hospitals in the United States where they can earn up to 20 times more than their salaries at home (Orozco, 1985).
Top occupations
As shown earlier in Tables 2.2. and 2.3, women have made progress in top positions. In a 1991 survey of seven East and Southeast Asian cities, Manila was equal with Bangkok for the second highest proportion of women in senior posts in business, professions, government and education (Figure 2. 7).
F1GURE 2.7. \Vomen in senior positions for selected countries: 1991
P-er-::~!10ge: by M.arX.l!t
C=:J Me-i - Wt:rne:-i
a 10 20 JO 40 50 60 70 go 90 100
l
HONCXONG-L
;:uALA LUMPVSl.A
. ,!· • . ·~ ; .... : ~ • __.· ••l
~CXOKL
However, women still earn less than men in most of these positions. Women occupying administrative, executive and managerial positions received 73 centavos in 1971 for every peso earned by men in the same jobs, 59 in 1978, and 22 in 1986 (computed fromBCSSH, 1971a-d:Tables 46 and 44; NCSOISH, 1978a-d,1986a-d:Table 6). This sharp trend could perhaps be due to the fact that the number of women in managerial positions has increased, and many of these women run very small businesses requiring small capital. A study of 114 manufacturing firms in Metro Manila found that the average monthly earnings of men in managerial or supervisory positions with 20 or more years of experience was P13,372, while for women with the same number of years of experience it was Pll,293 (Tampus, 1992a).
Successful women examined in two studies attributed their success to the men in their lives. Tapales (1988) interviewed women belonging to the Philippine bureaucracy's highest level in 1983 and 1988. She found that most of them came from middle and upper socio-economic classes. One typical statement, Tapales said (p. 20), was: 'Without my husband's approval, and much later, his support, I don't think I would have been able to accomplish this much. ' Another remark which Tapales (p.15) thought reflected what the others felt was: 'If anything threatens my marriage, I'll give up whatever it is, including my career'.
A 1985 study interviewed corporate women managers in Southeast Asia (Hoffarth, 1989). The three women interviewed from the Philippines were Maria Gonzales Goolsby, the vice president and centre head for human resources of a bank, Zenaida Gonzales Gordon, the president of her own manufacturing company and the first woman to reach a :full vice-president position at San Miguel Corporation (one of the largest and most profitable Philippine corporations), and Erica Ramos Benitez (a pseudonym) the executive vice-president of a bank and trust company.
her life and she considered herself fortunate to have a husband who was very supportive of her career. Benitez, whose father was also a strong influence, described her husband as 'kind, undemanding and tolerant'. Gordon considered her father the strongest and most important influence in her life.
It therefore appears that women often cannot reach the top without the support of their husbands or fathers. As Tapales (1988: 1) remarked: 'In reality, the Filipino woman wields power only when the man in her life lets her.'
2.4.5. Women at home
The previous sections have shown that in Philippine society, the primary role of a woman is to look after the needs of her husband and her children; this section therefore concentrates on division of labour and decision-making at home. But first it is necessary to look at marriage in the Philippines.
Marriage
A 26 year-old advertising executive said:
[Getting married is] an expectation, a mold of society. Jf you're single, and you attend a family gathering they automatically ask, 'When are you getting married?' and you ask back, 'Why, what's wrong?' You get defensive. In the workplace, it doesn't matter whether you're single or not. But in the family, they keep saying (mimicking an old man) 'Hey, better get married soon' (Lozare, 1989).
Table 2.4 shows that marriage has been nearly universal with a slight trend from 1980 either to later age at marriage or to a possible increase in the number of women staying single. Separation, on the other hand, has been almost negligible with a maximum of 1.6 per cent reported for a five-year age group between 1903 and 1990.
Age at marriage
the Local Civil Registrar a written consent from a parent or guardian (Sison and Feliciano, 1983). With the new code, the legal age became 18 for both. The mean age at marriage has, however, been higher than the legal age, and has not changed radically since the start of the century (Table 2.5).
TABLE 2.4. Percentage of never-married women by age: 1903-1990
Census 10-14 15-19 20-24 25-34 35-44 45-54 55-64 65+
1903 99 55 55 16 9 8 7 8
1948 100 85 41 16 9 7 6 6
1960 100 87 44 16 8 7 7 6
1970 99 86 45 17 8 7 7 8
1980 100 89 50 17 8 7 8 7
1990 99 90 56 21 8 6 7 9
Sources: Calculated from USBC, 1905:Table 31; BCS, 1956:Table 2; BCS, 1965:Table 7; NCSO, 1974:Table 111-1; NCSO, 1983:Table 4; NSO, 1992:Table 4.
TABLE 2.5. Singulate mean age at marriage, by sex: 1903-1988
Year Census/Survey Female Male
1903 Census 20.9
1939 II
21.9
1948 II
22.1 25.0
1960 II
22.3 25.0
1970 22.8 25.4
1973 NDS 23.7
1975 Census 23.2 25.5
1978 RPFS 24.4
1980 Census 22.4
1983 NDS 23.4
1986/87 RP CPS 23.8
1988 NDS 24.0
Notes: NDS - National Demographic Survey; RPFS - Republic of the Philippines Fertility Survey RPCPS - Contraceptive Prevalence Survey. There appears to be a discrepancy between survey and census estimates of the female singulate mean age at marriage.