City, University of London Institutional Repository
Citation
:
Li, Y. & Sayma, A. I. (2017). Computational Fluid Dynamics Simulation of Surge in a Three Stage Axial Compressor. International Journal of Turbines & Sustainable Energy Systems, 1(1), doi: 10.4273/ijtses.1.1.04This is the published version of the paper.
This version of the publication may differ from the final published
version.
Permanent repository link:
http://openaccess.city.ac.uk/17347/Link to published version
:
http://dx.doi.org/10.4273/ijtses.1.1.04Copyright and reuse:
City Research Online aims to make research
outputs of City, University of London available to a wider audience.
Copyright and Moral Rights remain with the author(s) and/or copyright
holders. URLs from City Research Online may be freely distributed and
linked to.
City Research Online: http://openaccess.city.ac.uk/ [email protected]
& Sustainable Energy Systems
Available online at www.maftree.org/eja doi: 10.4273/ijtses.1.1.04
© 2017. MechAero Foundation for Technical Research & Education Excellence
Computational Fluid Dynamics Simulation of Surge in a Three Stage Axial
Compressor
Yan-Ling Lia and Abdulnaser Saymab
a
Dept. of Aeronautical and Automotive Engg., Loughborough University, Leicestershire, United Kingdom b
Dept. of Mech. Engg. and Aeronautics, City University, London, United Kingdom Corresponding Author, Email:[email protected]
ABSTRACT:
A three dimensional unsteady Reynolds-Averaged Navier-Stokes solver was used to perform multistage unsteady simulations of a three and half stage compressor. Previously published research presented the simulation of the same compressor with mal-scheduling of the variable stator vanes (VSV) and predicted a rotating stall pattern in all stages. The nominal VSV schedule compressor was simulated to provide a reference case for comparison purposes. The compressor’s behaviour in the nominal case seemed to behave against conventional wisdom with mass flow and pressure fluctuations representing compressor surge. However further analysis showed that inherent design feature in the compressor which had a highly loaded third stator was the primary cause of surge initiation, a situation which was eased with mal-scheduling by unloading that stator. Full analysis of the simulation results of the nominal case and discussion are presented in this paper.
KEYWORDS:
Multi-stage compressor simulations; Rotating stall; Surge; Stator vane mal-schedule; Variable stator vanes
CITATION:
Y.L. Li and A. Sayma. 2017. Computational Fluid Dynamics Simulation of Surge in a Three Stage Axial Compressor,
Int. J. Turbines & Sustainable Energy Systems, 1(1), 21-25. doi:10.4273/ijtses.1.1.04.
NOMENCLATURE & ABBREVIATIONS CDA Controlled Diffusion Airfoils IDAC Controlled Diffusion Airfoils IGVs Inlet Guide Vanes
R1 Rotor of the 1st Stage R2 Rotor of the 2nd Stage R3 Rotor of the 3rd Stage
RANS Reynolds-Averaged Navier-Stokes S1 Stator of the 1st Stage
S2 Stator of the 2nd Stage S3 Stator of the 3rd Stage VSVs Variable Stator Vanes
1.
Introduction
During compressor start-up, the flow may pass through regions on the characteristic map of potential stall or beyond the surge margin, which are manifested by loud noise and high amplitude vibrations. A typical design feature to control the flow either during start up or at off design conditions is to use variable stator vanes (VSVs) to improve stage matching. This is also complemented by additional bleeds during start up. The mismatch at start up primarily results from the low density in the rear stages. To overcome this problem, VSVs settings are scheduled together with bleeds to reduce the airflow and thereby reduce the flow axial velocity to improve incidence [1]. Approaching the design point, VSVs are gradually opened and bleeding is reduced to allow more flow into the compressor to achieve the desired operating condition. Normally, the VSV schedule is a function of
the corrected rotational speed and is typically optimised to ensure that the compressor operates safely throughout the operating range [2]. However, improper settings or mal-schedule of VSVs, due for example to mechanical failure or control system malfunction, could lead to rotating stall or surge. It is desirable to be able to predict flow behaviour in such scenarios at the design stage to implement design features that minimise its impact on safe operation of the compressor.
Surge is a global phenomenon characterised by large mass flow and pressure fluctuations or flow reversal and is typically manifested by high abnormal noise. In gas turbine engine compressors, it may lead to flames reaching the inlet severely damaging the compressor. Surge cycles result from periodic filling up and emptying of the volume downstream of the compressor due to mismatch between the operating speed and downstream pressure. On the other hand, rotating stall, which in many cases is a precursor of surge, is a localised phenomenon to particular stages in which a compressor could operate without failure and may recover. It is normally accompanied with circumferential non-uniformity with one or more stall cells propagating around the annulus at a fraction of the shaft speed.
Li et al. 2017. Int. J. Turbines and Sustainable Energy Systems, 1(1), 21-25
mostly focused on the development of techniques used to identify VSVs system fault rather than predicting the flow behaviour. Goebel et al [8] investigated a number of system faults leading to VSVs mal-schedule including those resulting from sensors and actuator system faults. It was found that if the VSVs failed in a fully open condition, the engine could not maintain its operability. If the VSVs failed in an intermediate condition, the operating condition could be altered to cope with the situation and may maintain operation of the compressor.
A 3D viscous time-accurate flow solver was used to model rotating stall and surge with VSVs mal-schedule for the first three blade rows of an intermediate pressure compressor by Vahdati et al [9]. In the rotating stall case, clearly observed after 13 revolutions, the variation of the static pressure upstream of the first rotor showed that rotating stall was predicted with approximately 10 to 13 cells, a situation which was not observed in the nominal case at the same operating conditions.
Previous work by the authors of this paper [10] investigated rotating stall of the same compressor presented in this paper with VSVs mal-schedule using three dimensional RANS simulations. The inlet guide vane was unchanged while the first stage stator was closed by 15o and the second stage stator was opened by 15o. Part span spike type initiated rotating stall was predicted in the first rotor stage. It was found that the rotating stall also occurred in the second and third stages which was mostly caused by the one presented in first stage which acted as an inlet distortion to the downstream stages, albeit in the same rotating frame of reference. All stall cells rotated around the annulus at approximately 50% of the shaft speed. Only one large stall cell covering several blade passages was predicted in all rotor blade rows. Before these simulations were undertaken, the compressor with nominal VSV setting was simulated at the same flow conditions with the intention of providing a reference case. This however, unexpectedly, showed a surge behaviour, which was further analysed in detail and discussed in this paper.
2.
Multi-stage compressor
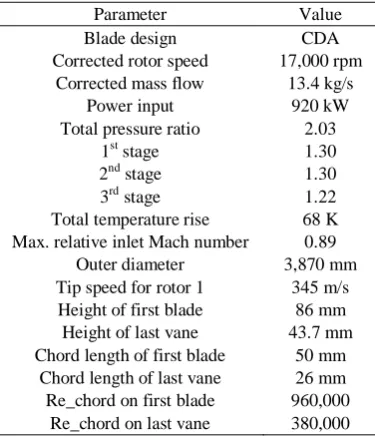
[image:3.595.310.526.53.171.2]The multi-stage compressor used in this study, the Inversely Designed Aachen Compressor (IDAC), is a high-speed three stage axial compressor with Inlet Guide Vanes (IGV) and Controlled Diffusion Airfoils (CDA) design. It was built at the Institute of Jet Propulsion and Turbomachinery of RWTH Aachen University [11]. A meridional view of the compressor is shown in Fig. 1. The outer diameter is 3.87 m. The compressor has a design mass flow of 13.4 kg/s with a total pressure ratio of 2.03, operating at 17,000 rpm. At the design point, the total temperature rise is 68K; the maximum relative inlet Mach number is 0.89 and the circumferential tip speed on the first rotor is 345 m/s. The main design specifications are listed in Table 1. The IGVs and the stator vanes are mounted on the inner shroud rings with no radial tip clearances and the tip clearance for rotor blades is less than 0.3 mm during operation which is approximately 0.35%, 0.49% and 0.64% span for the three rotor blade rows respectively.
Fig. 1: View of the IDAC compressor
Table 1: Specifications of the IDAC Compressor [11]
Parameter Value
Blade design CDA
Corrected rotor speed 17,000 rpm Corrected mass flow 13.4 kg/s
Power input 920 kW
Total pressure ratio 2.03
1st stage 1.30
2nd stage 1.30
3rd stage 1.22
Total temperature rise 68 K Max. relative inlet Mach number 0.89
Outer diameter 3,870 mm Tip speed for rotor 1 345 m/s Height of first blade 86 mm
Height of last vane 43.7 mm Chord length of first blade 50 mm
Chord length of last vane 26 mm Re_chord on first blade 960,000 Re_chord on last vane 380,000
The flow in a multi-stage compressor is normally complex due to the three dimensional nature and the presence of stationary and rotating blades with numerous complex flow features such as rotor-stator interaction, tip clearance flow, viscous flow effects, upstream and downstream influence and secondary flows [12]. The main reason for the choice of this particular compressor is that it only has three stages, which is adequate for this investigation allowing full annulus 3D time-accurate CFD simulations to be possible with the available computing power. It reduces the complexity of a typical multi-stage compressor thus helping in interpreting the results. The first two stator vanes were considered as VSVs for the purpose of this study. VSVs are normally bolted to the casing and hub with small radial tip and hub clearances between vanes and the wall which were not considered for this study. Furthermore, the availability of the geometry and flow measurements for code validation were important factors.
3.
Numerical methodology and flow model
[image:3.595.311.499.195.414.2]discretisation scheme with a pressure switch that reverts the solution to first order in the vicinity of discontinuities to damp numerical oscillations. For unsteady flow simulations, implicit dual time step is used with outer Newton iteration with time step dictated by the physical constraints and fixed throughout the solution domain. Within the Newton iterations, the solution uses Jacobi relaxation and is advanced to convergence using the traditional convergence acceleration techniques such as residual smoothing and local time stepping [15].
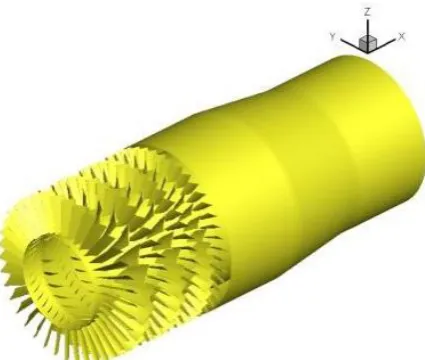
[image:4.595.311.537.192.365.2]Semi-structured grids combining the advantages of structured and unstructured mesh configurations were employed in the present simulations based on the methodology described by Sayma et al [13, 16] and Sbardella et al [17]. Stall is typically initiated by starting from a converged steady state simulation close to the stall boundary. The unsteady simulations are then conducted by gradually closing a downstream nozzle until either rotating stall or surge is observed as described by Vahdati et al [18]. The main part of the computational domain used for the steady state simulations is shown in Fig. 1. The outlet boundary was extended 12 chord lengths of the first rotor downstream from the last stator where it is believed that uniform flow can be assumed with minimum effect on the accuracy of the solution. Mixing planes were used at the interfaces between blade rows for the steady simulations, which are used to produce the characteristic map and the last converged case would be used as a starting point for the unsteady simulations. Total temperature and pressure with zero flow angles were applied at the inlet boundary and uniform static pressure was applied to the outlet boundary as the last stator removes most of the swirl. For the unsteady simulations, the computational domain used is shown in Fig. 2. The unsteady simulations were performed at 68% speed because it is more likely that the compressor would encounter rotating stall or surge at off-design conditions. Additionally, performance experimental data were available at this speed for model validation. Such validations and details of the grids and steady flow analyses have been presented by Li and Sayma [10]. Sliding planes were used at the interfaces between blade rows for the unsteady simulations.
Fig. 2: Computational domain of the IDAC compressor for unsteady time-accurate simulation
[image:4.595.59.272.559.739.2]The computational domain contains approximately 25 million mesh points for the unsteady simulation and 910,000 mesh points for one single passage for the steady state simulation. A view of mesh for rotor 1 is shown in Fig. 3. Similar meshes were used for the remaining blade rows. 1,900 time steps were used per engine revolution which required 85 wall clock hours using 32, 2.5 GHz Intel Xeon cores. The starting solution for the unsteady simulations was the near stall point predicted from the single passage steady state solution, with further closure of the downstream nozzle.
Fig. 3: Partial mesh views for the first rotor
4.
Results and discussions
The results from steady state simulation, including numerical grid sensitivity, were previously discussed and compared with experimental data by Li and Sayma [10], and thus will not be repeated in this paper. Also in the same paper, a rotating stall case with a VSV mal-schedule was presented as mentioned earlier. This discussion here focuses on the nominal case. As discussed by Li and Sayma [14], introducing small asymmetry of the same order of manufacturing tolerances into the computational geometry could lead to a much quicker onset of rotating stall or surge in the numerical simulations allowing for significant computer time savings. Therefore, all blades were randomly staggered between 0.2o to create the required asymmetry. The unsteady simulation was started from a converged steady state solution near stall but with a further closed nozzle downstream. It is also worth noting that steady state simulations use single passage with periodic boundaries from each stage while unsteady simulations comprise the entire annulus.
Li et al. 2017. Int. J. Turbines and Sustainable Energy Systems, 1(1), 21-25
revolutions. The mass flow varied from 2 to 8 kg/s. This shows that one surge cycle requires approximately 2 revolutions indicating a surge cycle frequency of approximately half the time for one shaft rotation. This low frequency is a numerical artefact of the small volume downstream the compressor dictated by the size of the domain dictated mainly by computational economy and this is of no physical relevance.
2 4 6 8 10
1 1.2 1.4 1.6 1.8
Mass Flow (kg/s)
P
re
s
s
u
re
R
a
ti
[image:5.595.59.263.159.317.2]o
Fig. 4: Overall compressor performance during surge with steady state solution added
0 2 4 6 8 10 12 14
2 3 4 5 6 7 8
Rotor revolutions
M
a
s
s
f
lo
w
(
k
g
/s
[image:5.595.310.539.226.375.2])
Fig. 5: Mass flow time history for the nominal case
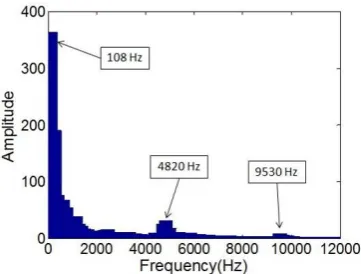
To capture the unsteady flow characteristics, six sets of numerical sensors were located in the stationary frames between all blade rows. In the axial direction, each set has equal distance from adjacent blade rows. For each set of the numerical sensors, which were located at the same axial coordinates, they were placed 45o apart along 8 circumferential positions. At the same circumferential position, there was one on the casing, one on the hub and four equally spaced between them. As shown in the unsteady static pressure signal in Fig. 6, pressure variations are synchronous around the circumference. This suggests that stall regions observed in the rotor blade row were not rotating along the annulus. All pressure waves have six crests indicating six surge cycles. Three frequencies are apparent from the Fourier transform of the signal from one of the sensors upstream of R1 shown in Fig. 7: 108 HZ, 4820 Hz and 9530 Hz. The first is the frequency for the surge cycle which is approximately half of the shaft rotation frequency (193 Hz). This is accordant with the results shown in the mass flow time history in Fig. 5. The
second is the blade passing frequency (BPF) of R1 passing the IGV and the third is its second harmonic. The unsteady static pressure signal time history from six numerical sensors at different axial locations is shown in Fig. 8. They are located at: downstream of IGV, upstream and downstream of S1, S2 and upstream of S3. As indicated by the dashed line, the pressure variation started firstly from the S3 suggesting that it is mostly responsible for the initiation of the surge cycle at this rotational speed. This conforms to common knowledge that surge is initiated downstream of a compressor as explained earlier. It has also been reported in Bohne and Niehuis [11] and Niehuis et al [12] that S3 defined the surge limit of this compressor.
[image:5.595.58.264.350.514.2]Fig. 6: Unsteady static pressure signal time history from eight numerical sensors on the casing upstream R1 for the nominal case
[image:5.595.309.490.406.543.2]Fig. 7: Fourier transform components from 1 sensor upstream R1
Fig. 8: Unsteady static pressure signal time history from six numerical sensors on the casing in different axial locations for the nominal case (D: Downstream; U: Upstream)
[image:5.595.309.536.562.694.2]after 9.6 revolutions. Flow blockage can be observed near the tip and hub. When mass flow rate reduced to be close to the lowest value after about 10 revolutions, the axial velocity profile varies significantly from tip to hub and the flow was stalled in the lower radial part of the passage. This was a result of the design of this stator as explained earlier. As reported by Bohne and Niehuis [11], a hub-corner-stall was observed in S3 even at design condition because the stator was originally designed to be highly loaded. Bohne and Niehuis stated that it was caused at 68% speed by the interaction between the main flow and the sidewall boundary layer, which was not accounted for in the design process. When the mass flow reached its peak value in the cycle after about 11 revolutions, the stalled region was cleared out with improved axial velocity & incidence.
0 20 40 60 80 100 120 140
0 20 40 60 80 100 120 140
Axial velocity (m/s)
S
p
a
n
(
%
)
[image:6.595.59.263.251.405.2]CFD solution at 9.6 rev CFD solution at 10.1 rev CFD solution at 11.0 rev
Fig. 9: Instantaneous circumferentially averaged axial velocity radial profile upstream of S3
5.
Conclusions
A 3.5 stage high-speed axial flow compressor was previously used to study the effect of VSVs mal-schedule on compressor aerodynamics. By analysing the steady state solutions at near stall conditions, it was found that the first rotor is mostly responsible for the initiation of rotating stall if the compressor is throttled further close to the stall boundary. In this paper, the nominal VSVs schedule case was investigated. Surge cycles were predicted with a frequency of 108 Hz which is approximately half of the shaft rotation frequency. S3 was found to be the main trigger of surge which agrees with what was expected from the steady flow analysis and other studies in the literature.
REFERENCES:
[1] P. Levine. 1998. Axial Compressor Performance and Maintenance Guide, TR-111038, Electric Power Research Institute Inc.
[2] C.E. Campbell. 1958. Performance of Basic XJ79-GE-1 Turbojet Engine and Its Components, NACA RM E58C12, National Adv. Comm. for Aero., Washington. [3] H.P. Kau. 1998. Compressor Matching and Designing
for Tip Clearance, The RTO AVT Lecture Series on Integrated Multidisciplinary Design of High Pressure Multistage Compressor Systems, Lyon.
[4] D.E. Muir, H.I.H. Saravanamuttoo and D.J. Marshall. 1989. Health monitoring of variable geometry gas
turbines for the Canadian navy, ASME J. Eng. Gas Turbines Power, 111(2), 244-250. http://dx.doi.org/10. 1115/1.3240243.
[5] R.W. Eustace, B.A. Woodyatt, G.L. Merrington and A. Runacres. 1994. Fault signatures obtained from fault implant tests on an f404 engine, ASME J. Eng. Gas Turbines Power, 116(1), 178-183. http://dx.doi.org/10. 1115/1.2906789.
[6] G.L. Merrington. 1994. Fault diagnosis in gas turbines using a model-based technique, ASME J. Eng. Gas Turbines Power, 116(2), 374-380. http://dx.doi.org/ 10.1115/1.2906830.
[7] A. Stamatic, K. Mathioudakis, M. Smith and K. Papailiou. 1990. Gas turbine component fault identification by means of adaptive performance modelling, ASME Paper 90-GT-376.
[8] K. Goebel, N. Eklund and B. Brunell. 2004. Rapid detection of faults for safety critical aircraft operation,
IEEE Proc. Aero. Conf., http://dx.doi.org/10.1109/ aero.2004.1368144.
[9] M. Vahdati, G. Simpson and M. Imregun. 2008. Unsteady flow and aeroelasticity behaviour of aeroengine core compressors during rotating stall and surge, ASME: J. Turbomachinery, 130(3). http://dx.doi.org/10.1115/ 1.2777188.
[10] Y. Li and A.I. Sayma. 2014. Numerical investigation of VSVs mal-schedule effects in a three-stage axial compressor, ASME Paper GT2014-25145.
[11] A. Bohne and R. Niehuis. 2004. Experimental off-design investigation of unsteady secondary flow phenomena in a three-stage axial compressor at 68% nominal speed,
ASME Paper GT2004-53100.
[12] R. Niehuis, A. Bohne and A. Hoynacki. 2003. Experimental investigation of unsteady flow phenomena in a three-stage axial compressor, Proc. IMechE Part A: J. Power & Energy, 217, 341-348. http://dx.doi.org/ 10.1243/095765003322315397.
[13] A.I. Sayma, M. Vahdati and M. Imregun. 2000. An Integrated nonlinear approach for turbomachinery forced response prediction: Part I: Formulation, J. Fluids & Str., 14, 87-101. http://dx.doi.org/10.1006/jfls.1999.0253.
[14] Y. Li and A.I. Sayma. 2014. Computational fluid dynamics simulations of blade damage effect on the performance of a transonic axial compressor near stall,
Proc. IMechE Part C: J. Mech. Engg. Science, 19, 1-19. [15] A.I. Sayma. 2009. Towards virtual testing of
compression systems in gas turbine engines, The NAFEMS International J. CFD Case Studies, 9, 29-42. [16] A.I. Sayma, M. Vahdati, L. Sbardella and M. Imregun.
2000. Modelling of 3D viscous compressible turbomachinery flows using unstructured hybrid grids,
AIAA J., 38(6), 945-954. http://dx.doi.org/10.2514/2. 1062.
[17] L. Sbardella, A.I. Sayma, and M. Imregun. 2000. Semi-structured meshes for axial turbomachinery blades, Int. J. Num. Meth. in Fluids, 32(5), 569-584. http://dx.doi.org/ 10.1002/(SICI)1097-0363(20000315)32:5<569::AI D-FLD975>3.0.CO;2-V.