R E S E A R C H
Open Access
An expanded model of HIV cell entry phenotype
based on multi-parameter single-cell data
Katarzyna Bozek
1,4†, Manon Eckhardt
2,5†, Saleta Sierra
3, Maria Anders
2, Rolf Kaiser
3, Hans-Georg Kräusslich
2,
Barbara Müller
2*and Thomas Lengauer
1*Abstract
Background:Entry of human immunodeficiency virus type 1 (HIV-1) into the host cell involves interactions between the viral envelope glycoproteins (Env) and the cellular receptor CD4 as well as a coreceptor molecule (most importantly CCR5 or CXCR4). Viral preference for a specific coreceptor (tropism) is in particular determined by the third variable loop (V3) of the Env glycoprotein gp120. The approval and use of a coreceptor antagonist for antiretroviral therapy make detailed understanding of tropism and its accurate prediction from patient derived virus isolates essential. The aim of the present study is the development of an extended description of the HIV entry phenotype reflecting its co-dependence on several key determinants as the basis for a more accurate prediction of HIV-1 entry phenotype from genotypic data.
Results:Here, we established a new protocol of quantitation and computational analysis of the dependence of HIV entry efficiency on receptor and coreceptor cell surface levels as well as viral V3 loop sequence and the presence of two prototypic coreceptor antagonists in varying concentrations. Based on data collected at the single-cell level, we constructed regression models of the HIV-1 entry phenotype integrating the measured determinants. We
developed a multivariate phenotype descriptor, termed phenotype vector, which facilitates a more detailed characterization of HIV entry phenotypes than currently used binary tropism classifications. For some of the tested virus variants, the multivariant phenotype vector revealed substantial divergences from existing tropism predictions. We also developed methods for computational prediction of the entry phenotypes based on the V3 sequence and performed an extrapolating calculation of the effectiveness of this computational procedure.
Conclusions:Our study of the HIV cell entry phenotype and the novel multivariate representation developed here contributes to a more detailed understanding of this phenotype and offers potential for future application in the effective administration of entry inhibitors in antiretroviral therapies.
Background
Human immunodeficiency virus (HIV) entry into host cells is initiated by binding of the viral envelope (Env) glycoprotein gp120 to the primary cellular receptor CD4 [1,2]. CD4 binding induces conformational changes in the gp120 glycoprotein [3], resulting in formation of a binding site for specific chemokine receptors, most im-portantly CCR5 and CXCR4 for HIV type 1 (HIV-1),
which serve as coreceptors for HIV entry [4-6]. The interaction of gp120 with the coreceptor induces a series of further conformational rearrangements in the viral Env glycoproteins that ultimately result in fusion of the virus envelope with the host cell membrane [1].
It has been shown that viruses using CCR5 (R5-tropic viruses) are almost exclusively present during the early asymptomatic stage of the infection whereas CXCR4-using viruses (X4-tropic viruses) emerge in later phases of the infection in about 50% of cases and are associated with a CD4+ T-cell decline and progression towards AIDS [7,8]. The finding that individuals lacking CCR5 expression due to a homozygous deletion in the ccr5 gene (CCR5/Δ32) are resistant to HIV-1 infection with-out suffering from adverse effects [9] stimulated the
* Correspondence: [email protected]; [email protected]
†Equal contributors
1
Department of Computational Biology and Applied Algorithmics, Max Planck for Computer Sciences, Campus E1 4, 66123 Saarbrücken, Germany
2
Department of Infectious Diseases Virology, University of Heidelberg, Im Neuenheimer Feld 324, 69120 Heidelberg, Germany
Full list of author information is available at the end of the article
search for HIV inhibitory CCR5 antagonists, which cul-minated in the approval of the compound Maraviroc (MVC) [10] for clinical use. The correlation of viral tropism with disease progression and its significance for treatment strategies specifically targeting R5 viruses underscore the clinical relevance of accurate monitoring of coreceptor usage.
The principal viral determinant of HIV coreceptor speci-ficity is the third variable (V3) loop of gp120 [11-13]. This is supported by several studies on the power of genotypic prediction based on the sequence of the V3 loop (see, e.g. [14-16]). Those methods have been developed as an alter-native to time-consuming and expensive phenotypic assays for surveying HIV coreceptor usage of viral populations from patient’s samples. They aim at computationally pre-dicting viral tropism based on the V3 loop sequence [11,12,17-20] and on its structure [21,22]. The straightfor-ward accessibility of computational prediction methods and the comparatively low cost of genotyping represent major advantages of sequence-based computational approaches for predicting coreceptor usage. Due to these advantages geno-typic tropism testing has entered clinical practice in Europe and has been acknowledged by the European expert guide-lines on tropism testing [23]. Currently used approaches classify virus isolates into either R5- or X4-tropic based on their V3 loop sequence. The limited accuracy of current pre-diction methods [20] advocates the development of expanded mathematical models of virus phenotype integrat-ing environmental and host molecular factors that are known to play a role in HIV entry in addition to the viral en-velope sequence. Such models will not only contribute to our understanding of the HIV entry process, but also provide a basis for more effective therapeutic use of HIV entry inhibitors.
Numerous factors determine the efficiency of the HIV membrane fusion process. Major determinants are the amino acid sequence of the viral Env protein and the availability, and concentration of CD4, and the two major coreceptors on the cell surface. Furthermore, the presence and concentration of compounds blocking HIV coreceptors can influence virus cell entry [24]. AMD-3100 (AMD), a drug blocking CXCR4, was the first coreceptor antagonist described for HIV-1 [25], but was never approved for clinical use in HIV infected patients due to se-vere adverse effects [26]. In contrast, several CCR5 antago-nists have entered clinical trials [27], with Maraviroc approved for patient treatment [28]. Since this drug is only effective in patients harbouring R5-tropic virus variants, viral tropism testing at the start of treatment is mandatory for prognosis of MVC therapy outcome. MVC resistance has been shown to evolve under therapy, not only through a switch of the viral popu-lation to X4-tropic variants, but also by mutations in the V3 loop enhancing the affinity of gp120 to
MVC-bound coreceptor molecules, which facilitate efficient entry mediated by CCR5 in the presence of the drug [29,30]. Nevertheless, with an increasing number of patients under MVC treatment a better understanding of the evolution of the virus under coreceptor antagonist drug pressure as well as the development of algorithms ac-curately predicting the efficacy of entry inhibitors are highly important.
HIV entry efficiency and its sensitivity towards coreceptor antagonists are complex phenotypes simultaneously de-pending on multiple determinants. In this study we aimed at a more comprehensive description of this multi-variant phenotype than what is reflected in current phenotype ana-lyses, to provide a basis for an improved prediction of HIV entry phenotypes. We present a model reflecting the multi-dimensional HIV entry phenotype based on a comprehen-sive experimental analysis of HIV cell entry efficiency dependent on its main determinants V3 loop sequence, cell surface CD4, CCR5 and CXCR4 expression levels, as well as on the presence of two prototypic coreceptor antagonists (MVC and AMD). Our analysis is based on an experimen-tal assay in which natural molecular variation of the recep-tor and coreceprecep-tor expression on the surface of a T-cell line and its effect on viral cell entry are quantified at the single-cell level. In this system we tested a panel of isogenic viruses differing only in the sequence of the V3 loop to limit the number of biological variables and developed regression models based on the single-cell data describing HIV cell entry dependence on the measured parameters. The mod-els provide a comprehensive representation of the viral phenotype, including effects of multiple important host and drug determinants on HIV entry and, in this way, raising tropism classification based on virus genotype to a new level of detail. Our approach offers an improved capacity of identifying X4 viruses over existing sequence-based meth-ods for tropism prediction. It additionally allows for recog-nizing a spectrum of virus phenotypes extending beyond binary R5/X4 tropism classification. Given a sufficient number of variants characterized in our assay, the multi-variate phenotype descriptor incorporating virus suscepti-bility to MVC can be inferred from V3 sequence, which is of high interest for practical use of our approach in patient treatment with coreceptor antagonists.
Results
Experimental and computational setup for acquisition and analysis of single-cell data
Since primary T-cells derived from peripheral blood mono-nuclear cells (PBMCs) would introduce unpredictable donor specific variations beyond the level of CD4 and core-ceptors on the cell surface, we employed a characterized T-cell line (SupT1/CCR5) expressing both coreceptors, CXCR4 and CCR5, as host cells. Receptor and coreceptor levels on this cell line were compared to those on primary T-cells derived from different blood donors (Additional file 1: Figure S1). Quantitative flow cytometry analysis revealed that SupT1/CCR5 cells displayed approximately two- to three-fold higher amounts of CXCR4 and CD4, respect-ively, on the cell surface compared to primary T-cells. This was balanced by a larger cell size of the SupT1/CCR5 cells (approximately two-fold higher volume as estimated from FSC/SSC parameters [31]), rendering the differences in CD4 and CXCR4 surface concentrations negligible. Levels of CCR5 on SupT1/CCR5 cells were approximately 6-fold higher than on PBMCs due to exogenous expression of this chemokine receptor in the cell line. Even though individual cells from this cell line are more homogeneous than pri-mary cells isolated from different donor samples, cell-to-cell variations in CD4, CCR5 and CXCR4 levels within the population of SupT1/CCR5 covered a sufficiently wide range, enabling us to measure the effect of their expression
variation on the efficiency of virus entry. Within the set of experiments used in this study, the expression levels of CD4, CCR5 and CXCR4 on the SupT1/CCR5 cell line ran-ged between 3,300-45,000, 700-12,000 and 3,000-44,400 molecules per cell, respectively (Additional file 1: Figure S2 and Additional file 1: Table S1). In order to correlate HIV entry efficiency with the density of CD4, CCR5 and CXCR4 on the cell surface, virus entry into individual cells was assessed in parallel with receptor- and coreceptor immuno-fluorescence measurements. This was done using a β-lactamase virion fusion assay based on fluorescence cytometry (BlaM assay; [32]). In this setup, β-lactamase packaged in the reporter viruses and released into the cytoplasm upon virus entry cleaves the fluoro-genic dye CCF-2 that has been loaded into the host cells, leading to a shift from green to blue fluores-cence emission.
The variability of tested virus variants was restricted to the amino acid sequence of the V3 loop. This loop has been described as the main predictor for viral tropism by numerous studies [11-13]. While sequences outside of the V3 region have been found also to contribute to HIV tropism [16], a high concordance between predic-tions based on bulk V3 sequencing of clinical samples and phenotypic tropism testing by Enhanced Sensitivity Trofile Assay (ESTA; a validated phenotypic assay) have been described [33-35] suggesting genotypic analysis of the V3 loop sequence alone as an accepted analysis method for clinical purposes [23,36]. Therefore, our ana-lysis was performed on a panel of isogenic reporter viruses differing only in the amino acid sequence of the V3 loop.
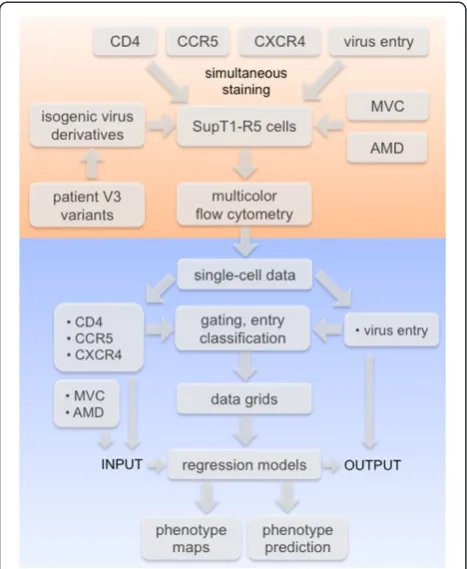
[image:3.595.57.291.89.374.2]We selected a set of 16 diverse patient-derived, and five lab-adapted V3 loop variants [37-40] based on their predicted tropism as determined by three tropism pre-diction tools [11,12,17,20] and sequence similarity to other V3 loops (compare Methods section; Additional file 1: Table S2). We used the X4-tropic lab-adapted strain NL4-3 [41] and its R5-tropic derivative NL4-3 R5 (kindly provided by S. Pöhlmann), differing by seven point mutations within the V3 loop as reference X4 and R5 viruses, respectively. Among the selected patient-derived sequences two were predicted as R5-tropic, 11 as X4-tropic and three showed ambiguous results in the sequence analysis (ambiguous variants). Among the lab-adapted strains, four were predicted as R5-tropic and one as X4-tropic (Additional file 1: Table S2). Analysis of the V3 sequences revealed that all sequences assigned as R5, as well as one ambiguous variant (924), were closely related to other R5 sequences as indicated by short branch lengths of the respective clades in the phylogenetic tree (Additional file 1: Figure S3). The reference X4 sequence, one lab-adapted X4 sequence (HxB2), and one of the patient-derived sequences Figure 1Data acquisition and analysis.The flow chart depicts the
predicted as X4 (286), belonged to the clades comprising predominantly X4 sequences. Among the remaining sequences, four (252, 381, 315 and 376) formed a closely related, seemingly dual-tropic group. Other sequences were located in parts of the tree occupied by both R5 and X4 sequences showing intermediate branch lengths. Detailed characterization of the sequences is provided in the Supplementary Information.
To ensure appropriate expression levels of the modified Env proteins, we introduced a gene segment encoding for the respective V3 loop into the NL4-3 proviral backbone. Reporter viruses carrying a Vpr-BlaM fusion protein were prepared from the tissue culture supernatant of transfected 293T cells and used to infect target cells at conditions yielding 20 to 30% entry positive cells. Infected cells were stained for BlaM activity as well as immunostained for cell surface expression of CD4, CXCR4 and CCR5. All para-meters were subsequently assessed in parallel on the single-cell level by multicolour flow cytometry.
An automated data analysis procedure was developed in order to process large amounts of data sets and eliminate investigator bias through manual gating of flow cytometry data. This included automated gating of the major live cell population based on forward scatter (FSC) and side scatter (SSC) flow cytometry values (Additional file 1: Figure S4), followed by binary classification into entry positive and entry negativeusing a computationally established decision boundary based on control measurements performed in parallel on uninfected cells (Methods; Additional file 1: Figure S5). This procedure was validated by manual gating of a subset of measurements (R2= 0.997; Additional file 1: Figure S6).
Analysis of multivariate data sets and comparison to binary sequence classification results
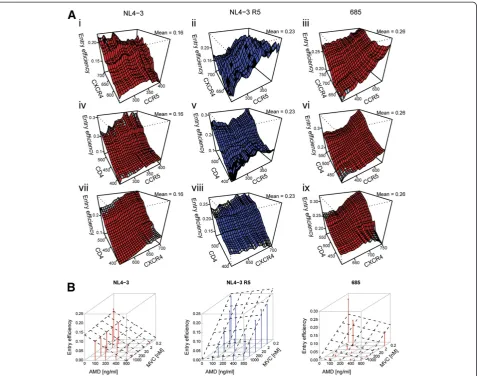
The measurements on the single-cell level and their auto-mated classification resulted in data sets comprising infor-mation on relative CD4, CXCR4 and CCR5 expression levels for each individual cell, in conjunction with the bin-ary information whether reporter virus had entered the re-spective cell. Analogous data sets were collected in the presence of varying concentrations of AMD and MVC. This set of measurements was performed for each virus variant. Figure 2 illustrates the multi-dimensionality of the phenotype measured in this study. Panels A depicts the entry efficiency of the reference X4 and R5 variants and one exemplary variant with a patient-derived V3 loop (685), respectively, dependent on different expression levels of all receptor and coreceptor combinations in the absence of drugs. Entry of the reference X4 virus NL4-3 depended predominantly on the expression level of CXCR4 as reflected by the gradient of the diagram depicting entry ef-ficiency in dependence of both coreceptors (Figure 2A i). In contrast, the reference R5 virus NL4-3 R5 showed
dependence predominantly on the expression level of CCR5 (Figure 2A ii), and virus 685 on the expression levels of both CCR5 and CXCR4 coreceptors (Figure 2A iii). For a better understanding of these complex dependencies, the entry efficiency in dependence of either one of the corecep-tors at various CD4 expression levels is depicted on the remaining plots of this panel (Figure 2A iv-ix). Analysis of entry efficiency in dependence of CXCR4 and CD4 showed a clear R5 tropic phenotype of the NL4-3 R5 variant with no apparent dependence on CXCR4 (Figure 2A viii). In contrast, virus 685 did display dependence on both CCR5 and CXCR4 (Figure 2A vi and ix). These visualizations re-veal the degree of molecular variability within a cell popu-lation considered to be homogeneous, and its effect on virus cell entry which is masked in bulk analyses. Figure 2B illustrates the dependence of viral entry efficiency on both coreceptor antagonists MVC and AMD present at different concentrations. Sensitivity of the reference viruses NL4-3 and NL4-3 R5 towards the CCR5 and CXCR4 antagonists, respectively, was in accordance with their coreceptor de-pendence. Virus 685 displayed a more complex phenotype, showing reduced sensitivity towards AMD and complete inhibition only in presence of both coreceptor antagonists (Figure 2B, right panel).
Phenotype maps
Data sets collected on the single-cell level were used to construct regression models reflecting dependence of the virus cell entry efficiency on the measured parameters. In these models, CD4, CCR5 and CXCR4 surface levels as well as MVC and AMD concentrations were used as input variables, while virus entry into a cell, as determined by the BlaM assay, was used as the output variable. Prior to model training, the single-cell data obtained with each of the var-iants were combined into a multidimensional grid defined on values representing CD4, CCR5 and CXCR4 expression levels aggregated into value segments and on all tested drug concentrations. Virus cell entry information was aver-aged over the cells within each bin of the grid. Model selec-tion was performed on a variety of model classes (Additional file 1: Table S3) defined on the five input
[image:5.595.61.539.88.464.2]model distance of about 1.94 vs. 1.74) (Additional file 1: Table S5) and were termed logarithmic model and linear modelrespectively. Since the linear model produced a better separation of the reference models, we focused on results based on the linear model in the following parts of this study. Details of the model selection and the comparison of the R5 and X4 models are provided in the Supplementary Informa-tion (AddiInforma-tional file 1: Table S3, AddiInforma-tional file 1: Table S4, Additional file 1: Table S5 and Additional file 1: Figure S8). Next, the selected model was trained on the data grids of all tested viruses separately. The vector of parameter coefficients of each virus model was extracted and used as a multivariate descriptor of the phenotype, termed here phenotype vector. The phenotype vectors of the reference viruses NL4-3 and NL4-3 R5 represent reference X4 and R5 phenotypes, re-spectively. The magnitude and sign of the respective param-eter coefficient describe the phenotype of a virus variant in terms of its receptor and coreceptor usage and its suscepti-bility to the two coreceptor antagonists (Figure 4). Input vari-able coefficients describing the reference models varied
mostly in the respective drug and coreceptor coefficients and showed comparable CD4 dependence of both virus tropisms as reflected in comparable input variable coefficients for this parameter.
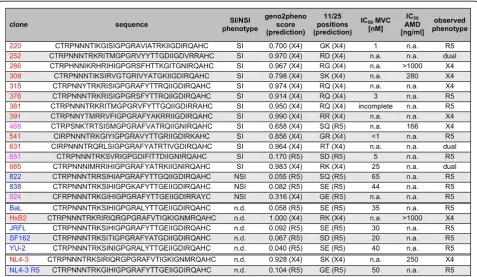
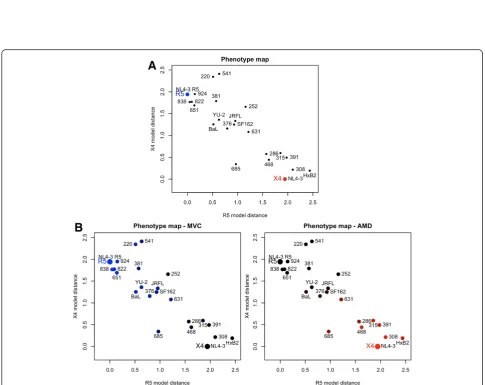
[image:6.595.59.537.89.366.2]The Euclidean distance between the phenotype vectors of the tested variants and that of each of the two reference phenotypes was used as a measure of similarity to both reference phenotypes. Thus, each variant was represented by two values expressing its similarity to the R5- and X4-tropic phenotype, respectively. This representation allows for visualizing the phenotype in convenient 2D plots, termed here phenotype maps(Figure 5). The proximity of variants in the phenotype maps to the reference viruses reflects similarity of entry efficiency phenotypes (Figure 5). Viruses located in proximity of the R5 reference model showed dependence on CCR5 expression and sensitivity to MVC, viruses located close to the X4 reference model showed dependence on CXCR4 expression and sensitivity to AMD. Viruses 685, 252 and 631 showed a dual-tropic phenotype in our assay and were located in the central area Figure 3Characterization of V3 sequences of clones tested in this study.Column“phenotype”indicates syncytium (SI) or non-syncytium (NSI) inducing phenotype as determined on PBMC cells; n.d., not determined. Columns“geno2pheno score”and“11/25 positions”indicate the prediction score of geno2pheno[coreceptor] method [20] and 11 and 25 residues [11,12], and the tropism predicted based on these two methods, respectively. A false positive rate of 5% was selected as the decision cut-off for geno2pheno prediction. The colour indicates the predicted phenotype: blue–clearly R5, red–clearly X4, magenta–ambiguous. To obtain IC50values, entry efficiency was determined by bulk
[image:6.595.61.537.94.368.2]Figure 4Variable coefficients of reference models.Boxplots show parameter coefficient variation for R5 (A) and X4 (B) reference models in a bootstrapping test of model training on 75% data points sampled 100 times out of the entire set of data.
[image:7.595.55.541.279.664.2]of the map, distant from the two reference models. The different degrees of similarity of the variant phenotypes to the reference phenotypes are reflected by their dispersed position on the map illustrating how our approach allows to differentiate a spectrum of virus phenotypes which is only partially captured by binary tropism classification.
Information on the sensitivity of virus derivatives to-wards coreceptor antagonists is included in the pheno-type vector and can be visualized on the phenopheno-type maps. Colours on the phenotype maps in Figure 5B il-lustrate the strength of the inhibition by MVC and AMD. Shades of blue represent sensitivity to MVC, shades of red represent sensitivity to AMD. Black colour on both plots indicates lack of sensitivity to either of the receptor antagonists tested. Two groups of variants can be distinguished on the map, variants responsive to MVC and variants responsive to AMD, respectively (coloured in different shades of blue and red, respect-ively). The colouring of variants 685, 631 and 252 indi-cates either lower sensitivity (685 and 631) or no response (252) to both of the drugs. These three variants are also positioned between the two groups of R5 and X4 viruses on the map, variants 252 and 631 closer to R5-, variant 685 closer to X4-tropic viruses. This illus-trates how the position in the map reflects the sensitivity of the variant to coreceptor antagonists and where a po-tential boundary between phenotypes can be located. The phenotype maps can therefore be used for visual display of the sensitivity to MVC treatment. In this way, phenotype vectors represent the large and multi-parameter single-cell data set in a quantitative and con-cise manner.
Prediction of the phenotype vector
The phenotype vector provides an insightful characterization of the virus phenotype including coreceptor usage, sensitivity to drugs and its location in the spectrum of phenotypes be-tween R5 and X4 reference phenotypes. Given the cost and duration of experimental testing of individual variants, com-putational prediction of virus phenotype from sequence is crucial for the practical use of the presented approach in a clinical setting. Therefore, we developed computational methods for predicting the multivariate phenotype vector based on the V3 loop sequence. Since the small number of variants presents a major limitation for the development of an accurate prediction method, we extrapolated the effect of the size of the experimentally characterized variants in the training set on prediction accuracy.
Prediction models were trained on the binary sequence encoding of the variants´ V3 sequences with the respect-ive phenotype vectors as the output variables. To con-struct prediction models, we used shrinkage methods that allow for reducing the high number of dimensions of the sequence data in the presence of a low number of
observations: the 23 variants tested in our study exhib-ited 88 positions that differed among the variants in the binary sequence encoding of their V3 loop. Among the statistical modelling approaches that we tested ([42,43]; Methods), Lasso regression [43] yielded the highest accur-acy and was used in the following steps of this analysis (Additional file 1: Figure S10).
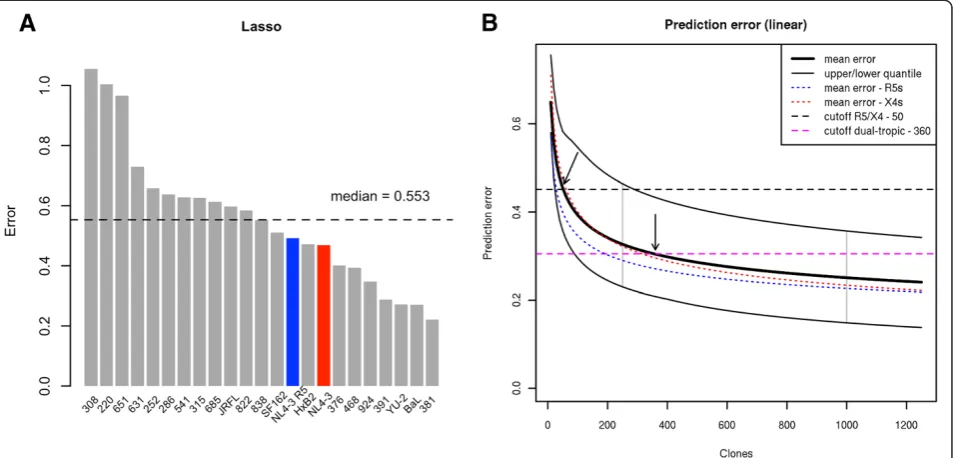
The prediction error of the phenotype vectors was esti-mated in terms of the Euclidean distance between ob-served and predicted phenotype vectors in a leave-one-out cross validation (LOOCV) on the set of tested viruses (Figure 6A). On average, X4-tropic variants showed a slightly, but not significantly, higher error than R5-tropic variants (0.562 vs. 0.525 respectively, p ~ 0.5). The highest average error was observed for dual-tropic variants (0.666), reflecting the difficulty of predicting this phenotype. Three variants (308, 220, 651) showed a markedly elevated prediction error compared to the other variants in the dataset. Notably two of these (220, 651) displayed a phenotype in our assay that was inconsistent with tropism prediction by common geno-typic methods – both showed an R5 phenotype in the assay despite being previously classified as X4 (220) or ambiguous (651). V3 loop sequences of these variants were located in a sparse cluster of both R5 and X4 sequences (Additional file 1: Figure S3) suggesting that the sequences of these V3 loops represent boundary cases between two tropisms which contributes to the difficulty in their tropism prediction.
We next performed a simulation test aimed at infer-ring the relationship between the size of the training set and the accuracy of phenotype prediction. For each of the variants we fitted a polynomial error function fðxÞ ¼axb, reflecting the decrease of the prediction error
The parameter b of the functions of the remaining variants was located in the range (-0.454, -0.059) with a mean of -0.244. The mean was comparable for the R5 and X4 variants (-0.256 and -0.261, respectively), suggesting that our prediction approach allows for achieving comparable sensitivity and specificity of prediction on both kinds of variants.
Next, the fitted functions were used to approximate the prediction error of models constructed on training sets of sizes exceeding the 23 virus derivatives tested in this study. Figure 6B shows averaged error functions of all variants (thick black line), of R5-tropic variants (dashed blue line), and of X4-tropic variants (dashed red line) plotted in the range of training set size of (0, 1250] virus variants. To define the extrapolation cut-off, we introduced the notion of a borderline phenotype. A bor-derline phenotype is derived from the observed pheno-type by setting the coefficients characterizing the given phenotype to zero. For an R5 virus these coefficients are associated with CCR5 and MVC levels, for an X4 virus with CXCR4 and AMD levels, for a dual-tropic virus with MVC and AMD levels. Borderline phenotypes derived in this way are located in the region between R5- and X4- tropic viruses on the phenotype map (Additional file 1: Figure S13) and represent the min-imal change in a virus phenotype vector that produces
[image:9.595.62.539.90.319.2]training set size 290. These results indicate that a training set of less than 100 variants allows for accurate prediction of R5 and X4 phenotypes. To achieve a reliable prediction of dual-tropic phenotypes the experimentally validated training set would have to be expanded to 300-400 variants.
Discussion
The difficulty of predicting the outcome of MVC therapy in HIV-1 infected patients [29,30,44], the flexibility of the virus to use other coreceptors than CCR5 or CXCR4 [45] and the high variability of V3 loop sequences indi-cate that the HIV-1 cell entry phenotype is more com-plex than what is reflected in the binary classification of CCR5/CXCR4 coreceptor usage. In this study we ad-dress the shortcomings of current sequence-based meth-ods of HIV tropism classification and the need for more accurate recognition of X4-tropic viruses and for better virus characterization for the effective use of coreceptor antagonists.
The study is based on multivariate datasets acquired at the single-cell level. The analysis at the single-cell level affords higher level of detail than the approach based on averaged measurements of entire cell populations [46] and provides additional information used for construction of an expanded representation of the viral phenotype. Fur-thermore, the integration of individual cells covering a wide range of receptor and coreceptor surface levels results in robustness of the model, making it applicable to target cell populations with different average expression levels of these proteins (Additional file 1: Figure S14). Novel meth-ods for analysis and visualization of the large and multi-parameter single-cell data as well as for constructing comprehensive models of HIV cell entry phenotypes were developed. Our experimental and analytical approach has a higher capacity of detecting X4-tropic viruses than com-mon sequence-based prediction methods. Several variants classified as X4-tropic or of dubious tropism based on genotypic and phenotypic tropism prediction methods showed an R5 phenotype in our assay. We observe a stron-ger response to MVC even at low drug concentrations of these incorrectly predicted variants than of the viruses cor-rectly classified as R5-tropic. Thus, a weaker binding affin-ity to the CCR5 coreceptor might be a reason for the misclassification of these variants in the available assays used for tropism prediction.
We propose a novel representation of the HIV entry phenotype in the form of a multivariate phenotype vector expressing virus dependence on several molecular and en-vironmental determinants. The phenotype vector and its position in the phenotype map provide a more detailed characterization of viral tropism than the binary classifica-tion. The phenotype map (Figure 5) represents a conveni-ent visual display of virus phenotypes grouping phenotypes
of similar response to coreceptor antagonists. Dual-tropic variants (252, 631 and 685) are located in the central part of the phenotype map between R5- and X4-tropic variants. Populating the map with a larger number of dual-tropic viruses will allow for establishing a boundary between the phenotypes and discriminating between viruses susceptible to either CCR5 or CXCR4 antagonists.
The experimental procedures for multi-parameter pheno-typic testing for entry efficiency are costly and time-consuming and thus not applicable in a clinical setting. Therefore, one aim of this study was to explore the per-spectives of virtualizing the phenotype vector by providing a computational procedure that estimates the phenotype vector based on the V3 loop sequence of the virus (see also [47]). We developed a method for predicting the phenotype vector that is based on the V3 loop sequence. The method shows comparable performance on R5- and on X4-tropic viruses suggesting that, despite the high variability of X4 sequences [48], a method of comparable sensitivity and spe-cificity for both R5- and X4-tropic viruses can be obtained. The accurate prediction of both the X4 phenotype and the virus response to MVC, being a part of the phenotype vec-tor, are of high interest for successful application of therap-ies based on coreceptor antagonists. An accurate prediction method relies on virological data describing a sufficiently large number of tested variants. We extrapolated the num-ber of variants necessary to be tested for the derivation of accurate models for phenotype vector prediction. Our ana-lysis indicates that fewer than 100 variants are sufficient for a reliable phenotype prediction of R5 and X4 viruses and we are currently generating data sets to accomplish this aim. Increasing the training set size to data sets experimen-tally determined for 300–400 variants would allow for ac-curate prediction of dual-tropic viruses.
Conclusions
This study represents a step towards constructing a com-prehensive computational phenotype of the HIV cell entry incorporating the strength of the effect of several molecu-lar and environmental factors on the virus cell entry be-yond binary classification of its coreceptor usage. Given the limitations of sequence-based methods of virus tropism classification, expanding models with other than sequence molecular information represents a potentially promising avenue for improving our understanding of the phenotype and its prediction.
Methods
Variant selection
microscopy as described in [50]. Viral RNA was isolated and sequenced as described in [51]. The obtained V3 loop sequences were characterized with respect to their location in V3 sequence space [48], NSI/SI phenotype and tropism predicted by three computational methods: geno2pheno[coreceptor] [20], WebPSSM [17] and the 11/25 rule [11,12].
Plasmids and cell lines
The V3 loop coding sequence was amplified by PCR from the RT-PCR products of patient samples or by PCR from plasmids comprisingenv sequences of lab-adapted strains, respectively. Primers used for amplification introduced PvuII (5’: 21 bp upstream of V3 loop sequence) andXbaI (3’: 6 bp downstream of V3 loop sequence) restriction sites, respectively. For some of the constructs, synthetic gene fragments encoding V3 loops with the respective flanking sites were used (GeneArt AG, Germany). Fragments were subcloned into pCAGGS.NL4-3-Xba, an EnvNL4-3
expres-sion construct derived from pCAGGS.NL4-3 (kindly pro-vided by S. Pöhlmann) harbouring uniqueXbaI andPvuII restriction sites flanking the V3 loop encoding sequence. The silent mutation generating anXbaI site was introduced by overlap PCR using primers introducing an A to T and a G to C conversion at positions 994 and 995 of theenv cod-ing sequence, respectively. To yield the respective pCHIV derivatives, a StuI/XhoI fragment (comprising part of env including the V3 loop) was transferred into pCHIVΔStu, a derivative of pCHIV [52], carrying a uniqueStuI site within the env gene. pCHIV derivatives encode for a non-infectious proviral NL4-3-based clone which expresses all viral proteins except the accessory protein Nef. A variant of pCHIV harbouring a frameshift mutation in the beginning of the env gene (pCHIV.Env-) [52] was used to produce isogenic viruses lacking the Env protein on their sur-face (Env-).
The coding sequence of an optimized version of a β-lactamase was amplified from pJH_SSbla_Bla-FL_UDG_S1-1 [53] by PCR with primers introducingKpnI andEcoRI restriction sites. The resulting fragment was sub-cloned into pMM310 [54] to yield pBlaM.opt, encoding for a fusion protein including the HIV-1 accessory protein Vpr and β-lactamase, separated by a recognition site for the HIV-1 protease.
293T [55], cells were grown in Dulbecco’s modified Eagle’s medium (DMEM GlutaMAX; Invitrogen) sup-plemented with 100 U/ml penicillin, 100 μg/ml streptomycin and 10% fetal calf serum (FCS) at 37° C, 5% CO2. SupT1/CCR5 cells [56] were kept in
RPMI1640 GlutaMAX™ supplemented with 100 U/ml penicillin, 100 μg/ml streptomycin and 10% FCS. Transfections were carried out using polyethylenei-mine according to standard procedures.
β-lactamase virion fusion assay
Entry efficiency was determined by a previously described HIV fusion assay [32]. Briefly, viral reporter particles were prepared from 293T cells co-transfected with the respective pCHIV derivative and pBlaM.opt (plasmid ratio 15:1). At 44 h post transfection, tissue culture supernatants were pre-cleared by filtration through a 0.45μm nitrocellulose filter and virions were purified by ultracentrifugation through a 20% (w/v) sucrose cushion. Proteins from pelleted particles were separated by SDS-PAGE (acrylamide:bisacrylamide 200:1, 17.5% acrylamide) and transferred to a nitrocellulose membrane by semi-dry blotting. Membranes were probed with polyclonal antisera raised against HIV-1 CA. Bound antibodies were detected by quantitative immunoblot using a LiCor Odyssey system and particle concentration was determined by comparison to purified CA protein analyzed in parallel. Adjusted amounts of virus that yielded about 30% of infection (as determined by titration experiments for each virus batch) were used to infect 1x10⁶ SupT1/CCR5 cells seeded in V-bottom 96-wells. For experiments including coreceptor antagonists, cells were preincubated with varying concentrations of drugs for 1 h at 37°C before virus was added. Following incubation with virus at 37°C for 6 h, supernatant was removed and cells were incubated with theβ-lactamase cleavable dye CCF2-AM (GeneBLAZER, Invitrogen) in staining medium according to the manufacturer’s instructions for 16 h at room temperature. Cells were fixed with 3% PFA/PBS for 1 h at room temperature and stained for receptor and core-ceptor surface levels with monoclonal antibodies directly coupled to three different fluorophors (αCD4-APC-H7, clone RPT-4, αCD184-APC, clone 12G5 andαCD195-PE, clone 2D7/CCR5; BD Biosciences, Germany) for 1 h at room temperature. 100’000 cells per sample were analysed by flow cytometry on a BD FACS CantoII machine using FACSDiva Software. FCS2.0 files including the appropriate values for compensation (as determined by single-stained controls) were exported and subjected to computational analysis. To establish the entry positive gate, mock infec-tions (no virus) were carried out in parallel for each experi-mental condition. In addition, viruses lacking the Env protein on their surface (Env-) were used in parallel to con-trol for background signal independent of Env-receptor interactions.
Automated gating
commonly represented by 2D scatter plots with FSC along the x-axis and SSC along the y-axis. In the automated gat-ing procedure cells were first filtered through a user-defined square window user-defined on the FSC and SSC values. Here, we used a filter of 300 < FCS < 1200 and 0 < SSC < 900 based on visual inspection. Next, a 2D grid of FSC and SSC values was defined and the numbers of cells in each bin of this grid were calculated, which can be presented in form of a heat map (Additional file 1: Figure S4). Each bin of the grid had width and height 5, a value that was chosen among several others based on its gating agreement with the man-ual method. Next, for each of the values xi on the x-axis
(FSC) a grid bin positionðxi;yiÞ was found that contained
the maximum number of cells among all bins at the given xi. For each such bin positionðxi;yiÞthe minimum distance diwas determined such that no cells were found in the bins
at equidistant positions ðxi;yidiÞ andðxi;yiþdiÞ: The
positionsðxi;yi1Þ ¼ ðxi;yidiÞandðxi;yi2Þ ¼ ðxi;yiþdiÞ
were termed surrounding points. Next, to produce a smooth gating line, the y-coordinates of the surrounding points were averaged: yi;k was replaced by the mean value
of itself and two neighbouring surrounding points
1 3
Pj¼iþ1
j¼i1yjk , for k2f1;2g: The same procedure was
repeated along the y-axis. A gate was defined as the min-imal contiguous area on the FSC-SSC grid encircled by the line connecting consecutive surrounding points. Example results of the automated gating procedure are shown in Additional file 1: Figure S4. The mock infection measure-mentno viruswas used as the control for establishing the gate. All measurements in the same experiment were gated accordingly. For reading the FCS2.0 files the R package pradawas used, a part of Bioconductor [57].
BlaM classification
A classical approach to BlaM-based entry classification entails a manually established decision boundary estab-lished based on the “no virus” control. The decision boundary is determined based on the plot of the intensity of blue (x-axis) against green (y-axis) CCF2 signal of the cells in the control measurement. It delineates the region of uninfected cells as a minimal region cells such that y>x and ~0.01% of the control cells are located out-side of this region. Measurements of cells incubated with virus variants are classified according to this control-based decision boundary.
In order to efficiently classify the large number of flow cytometry measurements and to obtain reproducible results we established an automated method of BlaM classification. Our approach is based on a linear functiony¼axþb fit-ted to the blue (x) against green (y) CCF2 signal intensities of the cells of two merged controls – no virus and un-stained. For each point on the fitted line ðxi;yiÞ, where yi¼axiþb and xi¼1::1200 , data point ðxpi;ypiÞ was
found such that ypi<xpi that is the most distant from
ðxi;yiÞ, located on the line perpendicular to the fitted line
that intersects the fitted line atðxi;yiÞ:y¼ 1axþbi, where bi¼yiþ1axi. Points ðxpi;ypiÞ represent cells showing the
highest shift in the blue signal relative to the green signal among the cells of the control measurements. Next, the distances of these points from the fitted line were smoothed using a sliding window approach by averaging the values within each window and adding of one standard deviation of the values within that window. The added standard devi-ation represents a margin beyond the control cells that ensures the required low proportion of false positives in the control measurement (~0.01%). A window size of 30 was selected as the size resulting in the best classification per-formance. The smoothed points projected back onto the plot of green and blue signals defined the cut-off decision line–cells represented by data points located in the part of the plot below the decision line were classified as entry positive, those located above the line were classified asentry negative(Additional file 1: Figure S5). The method design and the choice of parameters were guided by the compari-son with manual classification with the goal of achieving the highest agreement on a large number of measurements (Additional file 1: Figure S6). Classification based on this procedure termed herebinary classificationassigns a binary value to each cell, 0 representing entry negative and 1 entry positive cells. To compensate for differences between the automated binary and manual classification, we additionally developed an alternative margin classifica-tion (Supplementary Information; Additional file 1: Figure S7). However, use of this classification method did not affect accuracy of regression models of the virus entry efficiency, and binary classification was chosen as the less complex approach throughout this study. An example of classification of virus measure-ment using both methods is depicted in Additional file 1: Figure S7. The steps of the classification pro-cedure are described and illustrated in detail in the Supplementary Information.
Visualization methods
numbers of cells that show a given combination of parameter values, parts of the grid that contained less than a selected minimum number of cells are col-oured in gray. The selected minimum number of cells is 10% of the expected number of cells assuming an even distribution of cells over the grid.
Merging the data
To compensate for potential noise in the measurement at the single-cell level, the data was aggregated into a multidimensional grid defined on aggregated values of CD4, CCR5 and CXCR4 and on all measured drug con-centration levels. CD4, CCR5 and CXCR4 expression levels were first scaled to standard normal distribution and cells in the top and bottom 2.5% tails of the distri-bution were removed. Next, a five-dimensional grid was defined – spanning all tested concentration levels of AMD and MVC and a predefined number of values of the CD4, CCR5 and CXCR4 expression levels, separating their range of expression into bins of equal size. We tested four bin sizes –5, 10, 20, 50 –for the quality of the resulting models. Values of binary classification of individual cells were averaged in each grid bin.
Data grids of cell entry measurements of each tested virus constructed in this way were merged across the in-dividual experiments resulting in a multidimensional data grid describing each virus’cell entry efficiency com-prehensively across all experiments.
Model selection
The selection criteria for model quality comprised two aspects: accuracy of model fit to the data and separation of the X4 and R5 phenotype vector. The first criterion– accuracy of model fit to the data–was based on the R2 measure estimated as:
R2¼1SSerr SStot;
where
SSerr¼ X
iðyifiÞ 2
is the sum of squared residuals with yi being observed
andfiestimated output, and
SStot ¼ X
iðyiyÞ 2
is the total sum of squares proportional to the sample variance withy¼1
n Pn
iyi being the sample mean. R2was
used as a measure of agreement between the observed and modelled values with higher values representing a better agreement.
The second criterion – separation of the R5 and X4 phenotype vector–was used to obtain models capable of
distinguishing between the two contrasting phenotypes. To measure the separation of the R5 and X4 models we used the Euclidean vector distance of the coefficient vectors of the two models. The model was selected for which the phenotype vectors of the R5 and X4 reference strains are most distant.
Prediction of phenotype vectors
For prediction we used binary sequence encoding in which each amino acid is represented by a binary vector of the length 20 with a single value 1 at the position indicating the present amino acid. The V3 loops of the 23 tested var-iants in this study include 88 positions that vary among the variants. We used two methods that involve shrinkage pro-cedures for linear regression: Ridge regression [42] and Lasso [43]. These methods were trained on the binary se-quence encoding of the V3 sese-quences of the viruses with the respective phenotype vectors as output variables. For each position of the phenotype vector representing a separ-ate output variable for the prediction method the penalty parameter λ resulting in minimal prediction error in LOOCV was chosen from a sequence of 100 values. The chosenλvalues were used in further phenotype prediction. In addition to Ridge regression and Lasso, we tested the performance of linear regression based on a reduced num-ber of input variables. The input variables were reduced to those showing significant (p < 0.01) Pearson correlation with any of the output variables (positions of the pheno-type vector). Significance was calculated in 1000 permuta-tion tests. The reducpermuta-tion procedure resulted in 26 and 17 input variables in the logarithmic and linear models of phenotype vectors, respectively.
Optimal training set size
Each variant’s phenotype was predicted based on a sampled training set of varying size increasing from 2 to 22. Train-ing sets of each size were sampled multiple times; the pre-diction error of each clone was averaged for each size of the training set. Next, a polynomial function fðxÞ ¼axb termed error function was fitted to the relationship be-tween the size of the training set and the prediction error. See Additional file 1: Figure S11 for examples of error functions.
Additional file
Additional file 1:“Supplementary Information”including 13 Supplementary Figures and 6 Supplementary Tables as well as additional Methods and References.
Abbreviations
flow cytometry data; SSC: Side scatter of flow cytometry data; LOOCV: Leave-one-out cross validation.
Competing interests
We certify that there isno competing interestwith any financial organization regarding the material discussed in the manuscript.
Authors’contributions
Designed and conceived experiments: HGK, TL, BM, RK, ME, KB. Performed experiments: ME, KB, SS, MA. Analyzed data: KB, ME. Discussed data: ME, KB, TL, BM, HGK, RK. Wrote the paper draft: ME, KB, all authors contributed to writing the paper and read and approved the final manuscript. Contributed patient samples: SS, RK.
Acknowledgements
We thank R. Doms for providing the cell line SupT1/CCR5, N. Landau for providing plasmid pMM310, K. Müller for providing plasmid
pJH_SSbla_BlaFL_UDG_S1-1, S. Pöhlmann for providing plasmids pCAGGS. NL4-3 and pCAGGS.NL4-3-R5, and L. Castillo for the gift of purified HIV-1 CA protein. Flow cytometry data were acquired at the ZMBH FACS facility. This work was supported as part of the MedSys initiative by the German Federal Ministry of Education and Research (BMBF) grant No. 0315480.
Author details
1Department of Computational Biology and Applied Algorithmics, Max
Planck for Computer Sciences, Campus E1 4, 66123 Saarbrücken, Germany.
2Department of Infectious Diseases Virology, University of Heidelberg, Im
Neuenheimer Feld 324, 69120 Heidelberg, Germany.3Institute of Virology,
University of Cologne, Fürst-Pückler-Strasse 56, 50935 Cologne, Germany.
4
Current address: CAS-MPG Partner Institute for Computational Biology, Shanghai, P.R. China.5Current address:Department of Cellular and Molecular
Pharmacology, University of California, San Francisco, CA 94158, USA.
Received: 9 January 2012 Accepted: 7 June 2012 Published: 25 July 2012
References
1. Chan DC, Kim PS:HIV entry and its inhibition.Cell1998,93:681–684. 2. Pierson TC, Doms RW:HIV-1 entry and its inhibition.Curr Top Microbiol
Immunol2003,281:1–27.
3. Sattentau QJ, Moore JP:Human immunodeficiency virus type 1 neutralization is determined by epitope exposure on the gp120 oligomer.J Exp Med1995,182:185–196.
4. Feng Y, Broder CC, Kennedy PE, Berger EA:HIV-1 entry cofactor: functional cDNA cloning of a seven-transmembrane, G protein-coupled receptor.
Science1996,272:872–877.
5. Moore JP:Coreceptors: implications for HIV pathogenesis and therapy.
Science1997,276:51–52.
6. Trkola A, Dragic T, Arthos J, Binley JM, Olson WC, Allaway GP, Cheng-Mayer C, Robinson J, Maddon PJ, Moore JP:CD4-dependent, antibody-sensitive interactions between HIV-1 and its co-receptor CCR-5.Nature1996,
384:184–187.
7. Berger EA, Murphy PM, Farber JM:Chemokine receptors as HIV-1 coreceptors: Roles in viral entry, tropism, and disease.Annu Rev Immunol
1999,17:657–700.
8. Miedema F, Meyaard L, Koot M, Klein MR, Roos MT, Groenink M, Fouchier RA, Van’t Wout AB, Tersmette M, Schellekens PT,et al:Changing virus-host interactions in the course of HIV-1 infection.Immunol Rev1994,140:35–72. 9. Huang Y, Paxton WA, Wolinsky SM, Neumann AU, Zhang L, He T, Kang S,
Ceradini D, Jin Z, Yazdanbakhsh K,et al:The role of a mutant CCR5 allele in HIV-1 transmission and disease progression.Nat Med1996,2:1240–1243. 10. Dorr P, Westby M, Dobbs S, Griffin P, Irvine B, Macartney M, Mori J, Rickett
G, Smith-Burchnell C, Napier C,et al:Maraviroc (UK-427,857), a potent, orally bioavailable, and selective small-molecule inhibitor of chemokine receptor CCR5 with broad-spectrum anti-human immunodeficiency virus type 1 activity.Antimicrob Agents Chemother2005,49:4721–4732. 11. Fouchier RA, Groenink M, Kootstra NA, Tersmette M, Huisman HG, Miedema
F, Schuitemaker H:Phenotype-associated sequence variation in the third variable domain of the human immunodeficiency virus type 1 gp120 molecule.J Virol1992,66:3183–3187.
12. Shioda T, Levy JA, Cheng-Mayer C:Small amino acid changes in the V3 hypervariable region of gp120 can affect the T-cell-line and macrophage tropism of human immunodeficiency virus type 1.Proc Natl Acad Sci U S A1992,89:9434–9438.
13. Speck RF, Wehrly K, Platt EJ, Atchison RE, Charo IF, Kabat D, Chesebro B, Goldsmith MA:Selective employment of chemokine receptors as human immunodeficiency virus type 1 coreceptors determined by individual amino acids within the envelope V3 loop.J Virol1997,71:7136–7139. 14. Raymond S, Delobel P, Mavigner M, Ferradini L, Cazabat M, Souyris C,
Sandres-Sauné K, Pasquier C, Marchou B, Massip P, Izopet J:Prediction of HIV type 1 subtype C tropism by genotypic algorithms built from subtype B viruses.J Acquir Immune Defic Syndr2010,53:167–175. 15. Recordon-Pinson P, Soulie C, Flandre P, Group AARS,et al:Evaluation of the
genotypic prediction of HIV-1 coreceptor use versus a phenotypic assay and correlation with the virological response to maraviroc: the ANRS
GenoTropism study.Antimicrob Agents Chemother2010,54:3335–3340. Aug. 16. Thielen A, Sichtig N, Kaiser R, Lam J, Harrigan PR, Lengauer T:Improved
prediction of HIV-1 coreceptor usage with sequence information from the second hypervariable loop of gp120.J Infect Dis2010,202:1435–1443. 17. Jensen MA, van 't Wout AB:Predicting HIV-1 coreceptor usage with
sequence analysis.AIDS Rev2003,5:104–112.
18. Resch W, Hoffman N, Swanstrom R:Improved success of phenotype prediction of the human immunodeficiency virus type 1 from envelope variable loop 3 sequence using neural networks.Virology
2001,288:51–62.
19. Pillai S, Good B, Richman D, Corbeil J:A new perspective on V3 phenotype prediction.AIDS Res Hum Retroviruses2003,19:145–149. 20. Sing T, Low AJ, Beerenwinkel N, Sander O, Cheung PK, Domingues FS, Büch
J, Däumer M, Kaiser R, Lengauer T, Harrigan PR:Predicting HIV coreceptor usage on the basis of genetic and clinical covariates.Antivir Ther2007,
12:1097–1106.
21. Dybowski JN, Heider D, Hoffmann D:Prediction of co-receptor usage of HIV-1 from genotype.PLoS Comput Biol2010,6:e1000743.
22. Sander O, Sing T, Sommer I, Low AJ, Cheung PK, Harrigan PR, Lengauer T, Domingues FS:Structural descriptors of gp120 V3 loop for the prediction of HIV-1 coreceptor usage.PLoS Comput Biol2007,3:e58.
23. Vandekerckhove LP, Wensing AM, Kaiser R:ECGocmot: European guidelines on the clinical management of HIV-1 tropism testing.Lancet Infect Dis2011,11:394–407. May.
24. Este JA:Virus entry as a target for anti-HIV intervention.Curr Med Chem
2003,10:1617–1632.
25. De Clercq E, Yamamoto N, Pauwels R, Baba M, Schols D, Nakashima H, Balzarini J, Debyser Z, Murrer BA, Schwartz D,et al:Potent and selective inhibition of human immunodeficiency virus (HIV)-1 and HIV-2 replication by a class of bicyclams interacting with a viral uncoating event.Proc Natl Acad Sci U S A1992,89:5286–5290.
26. Dai SJ, Dou GF, Qiang XH, Song HF, Tang ZM, Liu DS, Liu XW, Yang LM, Zheng YT, Liang Q:Pharmacokinetics of sifuvirtide, a novel anti-HIV-1 peptide, in monkeys and its inhibitory concentration in vitro.Acta Pharmacol Sin2005,26:1274–1280.
27. Este JA, Telenti A:HIV entry inhibitors.Lancet2007,370:81–88. 28. Westby M, van der Ryst E:CCR5 antagonists: host-targeted antivirals
for the treatment of HIV infection.Antivir Chem Chemother2005,
16:339–354.
29. Trkola A, Kuhmann SE, Strizki JM, Maxwell E, Ketas T, Morgan T, Pugach P, Xu S, Wojcik L, Tagat J,et al:HIV-1 escape from a small molecule, CCR5-specific entry inhibitor does not involve CXCR4 use.Proc Natl Acad Sci U S A2002,99:395–400.
30. Westby M, Smith-Burchnell C, Mori J, Lewis M, Mosley M, Stockdale M, Dorr P, Ciaramella G, Perros M:Reduced maximal inhibition in phenotypic susceptibility assays indicates that viral strains resistant to the CCR5 antagonist maraviroc utilize inhibitor-bound receptor for entry.J Virol
2007,81:2359–2371.
31. Salzman G:Light scatter: detection and usage.In Curr Protoc Cytom2001, 1.13.1–1.13.8.
32. Cavrois M, De Noronha C, Greene WC:A sensitive and specific enzyme-based assay detecting HIV-1 virion fusion in primary T lymphocytes.Nat Biotechnol2002,20:1151–1154.
Screening Population of Therapy- experienced Patients.18th Conference on Retroviruses and Opportunistic Infections2011,:332. Abstract 666. 34. Prosperi MC, Bracciale L, Fabbiani M, Di Giambenedetto S, Razzolini F, Meini
G, Colafigli M, Marzocchetti A, Cauda R, Zazzi M, De Luca A:Comparative determination of HIV-1 co-receptor tropism by Enhanced Sensitivity Trofile, gp120 V3-loop RNA and DNA genotyping.Retrovirology2010,30
(7):56. Jun.
35. Reuter S, Braken P, Jensen B, Sierra-Aragon S, Oette M, Balduin M, Kaiser R, Häussinger D:Maraviroc in treatment-experienced patients with HIV-1 infection - experience from routine clinical practice.Eur J Med Res2010,
28(15):231–237. Jun.
36. Walter H, Eberle J, Müller H, Noah C, Wolf E, Stürmer M, Braun P, Korn K, Däumer M, Berg T,et al:Empfehlung zur Bestimmung des
HIV-1-Korezeptor-Gebrauchs (DAIG Recommendations for the HIV-1 tropism testing). 2009, http://www.daignet.de/site-content/hiv-therapie/ leitlinien-1/resolveuid/db830c8f657ca0e4735d4ff2cf665b34.
37. Koyanagi Y, Miles S, Mitsuyasu R, Merrill J, Vinters H, Chen I:Dual infection of the central nervous system by AIDS viruses with distinct cellular tropisms.Science1987,15(236):819–822. May.
38. Li Y, Kappes J, Conway J, Price R, Shaw G, Hahn B:Molecular characterization of human immunodeficiency virus type 1 cloned directly from uncultured human brain tissue: identification of replication-competent and -defective viral genomes.J Virol1991,
65:3973–3985.
39. Ratner L, Haseltine W, Patarca R, Livak K, Starcich B, Josephs S, Doran E, Rafalski J, Whitehorn E, Baumeister K,et al:Complete nucleotide sequence of the AIDS virus, HTLV-III.Nature1985,313:277–284.
40. Cheng-Mayer C, Levy J:Distinct biological and serological properties of human immunodeficiency viruses from the brain.Ann Neurol1988,23:
S58–S61.
41. Adachi A, Gendelman HE, Koenig S, Folks T, Willey R, Rabson A, Martin MA:
Production of acquired immunodeficiency syndrome-associated retrovirus in human and nonhuman cells transfected with an infectious molecular clone.J Virol1986,59:284–291.
42. Tychonoff A:On the stability of inverse problems.Dokl Akad Nauk SSSR
1943,39:195–198.
43. Tibshirani R:Regression shrinkage and selection via the lasso.J Royal Statist Soc B1996,58:267–288.
44. Westby M, Lewis M, Whitcomb J, Youle M, Pozniak AL, James IT, Jenkins TM, Perros M, van der Ryst E:Emergence of CXCR4-using human
immunodeficiency virus type 1 (HIV-1) variants in a minority of HIV-1-infected patients following treatment with the CCR5 antagonist maraviroc is from a pretreatment CXCR4-using virus reservoir.J Virol
2006,80:4909–4920.
45. Turville SG, Cameron PU, Handley A, Lin G, Pohlmann S, Doms RW, Cunningham AL:Diversity of receptors binding HIV on dendritic cell subsets.Nat Immunol2002,3:975–983.
46. Johnston SH, Lobritz MA, Nguyen S, Lassen K, Delair S, Posta F, Bryson YJ, Arts EJ, Chou T, Lee B:A quantitative affinity-profiling system that reveals distinct CD4/CCR5 usage patterns among human immunodeficiency virus type 1 and simian immunodeficiency virus strains.J Virol2009,
83:11016–11026.
47. Lengauer T:Bioinformatical Assistance of Selecting Anti-HIV Therapies: Where Do We Stand?Intervirology2012,55:108–112.
48. Bozek K, Thielen A, Sierra S, Kaiser R, Lengauer T:V3 loop sequence space analysis suggests different evolutionary patterns of CCR5- and CXCR4-tropic HIV.PLoS One2009,4:e7387.
49. Kamradt T, Niese D, Schneweis KE, Brackmann HH, Kamps B, van Loo B, Hammerstein U:Natural history of HIV-infection in hemophiliacs: clinical, immunological, and virological findings.Klin Wochenschr1989,17
(67):1033–1041. Oct.
50. Schneweis K, Kleim J, Bailly E, Niese D, Wagner N, Brackmann H:Graded cytopathogenicity of the human immunodeficiency virus (HIV) in the course of HIV infection.Med Microbiol Immunol1990,179:193–203. 51. Sierra S, Kaiser R, Lübke N, Thielen A, Schuelter E, Heger E, Däumer M,
Reuter S, Esser S, Fäetkenheuer G,et al:Prediction of HIV-1 Coreceptor Usage (Tropism) by Sequence Analysis using a Genotypic Approach.J Vis Exp2011,58:e3264.
52. Lampe M, Briggs JA, Endress T, Glass B, Riegelsberger S, Kräusslich HG, Lamb DC, Bräuchle C, Müller B:Double-labelled HIV-1 particles for study of virus-cell interaction.Virology2007,30(360):92–104. Mar.
53. Hecky J, Müller KM:Structural perturbation and compensation by directed evolution at physiological temperature leads to thermostabilization of beta-lactamase.Biochemistry2005,27(44): 12640–12654. Sep.
54. Münk C, Brandt SM, Lucero G, Landau NR:A dominant block to HIV-1 replication at reverse transcription in simian cells.Proc Natl Acad Sci U S A
2002,15(99):13843–13848. Oct.
55. Sena-Esteves M, Saeki Y, Camp SM, Chiocca EA, Breakefield XO: Single-step conversion of cells to retrovirus vector producers with herpes simplex virus-Epstein-Barr virus hybrid amplicons.J Virol1999,
73:10426–10439. Dec.
56. Means RE, Matthews T, Hoxie JA, Malim MH, Kodama T, Desrosiers RC:
Ability of the V3 loop of simian immunodeficiency virus to serve as a target for antibody-mediated neutralization: correlation of neutralization sensitivity, growth in macrophages, and decreased dependence on CD4.
J Virol2001,75:3903–3915. Apr.
57. Gentleman RC, Carey VJ, Bates DM, Bolstad B, Dettling M, Dudoit S, Ellis B, Gautier L, Ge Y, Gentry J,et al:Bioconductor: open software development for computational biology and bioinformatics.Genome Biol2004,5:R80.
doi:10.1186/1742-4690-9-60
Cite this article as:Bozeket al.:An expanded model of HIV cell entry phenotype based on multi-parameter single-cell data.Retrovirology2012
9:60.
Submit your next manuscript to BioMed Central and take full advantage of:
• Convenient online submission
• Thorough peer review
• No space constraints or color figure charges
• Immediate publication on acceptance
• Inclusion in PubMed, CAS, Scopus and Google Scholar
• Research which is freely available for redistribution