City, University of London Institutional Repository
Citation
:
Kulesza, T., Stumpf, S., Burnett, M., Wong, W., Riche, Y., Moore, T., Oberst, I.,
Shinsel, A. and McIntosh, K. (2010). Explanatory debugging: Supporting end-user debugging
of machine-learned programs. Proceedings - 2010 IEEE Symposium on Visual Languages
and Human-Centric Computing, VL/HCC 2010, pp. 41-48. doi: 10.1109/VLHCC.2010.15
This is the unspecified version of the paper.
This version of the publication may differ from the final published
version.
Permanent repository link:
http://openaccess.city.ac.uk/211/
Link to published version
:
http://dx.doi.org/10.1109/VLHCC.2010.15
Copyright and reuse:
City Research Online aims to make research
outputs of City, University of London available to a wider audience.
Copyright and Moral Rights remain with the author(s) and/or copyright
holders. URLs from City Research Online may be freely distributed and
linked to.
Explanatory Debugging:
Supporting End-User Debugging of Machine-Learned Programs
Todd Kulesza
1, Simone Stumpf
2, Margaret Burnett
1, Weng-Keen Wong
1,
Yann Riche
3,
Travis Moore
1,
Ian Oberst
1, Amber Shinsel
1, Kevin McIntosh
11
Oregon State University,
2City University London,
3Riche Design
{kuleszto, burnett, wong, moortrav, obersti, shinsela, mcintoke}@eecs.oregonstate.edu
[email protected], [email protected]
Abstract
Many machine-learning algorithms learn rules of behavior from individual end users, such as task-oriented desktop organizers and handwriting recognizers. These rules form a “program” that tells the computer what to do when future inputs arrive. Little research has explored how an end user can debug these programs when they make mistakes. We present our progress toward enabling end users to debug these learned programs via a Natural Programming methodology. We began with a formative study exploring how users reason about and correct a text-classification program. From the results, we derived and prototyped a concept based on “explanatory debugging”, then empirically evaluated it. Our results contribute methods for exposing a learned program’s logic to end users and for eliciting user corrections to improve the program’s predictions.
1. Introduction
Machine learning techniques are increasingly used in software adapted to end users’ own data, such as SPAM filters, recommender systems, and predictive text tools. These applications generate rules of behavior that are statistically derived via a particular user’s idiosyncratic patterns of behavior. We refer to these generated rules as machine-learned programs. While such programs can become fairly accurate, due to their statistical nature, they also remain fallible.
Who can fix a mistake made by a machine-learned program? The machine learning specialist who wrote the generator algorithm cannot fix every generated program for each individual user. Only one person is in a position to judge the correctness of the generated program: the very end user from whom the program has been learned.
End users, however, are given little power to correct a learned program’s errors. For example, SPAM filters confine user corrections to implicit approval and explicit disapproval. The user is permitted to scold the algorithm when it is wrong, but cannot tell the system
why it was wrong.
This situation partly exists because enabling end users to debug machine-learned programs is hard. Learned programs use complex logic and, as generated programs, have no “source code” to directly represent this logic. Nevertheless, end users are capable of providing descriptive corrections beyond the binary scoldings commonly available today [12, 19].
We present and evaluate a new Explanatory Debugging approach to harness this capability. Our approach supports debugging of learned programs by an iterative exchange of explanations between the program and the end user: the program explains how it arrived at its decisions, and the user explains where, in that decision-making process, it went wrong. We call this “explanatory” because it supports debugging via a
give and take of explanations relating to existing or
new machine learning features based on the user’s
natural descriptions of concepts. (Features are elements used by machine learning reasoning, e.g., words, punctuation, etc.)
1.1. Domain: Coding in qualitative research
Our domain is coding—labeling segments of a transcript with codes for analysis in qualitative research—a common task for social scientists and HCI researchers. Such codes are developed based on the study’s research questions, so a code set is rarely reused in its entirety. Research involving coding of subjects’ verbalizations is labor-intensive, requiring hours of painstaking work. If a computer could “learn” from early examples how to code the remainder of an experiment’s transcripts, the time saved could be enormous. We refer to this possibility as auto-coding.machine, the effort might exceed the time it takes to code everything by hand. Thus, the exchange between the program and the user must facilitate an accurate
mental model of the program’s logic and must enable
the user to explain how the coding should be done, so the learned program can benefit from these corrections.
2. Related work
There are systems that try to auto-code, e.g. the TagHelper system [5]. While TagHelper can be highly accurate with lots of training data, obtaining a large set of coded examples is both expensive (because manual coding is time-consuming), and unrealistic (because data sets in qualitative analysis are usually small).
For users to debug the learned program’s logic, they must be able to see it. Explanations of learned programs’ logic have taken a variety of forms, such as relating user actions and the resulting predictions [2], detailing why a program made a particular prediction [14], or explaining how an outcome resulted from user actions [8, 23, 24]. Much of the work in explaining probabilistic machine learning algorithms has focused on the naïve Bayes classifier [1, 11, 12] and, more generally, on linear additive classifiers [18], because explanations of these systems are relatively straightforward. More sophisticated but computationally expensive explanations exist for general Bayesian networks [13]. However, these explanations are limited to account for the learned program’s behavior and do not extend to accepting user corrections to adapt future behavior.
Debugging involves two-way communication; once the program explains its logic, there needs to be a way for the user to adjust it. Some research has begun to shed light on supporting end users in fixing simple learned programs [12, 19, 20]. Other systems explore building a program from the ground up by allowing users to specify the features it should employ [15]. Research has also aimed at supporting experienced users in debugging more complex ensemble [22], sequential [4] and non-sequential [3] classifiers. None of this work has explored how to successfully engage
end users in a two-way exchange in which they can
introduce new machine learning features to fix
complex learned logic.
3. Study #1: Explanations in debugging
Following the Natural Programming methodology [17], we began with a formative study (Study #1). Natural Programming is a user-centered methodology for designing programming languages and systems. It investigates users’ existing mental models (descriptions of existing concepts and processes) for a given task, and avoids influencing how participants think they are expected to do said task. The new system is designed to fit the users’ existing mental models.
Using this methodology, we investigated:
RQ1: Natural Explanations: How do end users
“naturally” describe how to fix machine-learned programs?
RQ2: Existing Mental Models: How do end users
think machine-learned programs make decisions?
RQ3: Mental Model Mutability: Can new
information change end users’ existing mental models of machine-learned programs?
3.1. Participants, procedure, and tasks
Nine Psychology and HCI students (five female, four male) participated in our study; none had any experience with machine learning. Five participants had coded transcripts before, and all were familiar with Excel (required to understand the transcripts’ content).
The pre-task introduction involved practicing coding to become familiar with the technique and our codes, and completing a background demographic questionnaire. For the main task, we asked participants to help improve the accuracy of a system by judging the correctness of each code, fix the code when necessary, and to explain their reasoning.
We gave participants coded transcripts on printouts which they could mark-up using pens, colored pencils, etc., as they preferred. We also asked participants to “think aloud” and recorded their verbalizations, prompting them if their remarks were unclear.
The first 30 minutes of the main task aimed at eliciting natural participant responses and probing their existing mental models (RQ1 and RQ2). Participants worked on coded transcripts without explanations, then answered how they believed the computer did make its decisions and what information it should use. The final 20 minutes aimed at determining how explanations might influence users’ existing mental models (RQ3). This involved a variant of the coded transcript with explanations, after which participants told us how they now believed the computer made its decisions.
3.2. Materials
The transcripts came from an unrelated study about debugging spreadsheet errors. Although we told our participants that a computer had coded these transcripts, they had been hand-coded by a researcher using four codes: Seeking Information, Information
Gained, Information Lost, and None. To elicit
participant corrections, we introduced errors by randomly changing 30% of the expert’s codes.
We used paper printouts instead of a software prototype to elicit participant corrections in any form participants deemed appropriate, thus avoiding a tool that would restrict their range of expression.
debugging by answering questions about program behavior, and was recently adapted to explain machine learning to end users [12, 14]. Each explanation included two reasons why the segment was classified as a particular code, plus two reasons each why it was
not classified as the other codes. The explanations used 10 types of features and sequential relationships that learning algorithms can use for classification.
(Sequential relationships are features derived from
nearby features, e.g., a question mark observed in segment #4 increases the probability of a certain code appearing in segment #5.) Our explanations drew on relationships within segments twice as frequently as relationships between segments, but distributed other feature types and relationships evenly.
3.3. Analysis methodology
Four researchers established an initial code set for analysis of the marked-up printouts and study transcripts, extending a code set used to research simpler machine learning approaches [19]. Two researchers iteratively coded small sections of a transcript, adjusting the code set to clarify application. Inter-coder reliability between the two researchers on the final code set (applied to a different, complete transcript) was calculated by the Jaccard index as 81%. Given this acceptable level of code robustness, the two researchers coded the transcripts and questionnaire data. Table 1 shows the final code set.
3.4. Results: How
should
the program reason?
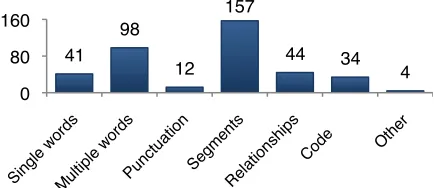
We first consider how participants explained how a learned program should reason (RQ1). As Figure 2 shows, before having seen the explanations, participants mainly discussed 1) single or multiple words and punctuation, and 2) entire segments of text. When talking about this information, participants were about three times as likely to mention its presence than its absence as a reason for applying a code. These information types hold three implications for enabling end-user debugging of learned programs.First, participants’ emphasis on entire segments suggests that learned programs need to reason about them as well. Second, although punctuation comments were few, they suggest that it cannot be carelessly removed when a learned program preprocesses data.
Third, although text classification algorithms tend to deal with individual words, participants talked more about word combinations (e.g., P6:“‘Why does’ is a
key phrase that should tip us off that they’re seeking
information”). This further motivates the need to pair
end user debugging with machine-learned intelligence: attending to all possible combinations of n consecutive words would introduce many irrelevant features to the program’s logic. Similarly, the algorithm designer cannot elicit relevant word combinations for each end user’s specific needs. Instead, we can allow end users to teach the program about the specific multi-word phrases it should attend to.
Relationships among different words or segments (e.g., P1: “So is this part a continuation of this?”) were used 44 times. An implication is that learned programs should support sequential relationships among data, but this is not done by many machine learning systems, including the naïve Bayes algorithm often used for text classifiers. In addition, sequential classifiers typically use relationships between adjacent
segments, whereas relationships suggested by end users may be of greater distance. There is a rich space of sequential relationships that could be used by the algorithm, but as in the multi-word case, it is infeasible for the program to reason about every possibility. Here again, end-user debugging is needed to explain to the machine which relationships matter.
[image:4.612.71.540.621.689.2]Finally, participants used the process of elimination 34 times, e.g. P2: “It’s really neither looking for info, it’s not losing info, they’re just looking at it so I’d go
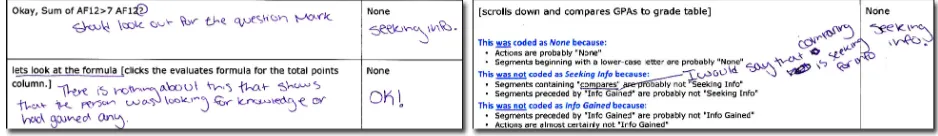
Figure 1: Paper prototypes without (left) and with (right) explanations.
Table 1: Code set for data analysis. Gray entries are parameters for the top-level codes (white). Code:
(Parameter) Participant talked about… Word/Punctuation:
(Single) …a single word!s presence/absence. (Multiple) …multiple words! presence/absence. (Punctuation) …punctuation!s presence/absence. (Adjustment) …a change in word(s) importance. (Process) …how features should be processed. Segment ...a segment as a whole.
Relationship:
(Word) …relationship between words. (Segment) …relationship between segments. (QA-Pair) …a question-answer segment pair. (Reference) …some other portion of the transcript. (Double code) …one statement spanning two segments. Code
with ‘None’.” This is evidence that in some cases participants want to guide the learned program to reason by exclusion, especially when dealing with incomplete or uncertain information.
3.5. Results: How
did
the program reason?
In this section, we consider how participants thought the computer did reason (RQ2), emphasizing how the program’s explanations were able to refine participant’s mental models about its logic (RQ3).As Table 2 shows, before explanations were provided, almost all participants thought the computer made decisions based on the presence of single keywords. At that point, only two participants talked about multiple keywords. Almost half of the participants said punctuation was also important.
Their before-explanation models were generally focused on word and punctuation presence. Nobody thought the computer used absence of words or punctuation, and only one participant thought it reasoned about relationships. Note that these mental models of how they thought the computer did make decisions were much simpler than how they thought the program should make decisions (Section 3.4).
After working with the explanations, however, most participants’ mental models included more complex types of reasoning. Seven participants now thought sequential relationships mattered, five thought word combinations were used, and five implied the machine’s reasoning was probabilistic, e.g. P1: “...Uses probabilities of certain codes occurring before and/or after other codes.”
A problem, however, arose with the participants’ perception of how probabilities worked. Their conceptualization was that probabilities are consistent
rules. This reflects a nuance of statistical reasoning
called the outcome approach: a tendency to interpret probabilities as binary, rather than the likelihood of a particular response [10]. Thus, while participants understood that the computer was using probabilities, they still expected it to obey binary rules, e.g. P6: “...and goes with the code with the strongest keyword or situation.”
That participants changed their mental models after learning new information contradicts findings by [23], whose participants’ mental models were persistent
(possibly because counter-evidence was not presented early enough for them to discard already entrenched mental models). In our study, presenting participants with explanations resulted in the integration of new details into their mental models. While no participant’s post-study mental model could be considered complete, the fact that they were mutable is a key prerequisite for incrementally explaining a program’s logic to end users, and is an underpinning for our Explanatory Debugging approach.
4. An Explanatory Debugging approach
As per the Natural Programming methodology, we used the results from Study #1 to design our Explanatory Debugging approach. Recall that the elements of Explanatory Debugging are an interactive
give and take of explanations relating to existing or
new machine learning features based on the user’s
natural descriptions of concepts. Our AutoCoder prototype instantiates this approach and supports all of the results from Study #1 except for the Code
Elimination feedback type, which we could not
implement in the time available. This section points out these ties to Study #1 as it describes the prototype.
[image:5.612.317.534.94.269.2]The basic coding and reasoning functionalities, which provide the context for Explanatory Debugging, are as follows. AutoCoder allows users to code segmented text transcripts (Figure 3 A) with the same predefined codes as in Study #1 (Figure 3 B). AutoCoder colors the codes to give users an overview of their coding activity. The navigation scrollbar then uses these colors to indicate each code’s occurrence over the whole transcript (Figure 3 C). The user can manually code any segment; in machine learning parlance, these are training data. After the user assigns three codes, the computer will predict codes for the remaining segments. Because sequential relationships between words and segments mattered in Study #1, our prototype uses a variant of the naïve Bayes algorithm
[image:5.612.80.297.586.680.2]Figure 2: Number of occurrences for each feedback type.
Table 2: Participants! mental models before (!) and
after (") explanations. Categories with <2 before and
after instances are omitted.
Su
bj
ec
t
Sin
gle
wor
ds
M
ult
ip
le
wor
ds
Pu
nct
uat
io
n
Re
lat
io
ns
hip
Pro
bab
ilit
ie
s
P1 ! ! " ! " "
P2 ! " ! "
P3 ! " " "
P4 ! " ! "
P5 ! " "
P6 ! " "
P7 ! " ! " "
P8 ! " ! " "
P9 " "
41" 98" 12"
157"
44" 34"
4" 0"
that supports sequential information. If the user changes a code, the change becomes additional training data and the learned program updates its predictions.
For this coding and reasoning context, we devised facilities to support Explanatory Debugging. These facilities, described next, allow (but do not require) a two-way exchange about why the program or user has made a coding decision.
Two debugging strategies used by professional programmers are inspecting code and evaluating program runtime data (testing); recent research shows that end users also heavily employ both [21]. To enable each strategy, our approach supports two-way exchanges about both “source code” and runtime outputs. Learned programs have no obvious source code for end users to look at, but there are learned “rules” that represent the logic the program follows. Prior research [6, 20] has shown that users want to understand this logic. Our approach supports exchanging explanations about such “source code” (program logic), and exchanging explanations about runtime data (program outputs).
4.1. Explanations about logic
Participants in Study #1 expressed fixes in a variety of forms, including single words, word combinations,
punctuation, segments, and relationships.
To explain the logic behind a user’s code assignment, the user can highlight single and consecutive words, plus punctuation (Figure 4 W4). These explanations can be complex, introducing features the learned program did not use before. Combinations of non-consecutive words in either the same or adjacent segments are allowed, modeling relationships between words and segments, e.g., “‘?’ in the preceding segment followed by ‘OK’ in this
segment often means this segment is ‘Info Gained’”.
System-generated explanations of AutoCoder’s logic are similar to the explanations in Study #1, which were inspired by the “Why” explanations in [12]. Why-oriented explanations have shown success in other studies about learned programs [14], and they improved the complexity of participant mental models in Study #1. Because Study #1 showed that participants had problems with the probabilistic nature of learned programs, we worded explanations to make clear that the logic is open to uncertainty.
AutoCoder shows the most influential features
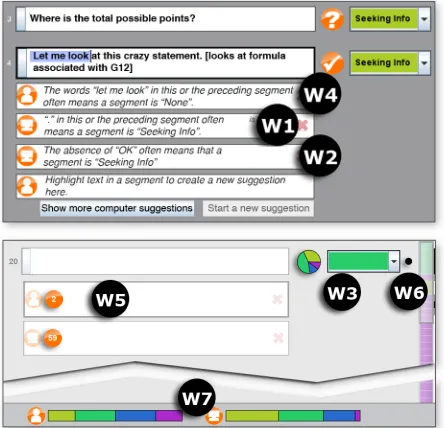
(Figure 4 W1) that governed each prediction, expandable to a full list ordered by influence. A computer icon identifies the explanation as being generated by the machine (W1), and a user icon identifies logic corrections the user entered (W4). User explanations are incorporated into the machine learning system as new features with high weight for predicting the user-specified code. The user can delete any logic that seems wrong.
Because Study #1 showed that participants did not realize that absence of features mattered to the program, the machine’s explanations cover absent features (Figure 4 W2), e.g. “The absence of ‘?’ often
means that a segment is ‘Info Gained’”. Expressing
how absent features affect the machine’s predictions to users has previously had mixed success [12, 19].
One logic rule may be relevant to many segments, so AutoCoder shows counts (Figure 4 W5) of how many segments each rule potentially affects (i.e., how many segments contain this suggestion’s features). This impact is also displayed graphically: when a user selects a logic rule, AutoCoder responds by highlighting segments affected by it.
4.2. Explanations about runtime outputs
Professional programmers use testing and debugging steppers to see the effects of their logic changes on program outputs. AutoCoder also shows runtime effects on logic changes users make.
[image:6.612.314.536.430.644.2]As soon as new data or rules are entered, the classifier outputs new predictions. To help users understand the runtime effects of their last action,
Figure 3: The basic AutoCoder prototype showing a series of segments (A), their corresponding codes (B),
and an overview of the transcript!s codes (C).
Figure 4: Widgets supporting debugging: Machine-generated Explanation (W1); Absence Explanation (W2); Prediction Confidence (W3); User-generated Suggestion (W4); Impact Count (W5); Change History Markers (W6);
[image:6.612.80.295.607.668.2]Change History Markers (Figure 4 W6) provide feedback on where changes in the program’s predictions occurred: a black dot is displayed adjacent to predictions that changed. As the user makes changes that do not alter the prediction for a segment, its change marker gradually fades away.
In addition to predictions themselves, learned programs generate data about their certainty in each prediction. Thus, we designed a Prediction Confidence (Figure 4 W3) widget. This is a pie graph showing the program’s probability of coding a given segment as each of the possible codes. A graph containing similarly sized wedges for each code (color) indicates the program cannot confidently determine which code to apply. This further supports users’ needs to understand the probabilistic nature of learned programs (from Study #1), as well as alerting users to predictions whose uncertainty suggests they may be incorrect.
Finally, the Popularity Bar (Figure 4 W7) addresses a problem with learned programs called class
imbalance, in which a classifier’s training data is
unrealistically biased toward a single class (in this case, a class imbalance results in the learned program predicting one code far more than it should). Our Popularity Bar represents proportions of each code amongst the user-coded and machine-predicted segments. The left bar represents the proportion of each code the user has manually applied to segments, while the right bar contrasts the proportion of codes the machine is predicting for remaining segments. We included this runtime information because prior work has shown users falling prey to class imbalance when they are not aware of it [12].
5. Study #2: How well did Explanatory
Debugging work?
In order to investigate how Explanatory Debugging supports end users fixing machine-learned programs, we conducted an empirical study exploring the following research questions:
RQ4: Effectiveness: Which kinds of information
(logic, runtime, or both) enabled end users to most effectively debug the learned program?
RQ5: User Attitudes: How did users react to the
availability of logic and runtime debugging information?
5.1. Procedure, participants, and materials
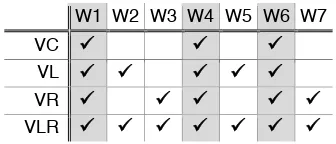
Our prototype supported debugging exchanges about logic and runtime information. To investigate these aspects independently, we developed four versions, VC (control), VL (logic), VR (runtime), and VLR (logic and runtime), each embedding specific widgets targeted at supporting Explanatory Debugging. The control version (VC) provided machine-generated explanations, user suggestions, and change history markers, as these were considered the bare essentialsnecessary to correct a learned program. Table 3 summarizes the widgets added to each version.
We recruited 74 participants (40 males, 34 females) from the local student population and nearby residents. None had experience with machine learning algorithms and only one had prior experience with coding.
A 30-minute hands-on tutorial taught participants the concept of coding, the codes, and the prototype’s functionalities. An hour-long main task followed. In the first half, participants coded a transcript with one version of the prototype; the final half consisted of a brief tutorial about a second version of the prototype and coding a second transcript. Versions and transcript orders were counter-balanced across participants.
After each part, participants answered free-form questions about how they believed the program made its decisions, plus Likert questions regarding the usefulness of each widget and participants’ perceived accuracy of the program. They also answered the NASA-TLX survey [7] to evaluate difficulties and their perceived success. Afterward, participants told us which of the prototypes they preferred.
5.2. Results: Debugging effectiveness
Did the participants’ debugging improve the learned program? We measured the accuracy of each learned program by calculating its F1 score. This evaluation metric uses precision (the count of correct classifications divided by the count of all classifications) and recall (the count of correct classifications divided by the count of classifications that should have been made). We can summarize the tradeoff between precision and recall as an F1 score (0 being worst and 1 being best), where F1=(2*precision*recall) / (precision+recall).
We compared the F1 scores of a baseline algorithm against an algorithm that took user corrections into account [16]. The baseline used participants’ code changes only, whereas our algorithm used both the code changes and participants’ detailed explanations.
[image:7.612.342.510.97.169.2]As Figure 5 suggests, participants debugging with VR improved the learned program significantly over the baseline, with a mean improvement of 18% and range of -33% to 204% (Wilcoxon rank-sum test, Z= -2.53, p<.02). Participants who used VC, VL or VLR did not succeed as well—many of their changes did more harm than good. Ultimately, participants using VC, VL, and VLR did not significantly change the
Table 3: The widgets included in each version of the AutoCoder prototype. Gray: common to all prototypes.
W1 W2 W3 W4 W5 W6 W7
VC ## ## ##
VL ## ## ## ## ##
VR ## ## ## ## ##
accuracy of their learned programs. VR’s leading position may be explained by participants’ attitudes about it, as we discuss next.
5.3. Results: Participant attitudes toward
Explanatory Debugging
Via participants’ questionnaire responses, we analyzed reactions to individual logic- and runtime-oriented widgets. As Figures 6 and 7 suggest, reactions relating to runtime information were more positive than reactions relating to logic information.
5.3.1. Logic-oriented explanations (VL, VLR)
Recall that the logic-oriented explanations depicted underlying logic, akin to a traditional program’s source code. Significantly more participants scored two logic-oriented widgets, W2 (Absence Explanations) and W5 (Impact Counts), as “unhelpful” than would be the case in a uniform distribution of attitude scores (Figure 6), (!2(1,70)=6.91, p<.009 and !2(1,63)=8.39, p<.004, respectively). As others [19] have reported, many participants had trouble understanding how absence of something played a role in the program’s decision-making. As one participant explained:
P10: “[Absence explanations were] very confusing and provided no help.”
Although not described as confusing, many participants did not recall or seem to care about the information presented by the Impact Counts:
P11: “The number in the circle means nothing to me.”
These results are consistent with participants’ preference for each prototype. Figure 7 (middle) illustrates that participants rarely preferred VL to other versions, and (right) that they expressed significantly more frustration, mental demand, and effort (from the NASA-TLX survey) when working with VL, as compared to other versions (!2(3,69)=7.92, p<.05).
However, participants’ responses improved when runtime-oriented information was included alongside the logic, as in VLR (Figure 7, middle). Thus, providing logic-oriented information alone was confusing and appeared to be of little use to participants, but its presence did not deter participants from continuing to find runtime information helpful.
5.3.2. Runtime-oriented explanations (VR, VLR)
As Figure 7 shows, participant reactions to runtime-oriented explanations were fairly positive. The two treatments explaining runtime information (VR and VLR) scored reasonably well in terms of preference and being less challenging to debug (Figure 7, middle). Attitudes toward the Popularity Bar were split but still higher than the logic-oriented widgets (Figure 6), and significantly more participants found the Confidence graphs helpful than would be expected in a uniform distribution (!2(1,59)=7.47, p<.007).
Interestingly, the runtime-oriented widgets may have influenced participants’ debugging behavior beyond our intent. Some participants in Study #1 commented on being uncertain how to code certain segments. The Prediction Confidence widget may have led participants to be over-confident in the program’s choices. As one participant phrased it:
P12: “If I was undecided, the pie would help me decide.”
Some participants, on the other hand, did not appreciate the computer’s help:
P13: “I felt like I HAD to agree with the program.”
Similarly, the Popularity Bar influenced some participants’ behavior in unintended ways:
P14: “I had an internal drive to want to teach the computer to be equal. I think this caused me to favor one answer over the next.”
Finally, given participants’ positive attitudes toward the runtime widgets, the success of VR over VLR is intriguing. Recall that VR had only a subset of the VLR widgets, yet participants working with VR performed better than those working with VLR. Possibly having so many widgets present in VLR confused participants into giving corrections that harmed the system’s accuracy. The remedy does not seem to be a straightforward “just use VR”, because VLR had advantages over VR (e.g., Figure 7, middle). A better solution may involve guiding participants
-5%" 20%"
VC "VL "VR "VLR "
0%" 20%" 40%"
Absence"
(W2)" Impact"(W5)" Confidence(W3)" " Popularity"(W7)"
0%" 20%" 40%"
VC
"
VL
"
VR
"
VLR
"
VC
"
VL
"
VR
"
VLR
"
VC
"
VL
"
VR
"
VLR
"
Figure 5: The average change in F1 scores after participants corrected their learned programs.
Figure 6: For the widgets we manipulated across versions, the percentage of participants who rated each
as “very unhelpful” (darkest) to “very helpful” (lightest).
Figure 7: The percentage of participants picking each version in which they felt most successful (left: more is better), they most preferred (middle: more is better), and
in which they felt most burdened and frustrated (right: less is better).
toward providing corrections that do more good than harm, a challenging open question.
6. Conclusion
This paper presented a new Explanatory Debugging approach for debugging machine-learned programs. Explanatory Debugging is based on the notion debugging is a two-way exchange of information, introducing new facts along the way and using descriptions both parties understand.
Explanatory Debugging supports exchanges about logic (to support debugging’s code inspection aspects) and about outputs (to support debugging’s testing aspects). Our prototype let users see why the computer produced the outputs it did and explain their corrections. These explanations can introduce new features, such as non-contiguous word combinations. As per Natural Programming, explanations’ form and content were derived from a formative study so as to use descriptions of concepts natural to the users.
Our support for runtime debugging was the most effective, but whether these results stem from the way our widgets represented information or the logic vs. runtime distinction requires further investigation. Results were mixed when logic and runtime were combined, and lowest when participants had the logic-oriented version alone. Participants were most effective using the runtime version, and held the most positive attitudes about this system and its widgets.
Most important, when using the Explanatory Debugging runtime-only variant, participants improved their programs significantly more than the current state of the art (changing labels). How to guide users toward the most helpful corrections remains an open question, but this paper illustrates that a substantive exchange between an end user and their learned program is viable for users and can lead to more accurate machine-learned programs.
Acknowledgments
We thank Forrest Bice, Valentina Grigoreanu, Joe Markgraf, Kyle Rector, and Rachel White for their help. This work was supported by NSF IIS-0803487.
References
1. Becker, B., Kohavi, R., and Sommerfield, D. Visualizing the simple Bayesian classifier. In Fayyad, U, Grinstein, G. and Wierse A. (Eds.) Information Visualization in Data
Mining and Knowledge Discovery, (2001), 237-249.
2. Billsus, D., Hilbert, D. and Maynes-Aminzade, D. Improving proactive information systems. Proc. IUI, ACM (2005), 159-166.
3. Chen, J. and Weld, D. Recovering from errors during programming by demonstration. Proc. IUI, ACM (2008), 159-168.
4. Culotta, A., Kristjansson, T., McCallum, A. and Viola, P. Corrective feedback and persistent learning for information extraction. Artificial Intelligence 170 (2006), 1101-1122.
5. Dönmez, P., Rosé, C., Stegmann, K., Weinberger, A. and Fischer, F. Supporting CSCL with automatic corpus analysis technology. Proc. CSCL, ACM (2005), 125-134.
6. Glass, A., McGuinness, D. and Wolverton, M. Toward establishing trust in adaptive agents. Proc. IUI, ACM (2008), 227-236.
7. Hart, S. and Staveland, L. Development of a NASA-TLX (Task load index): Results of empirical and theoretical research, Hancock, P. and Meshkati, N. (Eds.), Human
Mental Workload, (1988), 139-183.
8. Herlocker, J., Konstan, J. and Riedl, J. Explaining collaborative filtering recommendations. Proc. CSCW, ACM (2000), 241-250.
9. Ko, A. and Myers, B. Designing the Whyline: A debugging interface for asking questions about program failures. Proc. CHI, ACM (2004), 151-158.
10. Konold, C. Informal conceptions of probability. Cognition and Instruction 6(1) (1989), 59-98.
11. Kononenko, I. Inductive and bayesian learning in medical diagnosis. Applied Artificial Intelligence7, (1993), 317-337. 12. Kulesza, T., Wong, W.-K., Stumpf, S., Perona, S., White,
S., Burnett, M., Oberst, I. and Ko, A. Fixing the program my computer learned: Barriers for end users, challenges for the machine. Proc. IUI, ACM (2009), 187-196.
13. Lacave, C., and Diez, F. A review of explanation methods for Bayesian networks. Knowledge Engineering Review 17, 2, Cambridge University Press, (2002), 107-127.
14. Lim, B. Y., Dey, A. K., and Avrahami, D. 2009. Why and why not explanations improve the intelligibility of context-aware intelligent systems. Proc. CHI, ACM (2009), 2119-2128.
15. Maulsby, D., and Witten, I. Cima: an interactive concept learning system for end-user applications. Applied Artificial Intelligence 11, (1997), 653-671.
16. Obsert, I., Moore, T., Wong, W.-K., Kulesza, T., Stumpf, S., Riche, Y., Burnett, M. End-user feature engineering in the presence of class imbalance (Technical Report). Oregon State University, School of EECS (2009). http://hdl.handle.net/1957/13225.
17. Pane, J., Myers, B. More natural programming languages and environments, In H. Lieberman, F. Paterno, V. Wulf (Eds.) End User Development, Springer (2006), 31-50. 18. Poulin, B., Eisner, R., Szafron, D., Lu, P., Greiner, R.,
Wishart, D. S., Fyshe, A., Pearcy, B., MacDonnell, C., and Anvik, J. Visual explanation of evidence in additive classifiers. Proc. IAAI, (2006).
19. Stumpf, S., Rajaram, V., Li, L., Burnett, M., Dietterich, T., Sullivan, E., Drummond, R. and Herlocker, J. Toward harnessing user feedback for machine learning. Proc. IUI, ACM (2007), 82-91.
20. Stumpf, S., Sullivan, E., Fitzhenry, E., Oberst, I., Wong, W.-K. and Burnett, M. Integrating rich user feedback into intelligent user interfaces. Proc. IUI, ACM (2008), 50-59. 21. Subrahmaniyan, N., Beckwith, L., Grigoreanu, V., Burnett,
M., Wiedenbeck, S., Narayanan, V., Bucht, K., Drummond, R., and Fern, X. Testing vs. code inspection vs. what else?: male and female end users’ debugging strategies. Proc. CHI, ACM (2008), 617-626.
22. Talbot, J., Lee, B., Kapoor, A., and Tan, D. S. 2009. EnsembleMatrix: interactive visualization to support machine learning with multiple classifiers. Proc. CHI, ACM (2009). 1283-1292.
23. Tullio, J., Dey, A., Chalecki, J. and Fogarty, J. How it works: a field study of non-technical users interacting with an intelligent system. Proc. CHI, ACM (2007), 31-40.