Searching for nova shells around cataclysmic variables
D. I. Sahman,
1‹V. S. Dhillon,
1C. Knigge
2and T. R. Marsh
31Department of Physics and Astronomy, University of Sheffield, Sheffield S3 7RH, UK 2School of Physics and Astronomy, University of Southampton, Southampton SO17 1BJ, UK 3Department of Physics, University of Warwick, Coventry CV4 7AL, UK
Accepted 2015 May 16. Received 2015 May 15; in original form 2015 April 17
A B S T R A C T
We present the results of a search for nova shells around 101 cataclysmic variables (CVs), using Hαimages taken with the 4.2-m William Herschel Telescope (WHT) and the 2.5-m Isaac Newton Telescope Photometric HαSurvey of the Northern Galactic Plane (IPHAS). Both telescopes are located on La Palma. We concentrated our WHT search on nova-like variables, whilst our IPHAS search covered all CVs in the IPHAS footprint. We found one shell out of the 24 nova-like variables we examined. The newly discovered shell is around V1315 Aql and has a radius of ∼2.5 arcmin, indicative of a nova eruption approximately 120 yr ago. This result is consistent with the idea that the high mass-transfer rate exhibited by nova-like variables is due to enhanced irradiation of the secondary by the hot white dwarf following a recent nova eruption. The implications of our observations for the lifetime of the nova-like variable phase are discussed. We also examined four asynchronous polars, but found no new shells around any of them, so we are unable to confirm that a recent nova eruption is the cause of the asynchronicity in the white dwarf spin. We find tentative evidence of a faint shell around the dwarf nova V1363 Cyg. In addition, we find evidence for a light echo around the nova V2275 Cyg, which erupted in 2001, indicative of an earlier nova eruption∼300 yr ago, making V2275 Cyg a possible recurrent nova.
Key words: novae, cataclysmic variables.
1 I N T R O D U C T I O N
Cataclysmic variables (CVs) are close binary systems in which a white dwarf (WD) accretes material from a secondary star, via Roche lobe overflow (see Warner1995 for a review). CVs are classified observationally into three main sub-types – the novae, the dwarf novae (DNe) and the nova-like variables (NLs). Thenovae
are defined as systems in which only a single nova eruption has been observed. Nova eruptions have typical amplitudes of 10 mag and are believed to be due to the thermonuclear runaway of hydrogen-rich material accreted on to the surface of the WD. The DNe are defined as systems which undergo quasi-regular (on time-scales of weeks– months) outbursts of much smaller amplitude (typically 6 mag). Dwarf nova (DN) outbursts are believed to be due to instabilities in the accretion disc causing the sudden collapse of large quantities of material on to the WD. The NLs are the non-eruptive CVs, i.e. objects which have never been observed to show nova or DN outbursts. The absence of DN outbursts in NLs is believed to be due to their high mass-transfer rates, producing ionized accretion discs in which the disc-instability mechanism that causes outbursts
E-mail:[email protected]
is suppressed (Osaki1974). The mass-transfer rates in NLs are ˙M∼
10−8-10−9M
yr−1whereas DNe have rates of ˙
M∼10−10-10−11 Myr−1. Note that throughout this paper, when we refer to NLs we mean non-magnetic systems, i.e. we do not include in our definition systems that accrete via magnetic field lines, such as polars and intermediate polars.
Our understanding of CV evolution has made great strides in recent years (e.g. see Knigge2010; Knigge, Baraffe & Patterson 2011). For example, there is now strong evidence that the 2–3-h period gap in the orbital period distribution of CVs is indeed due to disrupted angular momentum loss (Patterson et al.2005), the first ‘period-bounce’ CVs, in which the secondary star has lost so much mass to the WD that it falls below the hydrogen – burning limit, have now been discovered (Littlefair et al.2008), and the predicted spike of systems at the period minimum has been revealed (G¨ansicke et al. 2009).
One of the remaining unsolved problems in CV evolution is as follows. How can the different types of CV coexist at the same orbital period? Theory predicts that all CVs evolve from longer to shorter orbital periods on time-scales of gigayears, and as they do so the mass-transfer rate also declines (e.g. see fig. 19 of Knigge et al. 2011). At periods longer than approximately 5 h, all CVs should have high mass-transfer rates and appear as NLs, whereas below
2015 The Authors
at University of Sheffield on July 1, 2015
http://mnras.oxfordjournals.org/
this period the lower mass-transfer rate allows the disc-instability mechanism to operate and all CVs should appear as DNe. This theoretical expectation, however, is in stark contrast to observations, which show that the fraction of NLs to DNe is actually highest at 3 h periods and then declines to longer periods (e.g. see fig. 18 of Knigge et al.2011).
It is possible that CVs cycle between NL and DN states on time-scales shorter than the gigayear evolutionary time-scale of the bi-nary, thereby explaining the coexistence of NLs and DNe at the same orbital period. Two mechanisms for such a cycle have been proposed. Both mechanisms invoke cyclical variation in the irradi-ation of the secondary, which in turn drives cyclical variirradi-ation of ˙M
with time-scales of the order of∼104–107yr.
The first idea is that there is an irradiation feedback mechanism. The flux from the WD illuminates the inner face of the secondary which flattens the temperature gradient in the photosphere, leading to an expansion in the radius of the secondary and an increase in ˙M
above the secular mean (see B¨uning & Ritter2004and references therein). The enhanced ˙M drives an increase in the radius of the secondary’s Roche lobe. Eventually the expansion of the secondary star cannot keep pace with the Roche lobe expansion, leading to a lower ˙M, and hence a reduction in the irradiating flux. Consequently, the secondary begins to shrink and the feedback mechanism operates in reverse as the mass-transfer rate reduces. B¨uning & Ritter (2004) found that this mechanism could produce limit cycles in ˙Mof the appropriate time-scales (see fig. 5 of Knigge et al.2011), causing CVs to cycle between DN and NL states. However, their models show that systems just above the period gap are actually stable and do not undergo cycles. Hence, although this model explains why some NLs and DNe may coexist at the same orbital period, it does not explain why the irradiation-driven feedback mechanism would make the NL fraction highest around 3 h and decline towards longer periods.
The second hypothesis for variable ˙Mis a nova-induced cycle. Some fraction of the energy released in the nova event will heat up the WD, leading to increased irradiation and subsequent bloating of the secondary. Following the nova event, the system would have a high ˙M and appear as a NL. As the WD cools, the radius of the secondary would return to its secular value, and hence ˙Mwill reduce and the system changes to a DN. In this model, therefore, CVs are expected to cycle between nova, NL and DN states, on time-scales of 104–105yr (see Shara et al.1986), thereby explaining the coexistence of these CV sub-types at the same orbital period. Like the irradiation feedback mechanism, however, this nova cycle model does not explain why the NL fraction is highest around 3 h and declines towards longer periods.
The cyclical evolution of CVs through nova, NL and DN phases recently received observational support from the discovery that BK Lyn appears to have evolved through all three phases since its likely nova outburst in the yearAD101 (Patterson et al.2013). A second piece of evidence has come from the discovery of nova shells around the DNe Z Cam and AT Cnc (Shara et al.2007,2012b), verifying that they must have passed through an earlier nova phase. A more obvious place than DNe to find nova shells is actually around NLs, as the nova-induced cycle theory suggests that the high ˙M in NLs could be due to a recent nova eruption. Finding shells around the highest accretion-rate NLs would lend further support to the exis-tence of nova-induced cycles and hence help explain why systems with different ˙Mare found at the same orbital period.
In this paper we present the results of an Hαimaging survey of the fields surrounding a sample of 101 CVs, 24 of them NLs, with the aim of identifying nova shells around the central binary.
2 O B S E RVAT I O N S A N D DATA R E D U C T I O N
2.1 William Herschel Telescope
2.1.1 Search strategy
The choices of telescope aperture and field of view for this project were dictated by the expected brightness and radii of the nova shells around CVs. Recombination theory tells us that the Hα
luminosity per unit volume of a nova shell is proportional to density squared, and hence the total luminosity of the shell is inversely proportional to volume. If we assume that the shell ex-pands at a constant velocity, then its volume increases as the cube of time. Therefore, the luminosity is inversely proportional to time cubed, and the surface brightness decreases as time to the fifth power. This expectation has been empirically confirmed by Downes, Duerbeck & Delahodde (2001) who found that the H α surface brightness of nova shells diminishes as t−4.8, al-though novae with strong shock interactions between the ejecta and any pre-existing circumstellar material, e.g. GK Per (Shara et al. 2012a) and T Pyx (Shara et al. 1989), do not fit this relationship.
To estimate how bright the shells around NLs might be, we used as a guide the archetypal old nova DQ Her (Nova Her 1934) which has a clearly visible shell (Slavin, O’Brien & Dunlop1995). Its shell had a brightness of 1.01×10⁻¹⁵erg s−1cm−2arcsec−2and a radius of 8 arcsec in 1982 May, 47.5 yr after its nova eruption (Ferland et al.1984). This implies that 100 yr after outburst it will fade to 2.44×10⁻¹⁷erg s−1cm−2arcsec−2, by which time its radius will have doubled to 16 arcsec, and at 200 yr after outburst it will fade to 7.63×10⁻¹⁹erg s−1cm−2arcsec−2, and its radius will have doubled again to 32 arcsec. We can use these estimates to determine our observing strategy and to establish the instrumental set-up that is required.
NLs have apparent magnitudes of ∼15, on average. Novae brighten by ∼10 mag during eruption, implying that most NLs when in outburst would have been just visible to the naked eye. Given the much increased rate of nova detection in the last 100 yr, it is very unlikely that such eruptions would have been missed if they had occurred within the last∼100 yr or so. We thus expect to have to detect shells around NLs which are at least 100 yr old; any which erupted more recently than this would likely have been detected and would now be classified as a nova. Assuming the shell of DQ Her is representative, a 100-yr old shell would be at least 16 arcsec in radius and no brighter than 2.44×10⁻¹⁷erg s−1cm−2arcsec−2. Hence to detect such shells we require deep images with a rela-tively modest field of view, which led us to use the Auxiliary Port on the 4.2-m William Herschel Telescope (WHT) on La Palma (see Section 2.1.2).
To estimate the age of the faintest shell we might detect with this set-up, we simulated the images we would obtain from a spherical nova shell in an 1800 s Hα-exposure. The simulation showed that a shell with luminosity comparable to the shell of DQ Her would become too faint to detect in an image at∼180 yr after outburst. For approximately circular, small shells that are centred on the binary, this detection threshold can be pushed fainter by computing the mean radial profile of the central object and inspecting the wings for evidence of a shell (see Gill & O’Brien1998). The DQ Her shell would be apparent in the radial profile up to 220 yr after outburst. Assuming DQ Her is representative, this means that we would be able to detect shells around NLs from nova eruptions up to a maximum of∼220 yr ago using our proposed set-up on the WHT.
at University of Sheffield on July 1, 2015
http://mnras.oxfordjournals.org/
2.1.2 Observations
The observations were taken on the nights of 1997 October 24– 26. We used the 1024×1024 pixels TEK5 CCD chip mounted on the Auxiliary Port1 at the Cassegrain focus of the WHT to image the fields around our target NLs. This set-up gave a plate scale of 0.11 arcsec per pixel and hence a field size of 113 arcsec×113 arcsec. Hαis one of the strongest features in the spectra of nova shells, with typical velocity widths of up to 2000 km s−1(e.g. Warner1995). In order to maximize the detec-tion of light from the shell and minimize the contribudetec-tion of sky, we therefore used a narrow-band [55Å Full width half maximum (FWHM)=2500 km s−1] interference filter centred on the rest wavelength of Hα(ING filter number 612). Note that this filter also includes a contribution from [NII] 6584 Å emission, which may dominate the spectra of nova shells with strong shock interaction of the ejecta with any pre-existing circumstellar medium, e.g. T Pyx (Shara et al.1989).
As we were planning to compare the radial profiles of the target stars with field stars, we had to ensure that we did not saturate the target stars. Hence the CCD chip was used unbinned and in quick readout mode, in order to decrease dead-time, at the expense of a negligible decrease in signal to noise (thanks to the fact that our observations were always sky-limited). The observing conditions were excellent throughout the run; the sky was always photometric, there was no evidence of dust and the seeing was usually sub-arcsecond, with an occasional excursion up to 1.5–2 arcsec.
2.1.3 Target selection
To ensure we only targeted relatively well-studied systems with reli-able CV classifications, we made our selection from the catalogue of Ritter & Kolb (2003, hereafterRKcatalogue)3. We selected a total of 31 CVs, predominantly NLs, and searched for nova shells around them. To test our set-up we included three systems with known nova shells, BT Mon, DQ Her and GK Per. We also took the opportunity to observe two asynchronous polars, which are CVs with magnetic WDs in which the spin period of the WD is not synchronized with the orbital period (Warner1983). The asynchronicity is believed to be due to a recent nova event, as shown by the system V1500 Cyg which had a nova eruption in 1975 (Stockman, Schmidt & Lamb 1988). The two asynchronous polars we observed with the WHT were V1432 Aql and BY Cam. We also included three other non-NL systems, PQ Gem, which is an intermediate polar, IP Peg which is a DN and AY Psc which is a Z Cam-type DN, which were favourably positioned during our observing run.
A full list of the 31 objects observed with the WHT and a journal of observations is given in Table1. In summary, the targets com-prised 3 old novae with known shells, 1 old nova without a known shell (V Per), 2 asynchronous polars, 1 intermediate polar, 22 NLs and 2 DNe. In Fig.1we show the orbital period distribution of all the systems we observed with the WHT compared to the total number of systems in theRKcatalogue. We deliberately selected a substantial number of the systems in the 3–4 h orbital period range, which is where most NLs appear, as shown in fig. 18 of Knigge et al. (2011).
1http://www.ing.iac.es/astronomy/observing/manuals/html_manuals/
wht_instr/pfip/prime3_http://www.html
2http://catserver.ing.iac.es/filter/
3http://www.mpa-garching.mpg.de/RKcat/
2.1.4 Data reduction
The images were debiased using the median level of the overscan strip and flat-fielded using normalized twilight sky flats. Where we had taken multiple images of targets, these were combined to improve the signal-to-noise ratio. Sky subtraction was performed by subtracting the median level determined from two blank sky areas of size 100×100 pixels. Each frame suffered from significant vignetting in the corners due to the circular filter holder, which was not fully corrected by the flat-field. The corners of each image were hence removed by setting a series of 50×50 pixel blocks to a fixed value, so that they appear white in the final images shown in Appendix A. Pixels affected by cosmic rays were set to the average value of surrounding pixels. All processing was performed using theKAPPAandFIGAROpackages in theSTARLINK4suite of programs.
2.2 Isaac Newton Telescope
2.2.1 Observations
In support of our WHT observations, we also examined known CVs in the 2.5-m Isaac Newton Telescope (INT) Photometric HαSurvey of the Northern Galactic Plane (IPHAS). IPHAS is an 1800 deg2 survey of the northern Milky Way spanning the Galactic latitude range−5◦<b<+5◦and Galactic longitude range 29◦<l<215◦. Three filters were used, Hα, Sloanrand Sloani, reaching down tor≈20 (10σ). The survey took place between 2003 and 2008. The survey used the INT Wide Field Camera (WFC) which of-fers a pixel scale of 0.33 arcsec per pixel and a field of view of ∼34 arcmin×34 arcmin. Exposure times were initially set at 120 s (Hα) and 10 s (r andi) but evaluation of the early data led to an increase in ther-band exposure time to 30 s – for full details of the observations and data reduction see Drew et al. (2005) and Barentsen et al. (2014).
2.2.2 Target selection
We cross-matched theRKcatalogue to the IPHAS footprint. There were 74 matches of CVs with the classification N, NL or DN (indi-cating nova, nova-like variable and dwarf nova, respectively). Each matching IPHAS field was reviewed visually to determine whether any nebulosity was apparent around the target CVs. Due to the sig-nificant Hαnebulosity in the Galactic plane, we did not attempt to compute radial profiles for the IPHAS targets.
The 74 systems we examined in IPHAS are listed in Table2. The targets comprised 2 asynchronous polars, 10 polars and intermediate polars, 5 NLs, 34 DNe, 3 old novae with known shells and 20 old novae without known shells. Three of the NLs, V1315 Aql, V363 Aur and V751 Cyg, were also part of our WHT sample, as was BT Mon, an old nova with a known shell.
3 R E S U LT S
3.1 WHT images and radial profiles
In order to detect shells in the WHT images, we adopted two strate-gies. First, we visually examined each image to determine if a shell is visible. This technique would reveal wide shells with diameters of more than a few arcseconds. Secondly, we calculated the radial
4http://starlink.eao.hawaii.edu/starlink
at University of Sheffield on July 1, 2015
http://mnras.oxfordjournals.org/
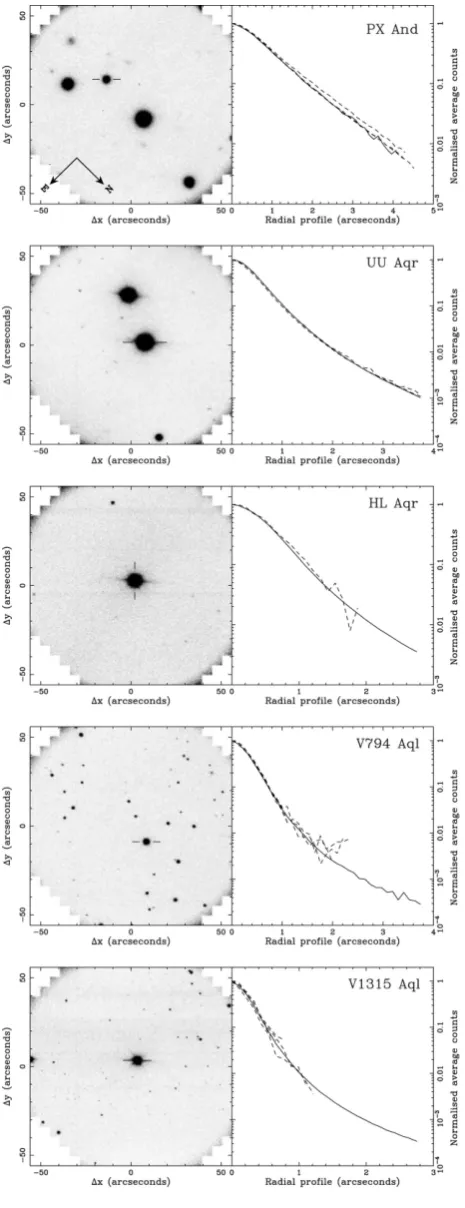
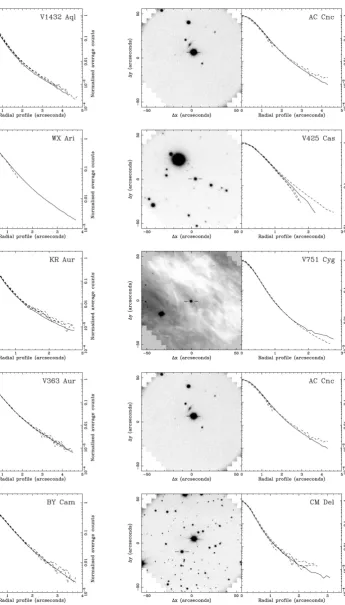
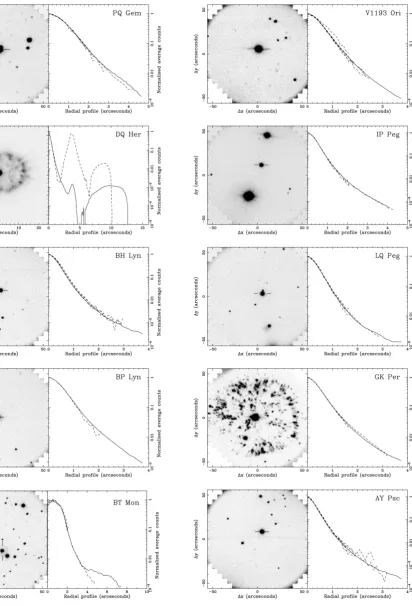
Table 1. Journal of WHT observations. The classifications of the CVs have been taken from theRKcatalogue. The date refers to the start time of the first exposure. All shells detected in our WHT observations are shown in bold and discussed in Section 3.1. Note that theRKcatalogue classifications for novae are N, Na, Nb.
Object Classification Orbital Date UTC UTC Number of Total exposure Visible
period (h) start end exposures time (s) shell?
PX And NL SW NS SH 3.51 25-10-97 00:06 01:11 2 3600 N
UU Aqr NL UX SW SH 3.93 25-10-97 22:42 23:46 3 3300 N
HL Aqr NL UX SW 3.25 27-10-97 00:13 00:54 2 2400 N
V794 Aql NL VY 3.68 26-10-97 21:17 21:58 2 2400 N
V1315 Aql NL UX SW 3.35 26-10-97 19:32 20:15 4 2400 Na
V1432 Aql NL AM AS 3.37 25-10-97 19:59 21:01 2 3600 N
WX Ari NL UX SW 3.34 25-10-97 02:42 03:44 2 3600 N
KR Aur NL VY NS 3.91 26-10-97 03:50 04:10 1 1200 N
V363 Aur NL UX SW 7.71 25-10-97 05:09 06:10 2 3600 N
BY Cam NL AM AS 3.36 25-10-97 04:00 05:01 2 3600 N
AC Cnc NL UX SW 7.21 27-10-97 03:31 04:12 2 2400 N
V425 Cas NL VY 3.59 24-10-97 22:29 22:37 2 200 N
V751 Cyg bVY SW? NS SS 3.47 24-10-97 22:07 22:27 1 1200 N
V1776 Cyg NL UX SW 3.95 25-10-97 21:31 22:32 2 3600 N
CM Del NL UX VY? 3.89 26-10-97 20:22 21:05 4 2400 N
PQ Gem NL IP 5.19 27-10-97 02:41 03:22 2 2400 N
DQ Her Na DQ 4.65 25-10-97 19:31 19:51 1 1200 Y
BH Lyn NL SW SH NS 3.74 26-10-97 04:24 05:05 2 2400 N
BP Lyn NL UX SW 3.67 27-10-97 04:21 05:02 2 2400 N
BT Mon Na SW 8.01 26-10-97 06:12 06:43 2 1800 Y
BT Mon Na SW 8.01 27-10-97 06:02 06:32 1 1800 Y
V1193 Ori NL UX SW? 3.96 26-10-97 01:05 02:38 3 5400 N
IP Peg DN UG 3.80 25-10-97 21:08 21:19 1 621 N
LQ Peg NL VY SH NS 3.22 26-10-97 22:37 23:18 2 2400 N
V Per Na NL SW? 2.57 27-10-97 01:06 01:48 2 2400 N
GK Per Na DN IP 47.92 25-10-97 06:14 06:34 1 1200 Y
AY Psc DN ZC NS 5.21 25-10-97 23:51 00:53 2 3600 N
VY Scl NL VY 3.98 24-10-97 23:22 00:03 2 2400 N
VZ Scl NL VY SW 3.47 24-10-97 22:47 23:39 2 3000 N
SW Sex NL UX SW 3.24 26-10-97 05:15 05:56 2 2400 N
RW Tri NL UX SW 5.57 25-10-97 01:29 02:30 2 3600 N
DW UMa NL SW SH NS 3.28 27-10-97 05:09 05:50 2 2400 N
Notes.aWe detected a shell around V1315 Aql with the INT, not the WHT – see Section 3.2.5. bThis system is an NL.
Figure 1. Orbital period distribution of the systems we observed with the WHT (hatched) compared to the distribution of all the CVs in theRK
catalogue. The left-hand dotted line indicates the period minimum and the central and right-hand dotted lines show the period gap taken from Knigge et al. (2011).
profile of each CV and compared it to a number of field stars in the same image. Any nebulosity around the CV due to a nova shell would cause the radial profile of the CV to lie above the average profile of the field stars (for example, see the radial profile of BT Mon in Fig.A4). This technique can reveal shells with diameters of less than a few arcseconds, and was successfully used by Gill & O’Brien (1998) to discover four new nova shells. A key assumption in this technique is that the point spread function (PSF) is uniform across the WHT chip. Fig.2shows the PSFs for five field stars (arrowed) in the image of V Per. The PSFs show identical radial profiles irrespective of field position, giving confidence that the PSFs are uniform across the field of view of the CCD, as expected. The centroids of the stars were first measured by fitting a two-dimensional Gaussian. The radial profiles were then generated by calculating the radial distance of each pixel from the centroid, and then averaging the fluxes of the pixels falling into bins of increasing radial distance from the centroid. The radial profiles were then normalized to unity, and plotted from the centre of the star until the flux reached 1σabove the mean background flux.
In Appendix A, we show the images and radial profiles for all of the objects that were observed with the WHT. As expected, the images for the three old novae with previously known shells (BT Mon, DQ Her, GK Per) clearly show a shell and each is discussed
at University of Sheffield on July 1, 2015
http://mnras.oxfordjournals.org/
[image:4.595.45.283.500.676.2]Table 2. List of CVs examined in the IPHAS data base. The classifications of the CVs have been taken from theRK
catalogue. Note that theRKcatalogue classifications for novae are N, Na, Nb. All shells detected in IPHAS are shown in bold and are discussed in Section 3.2.
Object Classification Orbital Visible Object Classification Orbital Visible
period (h) shell? period (h) shell?
CI Aql Nr 14.83 N V2468 Cyg Na 3.49 N
KX Aql DN SU 1.45 N V2491 Cyg Na 2.56 N
V368 Aql Na 16.57 N V446 Her Na DN 4.97 N
V603 Aql Na SH NS 3.32 N CP Lac Na SW? 3.48 N
V1315 Aql NL UX SW 3 Ya DI Lac Na 13.05 N
V1425 Aql Na NL? IP? 6.14 N BT Mon Na SW 8 Y
V1493 Aql Na 3.74 N CW Mon DN UP IP? 4.24 N
V1494 Aql Na 3.23 N V902 Mon NL IP 8.16 N
FS Aur DN UG IP PW? 1.43 N V959 Mon N 7.10 N
HV Aur DN SU 1.98 N CZ Ori DN UG 5.25 N
T Aur Nb 4 Y V344 Ori DN ZCb 5.62 N
QZ Aur Na 8.58 N FO Per DN UG? ZC?b 4.13 N
V363 Aur NL UX SW 7.71 N FY Per NL VY 6.20 N
AF Cam DN UG 7.78 N TZ Per DN ZC 6.31 N
FT Cam DN SU? 1.80 N UV Per DN SU 1.56 N
V705 Cas Na 5.47 N V Per N NL SW? 2.57 N
V709 Cas NL IP 5.33 N WY Sge N DN? SW? 3.69 N
V1033 Cas NL IP 4.03 N DO Vul DN SU 1.38 N
HT Cas DN SU 1.77 N QQ Vul NL AM 3.71 N
KP Cas DN SU 1.95 N V405 Vul DN SU 2.71 N
EM Cyg DN ZC 6.98 N V458 Vul Na 1 Y
EY Cyg DN UG SH? 1.10 N V498 Vul DN SU WZ 1.41 N
V337 Cyg DN SU 1.64 N GD 552 DN? WZ? 1.71 N
V503 Cyg DN SU NS 1.87 N Lanning 420 DN SU 1.45 N
V516 Cyg DN UG 4.11 N J0130+6221 DN? 3.12 N
V550 Cyg DN SU 1.62 N J0345+5335 CV DN? 7.53 N
V751 Cyg cVY SW? NS SS 3.47 N J0506+3547 DN SU 1.62 N
V1251 Cyg DN SU WZ 1.77 N J0518+2941 NL? 5.72 N
V1316 Cyg DN SU 1.78 N J0524+4244 NL AM AS 2.62 N
V1363 Cyg DN ZC?b 2 Y? J0619+1926 DN SU WZ 1.34 N
V1454 Cyg DN SU 1.36 N J1853-0128 NL IP n/a N
V1500 Cyg Na NL AM AS 3 Y J1915+0719 DN SU WZ 1.37 N
V2274 Cyg Na 7.20 N J1926+1322 NL IP 4.58 N
V2275 Cyg Na IP? 7 Y? J1953+1859 DN SU? 1.44 N
V2306 Cyg NL IP 4.35 N J2133+5107 NL IP 7.14 N
V2362 Cyg Na 1.58 N J2138+5544 NL IP n/a N
V2467 Cyg Na NL IP? 3.83 N J2250+5731 NL AM 2.90 N
Notes.aWe confirmed the detection of a shell around V1315 Aql with additional INT observations – see Section 3.2.5. bWhilst these objects are shown as possible Z Cam systems in theRKcatalogue, Simonsen et al. (2014) found that they do not exhibit the standstills necessary for this classification and that they are actually normal DNe.
cThis system is an NL.
Figure 2. Left: WHT image of V Per (star number 1). Right: PSFs for the five arrowed stars showing the uniformity across the WHT chip. Each numbered star has been plotted as follows: 1 – solid line; 2 – dashed; 3 – dot–dashed; 4 – dotted; 5 – triple-dot–dashed. The orientation of the image is the same as that shown in Fig.3.
briefly below. There are no visible shells in the images of the re-maining objects, nor do any of the radial profiles differ significantly from the field stars.
3.1.1 BT Mon
The shell around BT Mon (Nova Mon 1939) was discovered spec-troscopically by Marsh, Oke & Wade (1983). BT Mon is a high-inclination system and the system parameters were derived by Smith, Dhillon & Marsh (1998). The first image of the shell was reported by Duerbeck (1987), who found it to be an incomplete clumpy, slightly elliptical ring with approximate dimensions of 11 arcsec ×9 arcsec and the major axis pointing in the NW–SE direction.
Our image and radial profile of BT Mon is shown in Fig.A4. The lower-right quadrant was not used to calculate the radial profile
at University of Sheffield on July 1, 2015
http://mnras.oxfordjournals.org/
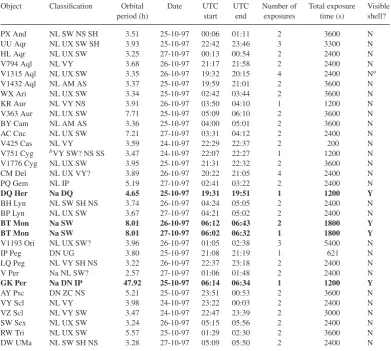
[image:5.595.47.287.561.674.2]Figure 3. Enlarged image of the BT Mon nova shell. Note that the second star to the lower right is an unassociated foreground/background star.
in order to remove the flux from the nearby star. The radial profile of BT Mon clearly deviates from the profile of the field stars, from approximately 4 arcsec outwards. This is due to the presence of the shell and gives assurance that our technique for identifying shells is valid.
In Fig.3we show an enlarged version of our image of the BT Mon shell. We estimate the shell diameter to be 13 arcsec±1 arcsec. As-suming a constant shell expansion velocity of 1800±300 km s−1 and a distance of 1.8±0.1 kpc as derived by Marsh et al. (1983), together with the date of the nova as 1939.7, gives an expected di-ameter of 12±3 arcsec at the time of our observations, in agreement with our measured value.
3.1.2 DQ Her
DQ Her (Nova 1934) is an intermediate polar with system parame-ters derived by Horne, Welsh & Wade (1993). The nova shell (see Fig.A4) is a prolate ellipsoid with a slightly pinched central ring. Vaytet, O’Brien & Rushton (2007) used our WHT image of DQ Her to estimate the angular size and hence distance of the system. They measured the angular size of the major and minor axes to be
a=25.31±0.44 arcsec andb=18.70±0.44 arcsec. Assuming a constant expansion velocity of 370±14 km s−1, they derived a distance ofd=525±28 pc.
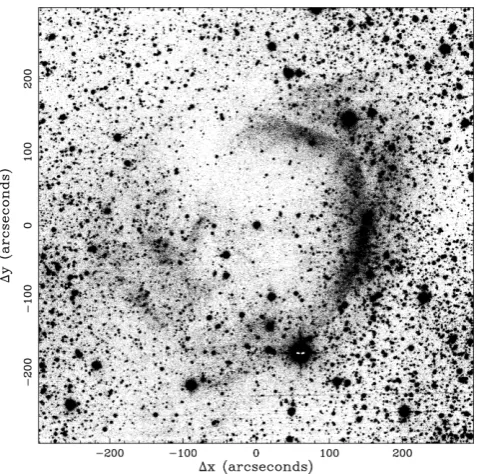
3.1.3 GK Per
The nova GK Per (1901) is the archetypal nova remnant and has been extensively studied (see Shara et al.2012afor a review). The shell is boxy in shape, of size approximately 100 arcsec×90 arcsec and exhibits clumpy knots (see Fig.A5). Recently, Liimets et al. (2012) derived a three-dimensional model of the nova shell in GK Per, and determined the proper motion and radial velocities of more than 200 knots in the ejecta. The knots have a wide range of velocities (600– 1000 km s−1) and have suffered only modest deceleration. Shara
et al. (2012a) usedHSTimages from 1995 and 1997 to resolve over 1000 filamentary structures in the ejecta. They also investigated a jet-like feature, first discovered by Anupama & Prabhu (1993), which they suggest could be the shock interaction of a collimated flow with the ISM, probably originating from the accretion disc. The jet extends some 2.7 arcmin to the NW, which is larger than the field of view of our image. We examined our image of GK Per but could not find any evidence of the jet-like feature on smaller spatial scales, most probably due to the lower signal-to-noise ratio of our image.
3.2 IPHAS images
We visually examined the IPHAS images for evidence of nova shells. Table2lists all of the objects we examined, and indicates whether a shell is visible. The short exposure times of the Hα
images (120 s) means that only bright, nearby shells are likely to be visible. We found three old novae with shells that are visible in the IPHAS footprint: T Aur (Nova Aurigae 1891), V458 Vul (Nova Vul 2007 No. 1) and V1500 Cyg (Nova Cygni 1975), all of which are well-studied systems. We briefly review these objects below. We found no definite detections of shells around any other IPHAS targets with the exception of two systems, V1363 Cyg and V1315 Aql, as discussed below. We did discover a nebula around V2275 Cyg, which is too large to be associated with its nova event in 2001. This nebula may be a light echo due either to scattering off, or flash ionization of, a pre-existing nebula. We also discuss this object further below.
3.2.1 T Aur
The IPHAS Hαimage of T Aur is shown in Fig.4(a). The shell is clearly discernible in the image giving us confidence that it is possible to see nova shells in the IPHAS images. The shell structure has been likened to that of DQ Her, although T Aur is some 43 yr older (Slavin et al.1995). The shell is elliptical in shape, with major and minor axes of length∼30 arcsec×20 arcsec, respectively.
3.2.2 V458 Vul
The Hαimage of V458 Vul is shown in Fig.4(b). The shell has major and minor axes of≈30 arcsec×20 arcsec. The image was taken in 2007 June, two months before the system underwent a nova explosion in 2007 August. The shell is actually a pre-existing planetary nebula ejected some 14 000 yr ago (Wesson et al.2008). The central binary is most likely a post-double common-envelope binary comprised of a WD of mass∼1.0 Mand a post-Asymptotic giant branch (AGB) secondary of mass∼0.6 M(Rodr´ıguez-Gil et al.2010).
3.2.3 V1500 Cyg
V1500 Cyg (Nova Cygni 1975) is a well-studied nova and is the archetypal asynchronous polar (Wade et al.1991). The nova shell was first imaged four years after outburst by Becker & Duerbeck (1980), who measured the radius at ∼1.0 arcsec. Subsequently, Wade et al. (1991) presented an image taken in 1987 by which time the shell had expanded to∼1.9 arcsec, giving an expansion rate of 0.16 arcsec per annum, and Slavin et al. (1995) presented an image taken in 1993 showing a nebular radius of∼3 arcsec. The IPHAS Hαimage taken in 2004 is shown in Fig.4(c). The nova shell is extremely faint and has a radius of∼5 arcsec, still consistent
at University of Sheffield on July 1, 2015
http://mnras.oxfordjournals.org/
Figure 4. IPHAS Hαand Hα−rimages. In all images, north is up, east is left. with the nebular expansion rate of∼0.16 arcsec per annum given
by Wade et al. (1991).
3.2.4 V1363 Cyg
In Fig.4(d) we show the IPHAS Hαimage of the DN V1363 Cyg. The Hα image is heavily populated with field stars making the surrounding nebula difficult to discern. Hence we show the Hα−
r image in Fig.4(e), which effectively removes most of the flux from the field stars. The field is extremely crowded and the object lies close to a ribbon of gas, making the unambiguous detection of a
nova shell extremely difficult. However, there is a faint egg-shaped shell of emission of≈2 arcmin diameter, approximately centred on the CV.
3.2.5 V1315 Aql
Figs4(f) and (g) show the IPHAS Hαand Hα−rimages of V1315 Aql. There is a faint shell of ≈2.5 arcmin radius approximately centred on the CV, with more pronounced emission towards the West. We also imaged this object with the WHT. However, the small field of view of our WHT image (see Fig.A1) is not large enough to confirm the possible detection of this shell.
at University of Sheffield on July 1, 2015
http://mnras.oxfordjournals.org/
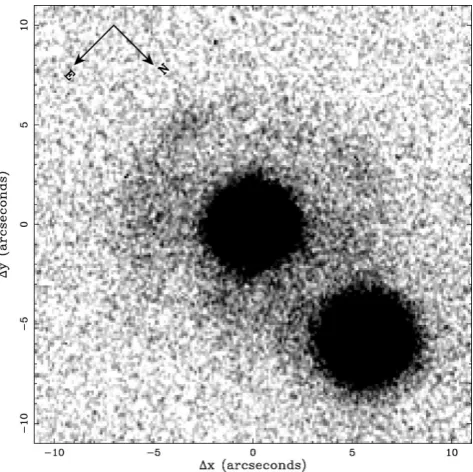
Figure 5. Hαimage of the nebula surrounding V1315 Aql. The image is 10 arcmin×10 arcmin, with north up and east to the left. V1315 Aql is the bright star located at the centre of the image.
In order to confirm the detection of the shell around V1315 Aql, we took a further 13 exposures of V1315 Aql on 2014 August 2 with the WFC on the INT with a total exposure time of 7200 s in Hα. The stacked Hα image is shown in Fig.5. The image clearly shows a shell surrounding the central system, with a radius of∼3 arcsec, confirming the proposed detection in Fig.4. Assuming a shell expansion rate of 2000 km s−1and a distance of 356+65
−80pc (Ak et al. 2007), this means that V1315 Aql experienced a nova eruption∼120 yr ago.
We examined the historic records of nova sightings compiled by Ho (1962) and Stephenson (1976), but found nothing that coincides with the position of V1315 Aql.
3.2.6 V2275 Cyg
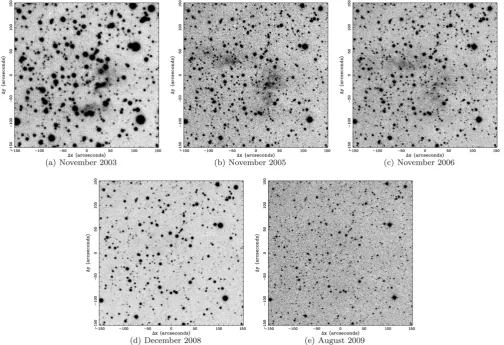
The nova eruption of V2275 Cyg (Nova Cygni 2001 No. 2) occurred on 2001 August 19 (Nakamura, Tago & Abe2001). The field around V2275 Cyg was observed on five epochs during the IPHAS survey. The five images are shown in Fig.6.
In the first three images, taken between 2003 November and 2006 November, a nebula of≈2.7 arcmin diameter is clearly appar-ent, but it has disappeared in the fourth and fifth images taken in 2008 December and 2009 August. Using the expansion velocity and minimum distance derived by Kiss et al. (2002) of approximately 2000 km s−1and 3 kpc, respectively, the shell from the 2001 nova event should have been no larger than 0.2 arcmin by 2006 Novem-ber, which is the date of the last IPHAS image the nebula was visible in. Hence the nebula in the image cannot be from the 2001 nova event. The most obvious explanation is that it is a light echo from material ejected from the system by a previous event, such as a nova shell or a planetary nebula. The angular diameter of the shell is 2.7 arcmin±0.5 arcmin. Adopting the distance of 3–8 kpc derived by Kiss et al. (2002) using maximum magnitude versus rate of decline relationships, the radius of the shell is 3–12×1016m. The time from the nova in 2001 to the date of the first IPHAS im-age is 819 d giving a light radius of 2.1×10¹⁶m. These two radii
are broadly comparable, as expected for a light echo. Assuming a typical nova shell expansion velocity of 2000 km s−1, the age of the shell can be estimated to be∼300 yr. We have reviewed the literature and can find no previous discussion of a nebula around V2275 Cyg. Indeed, the presence of light echoes around novae are relatively rare, and only GK Per, V732 Sgr, V458 Vul and T Pyx have recorded echoes (Kapteyn1901, Swope1940, Wesson et al. 2008, Sokoloski et al.2013, respectively).
There are three principal blobs of material that are apparent in the images, as highlighted in Figs7(a)–(c). Blob A does not appear in Fig.7(a) but appears in Figs 7(b) and (c). It appears to move southwards (towards the right in the images) by approximately 20 arcsec. At a distance of 3 kpc, with an interval of approximately one year between the two images, this equates to a transverse speed of 2.7×10⁸m s−1. Clearly this cannot be bulk motion of material. It is better explained as the passage of a light pulse through a pre-existing bipolar nebula, with the axis of symmetry of the nebula pointing approximately perpendicular to the plane of the sky. This orientation is suggested by the lack of eclipses in the light curve of V2275 Cyg (Balman et al.2005). Blob B appears in all three images and whilst different parts change intensity, there is no consistent motion shown. This blob of material is diagonally opposite blob A and could be the opposite pole of a bipolar nebula. Blob C only appears in Fig.7(a).
If the shell is due to a previous nova event this would mean that V2275 Cyg should be reclassified as a recurrent nova (RN), in agreement with Pagnotta & Schaefer (2014) who identified V2275 Cyg as a likely RN on the basis of its outburst light curve and spectrum.
4 D I S C U S S I O N
Our goal was to search for previously undetected nova shells around CVs, primarily NLs. The results of our search are shown in Table3.
4.1 Nova-like variables
We surveyed 22 NLs with the WHT and 5 NLs with IPHAS (three NLs were surveyed in both giving a total of 24 unique NLs), and found no shells with the WHT and evidence for only one shell in IPHAS, V1315 Aql, which we subsequently confirmed with addi-tional INT observations (see Section 3.2.5).
What can we deduce from our discovery of a shell around one NL? Let us assume that all novae that occurred in the last∼100 yr would have been observed. These would now be classified as old novae in theRKcatalogue and hence would not appear in our sample of NLs. We also know that our observations are not sensitive to shells older than∼200 yr (see Section 2.1.1). Hence our search for nova shells around NLs is only likely to find shells between 100 and 200 yr old. We found one shell in this 100 yr window, out of 24 NLs surveyed, indicating that the lifetime of the NL phase lasts approximately 2400 yr. This is consistent with the order-of-magnitude estimate of 1000 yr derived by Patterson et al. (2013) for the NL phase for long-period CVs. Hence our results lend some support to the nova-induced cycle theory, although we are dealing with small number statistics; our survey of 24 NLs represents only 31 per cent of the 78 NLs in theRKcatalogue. We also acknowledge the incompleteness of our survey due to the small field of view of the WHT images, and the shallow IPHAS images (see Section 4.3 for a discussion). We also note that our IPHAS search included seven novae with pre-viously discovered shells but we only found four, and searches for shells around known novae tend to recover shells around only half of
at University of Sheffield on July 1, 2015
http://mnras.oxfordjournals.org/
Figure 6. Hαimages of V2275 Cyg from IPHAS. A faint nebula is apparent in images (a)–(c) but is not present in images (d) and (e). In all images, north is up, east is left.
Figure 7. Hαimages of V2275 Cyg from IPHAS. See text for a discussion about the three blobs of material. In all images, north is up, east is left.
the targets (Downes & Duerbeck2000). With all of the assumptions, uncertainties and survey inefficiencies detailed above, our estimate of the NL-phase lifetime should be viewed as a lower limit.
As we were about to submit this paper, a paper appeared by Schmidtobreick et al. (2015), who presented the results of a survey for nova shells around 10 DNe in the 3–4-h period range with
low-˙
Mand five NLs that show low states (VY Scl stars). They found no shells, and used this to set a lower limit of 13 000 yr on the nova recurrence time. This is consistent with the lifetime of the NL phase of∼2400 yr that we have derived, as clearly the NL phase should be shorter than the nova recurrence time, although their figure is arguably even more uncertain than ours.
at University of Sheffield on July 1, 2015
http://mnras.oxfordjournals.org/
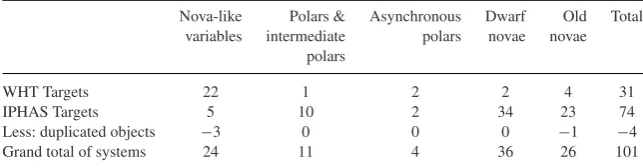
[image:9.595.47.553.441.628.2]Table 3. Summary of our search for nova shells.
Nova-like Polars & Asynchronous Dwarf Old Total variables intermediate polars novae novae
polars
WHT Targets 22 1 2 2 4 31
IPHAS Targets 5 10 2 34 23 74
Less: duplicated objects −3 0 0 0 −1 −4
Grand total of systems 24 11 4 36 26 101
4.2 Asynchronous polars
The WHT survey included two asynchronous polars, V1432 Aql and BY Cam. The images and radial profiles of these two systems are shown in AppendixA2. There are no traces of nebulosity in either the images or the radial profiles of these systems. There are two other asynchronous polars in the IPHAS survey, J0524+4244 and V1500 Cyg, the archetypal asynchronous polar. There is no evidence of a shell around J0524+4244. We did recover the previously known shell around V1500 Cyg, originating from its nova eruption in 1975 (see Section 3.2.3).
Our results imply that we are unable to confirm that a recent nova eruption is the cause of the asynchronicity in the WD spin of these systems. However, it is perhaps not surprising that we did not find any new shells given our survey limits and the synchronization time-scale. BY Cam, for example, is estimated to synchronize within ∼1100 yr (Campbell & Schwope1999), an order of magnitude longer than our 100-yr detection window (see Section 2.1.1).
4.3 Future surveys
In hindsight, our decision to use the old nova DQ Her as a guide for our WHT search strategy (Section 2.1.1) led us to underestimate the optimal field of view for hunting for nova shells. This is because DQ Her has relatively slow ejecta (350 km s−1; Warner1995). The angular size of the shell is determined by the time since the nova eruption, the distance to the CV and the speed of the ejecta, and is given by the following scaling relation:
R∼20 arcsec t/100 yr×v/1000 km s
−1
d/kpc , (1)
whereRis the angular radius of the shell in arcseconds,tis the time elapsed since the nova eruption,vis the shell expansion velocity anddis the distance to the CV. Hence a recent, distant nova with slow-moving ejecta (t=100,v=500,d=2) would have a small shell of radius∼5 arcsec, whereas an older, nearby nova with fast moving ejecta (t=200,v=2000,d=0.5) would have expanded to a radius of∼2.7 arcmin. Hence, the field of view of the Auxiliary Port on the WHT (∼1 arcmin radius) was too small to detect such large shells. This is borne out by the size of the one shell that we did discover around V1315 Aql, which is∼2.5 arcmin in radius, and the two shells discovered by Shara et al. (2007,2012b) of radii 1.5 arcmin (AT Cnc) and 15 arcmin (Z Cam). Another problem with having such a small field of view is the paucity of field stars for the radial-profile technique (Section 3.1).
The IPHAS survey, on the other hand, had more than enough field of view (∼17 arcmin radius per pointing) to discover nova shells but suffered from very short exposure times (120 s), which we had no control over, and from being constrained to the Galactic plane, making it difficult to pick out nova shells from the Hαnebulosity. A more optimal survey for nova shells would have approximately
the same field of view as an IPHAS pointing, avoid the Galactic plane and be of similar depth to our WHT survey.
5 C O N C L U S I O N S
We have performed an Hα-imaging survey for nova shells around CVs. We imaged 31 CVs with the WHT, and searched the IPHAS fields around 74 CVs.
Our search focused on looking for shells around NLs, as the nova-induced cycle theory suggests that these systems are most likely to have undergone a recent nova eruption. Of the 24 unique NLs we examined we found evidence for only one shell around V1315 Aql, which has a radius of∼2.5 arcmin, indicative of a nova eruption approximately 120 yr ago.
The survey included four asynchronous polars, two observed with the WHT (V1432 Aql and BY Cam) and two in IPHAS (J0524+4244 and V1500 Cyg) but we found no shells around any of them, except the previously known shell around V1500 Cyg. Hence we are unable to confirm whether the asynchronicity of the WD spin in these systems is due to a recent nova eruption.
We find no unambiguous detections of nova shells around other classes of CV, but we did find tentative evidence of a faint shell around the DN V1363 Cyg (see Section 3.2.4). We also find evi-dence for a light echo around the nova V2275 Cyg, which erupted in 2001, indicative of an earlier nova eruption∼300 yr ago, thus making V2275 Cyg a possible RN (see Section 3.2.6).
AC K N OW L E D G E M E N T S
This paper makes use of data obtained as part of the IPHAS (www.iphas.org) carried out at the INT. The INT and WHT are operated on the island of La Palma by the Isaac Newton Group in the Spanish Observatorio del Roque de los Muchachos of the Instituto de Astrofisica de Canarias. All IPHAS data are processed by the Cambridge Astronomical Survey Unit, at the Institute of Astronomy in Cambridge. The band-merged DR2 catalogue was assembled at the Centre for Astrophysics Research, University of Hertfordshire, supported by STFC grant ST/J001333/1. We would specifically like to thank Janet Drew for her help in accessing the IPHAS data and for her comments on the draft paper, and Jonathan Irwin who prepared the mosaic images. We would also like to thank Jeanne Wilson and Joanne Caffrey for their help with the WHT data reduction. We thank the referee, Mike Shara, for his valuable comments on the paper.
VSD, CK and TRM were supported under grants from the Science and Technology Facilities Council (STFC).
R E F E R E N C E S
Ak T., Bilir S., Ak S., Retter A., 2007, New Astron., 12, 446 Anupama G. C., Prabhu T. P., 1993, MNRAS, 263, 335
at University of Sheffield on July 1, 2015
http://mnras.oxfordjournals.org/
Balman S¸., Yılmaz A., Retter A., Saygac¸ T., Esenoglu H., 2005, MNRAS, 356, 773
Barentsen G. et al., 2014, MNRAS, 444, 3230 Becker H. J., Duerbeck H. W., 1980, PASP, 92, 792 B¨uning A., Ritter H., 2004, A&A, 423, 281
Campbell C. G., Schwope A. D., 1999, A&A, 343, 136 Downes R. A., Duerbeck H. W., 2000, ApJ, 120, 2007
Downes R. A., Duerbeck H. W., Delahodde C. E., 2001, J. Astron. Data, 7, 6
Drew J. E. et al., 2005, MNRAS, 362, 753 Duerbeck H. W., 1987, ESO Messenger, 50, 8
Ferland G. J., Williams R. E., Lambert D. L., Slovak M., Gondhalekar P. M., Truran J. W., Shields G. A., 1984, ApJ, 281, 194
G¨ansicke B. T. et al., 2009, MNRAS, 397, 2170 Gill C. D., O’Brien T. J., 1998, MNRAS, 300, 221 Ho P. Y., 1962, Vistas Astron., 5, 127
Horne K., Welsh W. F., Wade R. A., 1993, ApJ, 410, 357 Kapteyn J. C., 1901, Astron. Nachr., 157, 201
Kiss L. L., Gogh N., Vink´o J., Fur´esz G., Cs´ak B., DeBond H., Thomson J. R., Derekas A., 2002, A&A, 384, 982
Knigge C., 2010, in Kologera V., van der Sluys M., eds, AIP Conf. Ser. Vol. 1314, Binary Star Evolution: Mass Loss, Accretion and Mergers. Am. Inst. Phys., New York, p. 171
Knigge C., Baraffe I., Patterson J., 2011, ApJS, 194, 28
Liimets T., Corradi R. L. M., Santander-Garc´ıa M., Villaver E., Rodr´ıguez-Gil P., Verro K., Kolka I., 2012, ApJ, 761, 34
Littlefair S. P., Dhillon V. S., Marsh T. R., G¨ansicke B. T., Southworth J., Baraffe I., Watson C. A., Copperwheat C., 2008, MNRAS, 388, 1582 Marsh T. R., Oke J. B., Wade R. A., 1983, MNRAS, 205, 33P
Nakamura A., Tago A., Abe H., 2001, IAU Circ., 7686, 2 Osaki Y., 1974, PASJ, 26, 429
Pagnotta A., Schaefer B. E., 2014, ApJ, 788, 164 Patterson J. et al., 2005, PASP, 117, 1204 Patterson J. et al., 2013, MNRAS, 434, 1902
Ritter H., Kolb U., 2003, A&A, 404, 301 (update RKCat 7.20, 2013) (RK catalogue)
Rodr´ıguez-Gil P. et al., 2010, MNRAS, 407, L21
Schmidtobreick L., Shara M., Tappert C., Bayo A., Ederoclite A., 2015, MNRAS, 449, 2215
Shara M. M., Livio M., Moffat A. F. J., Orio M., 1986, ApJ, 311, 163 Shara M. M., Potter M., Williams R. E., Cohen J., 1989, ApJ, 337, 720 Shara M. M. et al., 2007, Nature, 446, 159
Shara M. M., Zurek D., De Marco O., Mizusawa T., Williams R., Livio M., 2012a, AJ, 143, 143
Shara M. M., Mizusawa T., Wehinger P., Zurek D., Martin C. D., Neill J. D., Forster K., Seibert M., 2012b, ApJ, 758, 121
Simonsen M. et al., 2014, J. Am. Assoc. Var. Star Obs., 42, 177 Slavin A. J., O’Brien T. J., Dunlop J. S., 1995, MNRAS, 276, 353 Smith D. A., Dhillon V. S., Marsh T. R., 1998, MNRAS, 296, 465 Sokoloski J. L., Crotts A. P. S., Lawrence S., Uthas H., 2013, ApJ, 770, L33 Stephenson F. R., 1976, QJRAS, 17, 121
Stockman H. S., Schmidt G. D., Lamb D. Q., 1988, ApJ, 332, 282 Swope H. H., 1940, Harv. Coll. Obs. Bull., 913, 11
Vaytet N. M. H., O’Brien T. J., Rushton A. P., 2007, MNRAS, 380, 175 Wade R. A., Ciardullo R., Jacoby G. H., Sharp N. A., 1991, AJ, 102, 1738 Warner B., 1983, in Livio M., Shaviv G., eds, Proc. IAU Colloq. 72.
Cata-clysmic Variables and Related Physics. Reidel, Dordrecht, p. 155 Warner B., 1995, Cataclysmic Variable Stars. Cambridge Univ. Press,
Cambridge
Wesson R. et al., 2008, ApJ, 688, L21
[image:11.595.312.545.55.660.2]A P P E N D I X A : W H T I M AG E S ( I N A L P H A B E T I C A L O R D E R O F C O N S T E L L AT I O N )
Figure A1. WHT images of our target CVs (left) and the associated radial profiles (right); the solid line is the radial profile of the CV and the dashed lines are field stars. The radial profiles are normalized to unity and plotted until they reach 1σ above the background level. The CVs are marked by bars and are located towards the centres of the images. The orientation of all images is the same, and is shown in the image of PX And.
at University of Sheffield on July 1, 2015
http://mnras.oxfordjournals.org/
Figure A2. See caption to Fig.A1for details. Figure A3. See caption to Fig.A1for details.
at University of Sheffield on July 1, 2015
http://mnras.oxfordjournals.org/
[image:12.595.51.280.56.666.2]Figure A4. See caption to Fig.A1for details. Figure A5. See caption to Fig.A1for details.
at University of Sheffield on July 1, 2015
http://mnras.oxfordjournals.org/
[image:13.595.120.533.53.660.2]Figure A6. See caption to Fig.A1for details.
This paper has been typeset from a TEX/LATEX file prepared by the author.
at University of Sheffield on July 1, 2015
http://mnras.oxfordjournals.org/