This is a repository copy of Intermolecular Bonding of Hemin in Solution and in Solid State Probed by N K-edge X-ray Spectroscopies.
White Rose Research Online URL for this paper: http://eprints.whiterose.ac.uk/93043/
Version: Accepted Version
Article:
Golnak, R, Xiao, J, Atak, K et al. (4 more authors) (2015) Intermolecular Bonding of Hemin in Solution and in Solid State Probed by N K-edge X-ray Spectroscopies. Physical
Chemistry Chemical Physics, 17. 29000 - 29006. ISSN 1463-9084
https://doi.org/10.1039/C5CP04529K
[email protected] https://eprints.whiterose.ac.uk/ Reuse
Unless indicated otherwise, fulltext items are protected by copyright with all rights reserved. The copyright exception in section 29 of the Copyright, Designs and Patents Act 1988 allows the making of a single copy solely for the purpose of non-commercial research or private study within the limits of fair dealing. The publisher or other rights-holder may allow further reproduction and re-use of this version - refer to the White Rose Research Online record for this item. Where records identify the publisher as the copyright holder, users can verify any specific terms of use on the publisher’s website.
Takedown
If you consider content in White Rose Research Online to be in breach of UK law, please notify us by
Intermolecular Bonding of Hemin in Solution and in Solid State Probed by N K-edge
X-ray Spectroscopies
Ronny Golnak,a,b Jie Xiao,*,a Kaan Atak,a,c Joanna S. Stevens,d Adrian Gainar,d Sven L.
M. Schroeder,e,f Emad F. Aziz*,a,c
a. Joint Ultrafast Dynamics Lab in Solutions and at Interfaces (JULiq), Institute of
Methods for Material Development, Helmholtz-Zentrum Berlin für Materialien und
Energie, Albert-Einstein-Strasse 15, D-12489 Berlin, Germany
b. Fachbereich Chemie, Freie Universität Berlin, Takustrasse 3, D-14195 Berlin,
Germany
c. Fachbereich Physik, Freie Universität Berlin, Arnimallee 14, D-14195 Berlin,
Germany
d. School of Chemical Engineering and Analytical Science, School of Chemistry, The
University of Manchester, Oxford Road, Manchester M13 9PL, United Kingdom
e. School of Chemical and Process Engineering, University of Leeds, Leeds LS2 9JT, UK
f. DIAMOND Light Source Ltd., Harwell Science and Innovation Campus, Chilton,
Didcot OX11 0DE, UK
*corresponding author: [email protected]; [email protected]
Abstract
X-ray absorption/emission spectroscopy (XAS/XES) at the N K-edge of iron
protoporphyrin IX chloride (FePPIX-Cl, or hemin) has been carried out for dissolved
monomers in DMSO, dimers in water and for the solid state. This sequence of samples
permits identification of characteristic spectral features associated with the hemin
intermolecular bonding. These characteristic features are further analyzed and understood
Introduction
Metalloporphyrins are functional materials with extensive applications in catalysis, solar
energy conversion and biological systems.[1–5] In these systems, porphyrin molecules are
often in a solution environment, in which self-association can lead to different types of
non-monomeric species. The differences in solvation and solute-solute interactions will
consequently affect the functionality of metalloporphyrins, requiring studies of speciation
in solution to further our understanding of their functionality. For example, iron
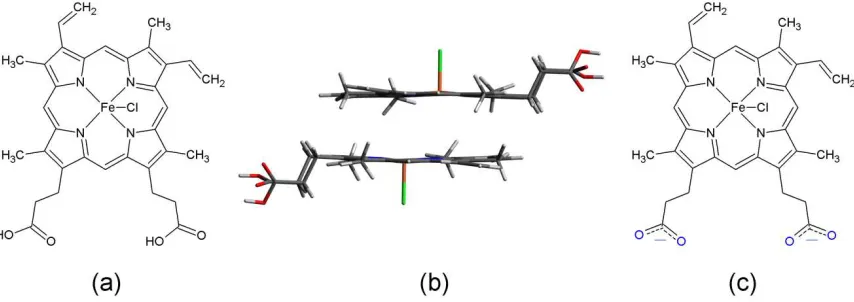
protoporphyrin IX chloride (FePPIX-Cl, or hemin, Figure 1a) forms monomer species
when dissolved in dimethyl sulfoxide (DMSO), while dimer structures are present in
aqueous solution.[6–9] It is known that the electronic structure of hemin, especially the local
electronic structure at the Fe center, which often serves as the major functional site, is
altered due to dimerization.[7] Hemin oligomer species in various solvents have therefore
been investigated previously by UV-Vis spectroscopy and X-ray absorption/emission
spectroscopy (XAS/XES) at the Fe L-edge,[6–9] although the nature of the probed electronic
transitions implied that the hemin intermolecular bonding interactions were probed rather
indirectly. UV-Vis measures overlapping valence excitations of all components in the
hemin solution, without differentiation between contributions from solute, solvent or
solute-solvent interactions. The lack of exclusive probing of the - interactions expected
for hemin dimerization left some ambiguity in the interpretation of the UV-Vis data.[9]
XAS/XES measurements at the Fe L-edge, on the other hand, represent a local probe
sensitive to the electronic structure changes at the Fe sites induced by hemin dimerization.[7]
However, the information obtained for the dimerization is still fairly indirect, since hemin
dimerization is primarily driven by - stacking of porphyrin rings, without intermolecular
bonding by the Fe center, as illustrated in Figure 1b.[7–9] The characteristic L-edge features
at the Fe sites[7] do of course depend on their interaction with the N moieties of the
porphyrin ring, but the Fe center in hemin is also coordinated by a chloride ligand.
Moreover, there is a sixth vacant coordination site perpendicular to the porphyrin plane,
available for possible coordination by molecules from the solvent. Even though
contributions of Fe-solvent interaction have been determined to be insignificant,[7] they
interactions at the Fe site for obtaining unambiguous information about the - interactions
underlying dimerization.
Locally probing the N valence orbitals is expected to be a more explicit way of
probing hemin dimerization, or the extent of hemin intermolecular interactions in general.
The N moieties are part of the porphyrin ring and thus part of the valence system directly
involved in the - stacking. Each N atom embedded in the porphyrin ring is fully coordinated with the metal center and C atoms of the porphyrin and consequently there is
much less scope for strong interaction with solvent molecules. We have therefore targeted
the local electronic structure at the N moieties through X-ray absorption/emission
spectroscopy (XAS/XES), to obtain electronic structure information about the unoccupied
and occupied valence states of hemin in solution.[5,10,11] We will show that
solvent-dependent XA/XE spectral differences at the N K-edge are observable, and certain XA
features are identified as spectral characteristics associated with the extent of hemin
intermolecular bonding.
DMSO and 0.5 M NaOH aqueous solution were chosen as solvents to dissolve
hemin powder as in previous studies. These solutions contain hemin monomer and dimer
species, respectively.[6,7] The high pH value (from NaOH) of the aqueous solution increases
hemin solubility in water, but adds potential additional complexity due to formation of the
carboxylate anionic form in basic solution, as shown in Figure 1c. However, because the
carboxylate groups are not conjugated with the system of the porphyrin ring their
influence on the N K-edge is expected to be minor, in contrast to the recently presented N
K-edge spectra of para-aminobenzoic acid in solution, where the amine nitrogen felt the
direct influence of the carboxylate group as both were part of the delocalised system of
the aromatic ring.[12]
Experimental Methods
Hemin (iron protoporphyrin IX chloride, FePPIX-Cl) powder from bovine (purity > 90%)
was purchased from Sigma-Aldrich, and further dissolved in 0.5 M NaOH aqueous solution
and dimethyl sulfoxide (DMSO) solvent to make 0.1 M and 0.05 M hemin solutions,
respectively. The hemin solutions were introduced into a vacuum chamber by liquid
beam was effectively avoided since the liquid sample was constantly refreshed. The solid
powders were spread across a double-sided adhesive copper tape attached to a copper plate
which was mounted at 45° with respect to the incident photon beam in the vacuum chamber.
The possible radiation damage to the solid samples was minimized by reducing incident
photon flux and frequent changing of the measurement spots.
The experiment was carried out at the U41-PGM undulator beamline and
LiXEdrom endstation at the synchrotron facility BESSY II, Berlin. The U41-PGM
provides horizontally linear polarized light with high photon flux (~ 1013 photon/s) and
small focal spot (~ 40 m of vertical size), which is crucial to our measurements. High flux
is required for low-concentration samples. Small vertical focal size (~ 40 m) assures high
energy resolution for XES measurements. The photons emitted from the sample were
collected along the polarization direction of the incident photon beam (to suppress the
elastic peak) and subsequently dispersed by a spherical grating with 1200 lines/mm and
7.5 m radius. The dispersed photons were then detected by a microchannel plate
(MCP)/fluorescence screen/CCD assembly. The sample (micro-jet), grating, and photon
detector are arranged in a Rowland circle geometry for accurate focusing. The grating and
detector chamber was kept at a pressure of 10-8 mbar or lower to protect the grating and
MCP surfaces from contamination, while the sample chamber was at 10-5 mbar. The
incident photon energy was tuned to the N K-edge, and the N 2p 1s transition was
selected for the detection of the emitted photon from both liquid and solid samples, giving
rise to the XE spectra. Integration of a series of XE spectra acquired at various excitation
photon energies over the emitted photon energy delivers one XA spectrum, which is
referred as XAS in partial-fluorescence-yield (PFY) mode.
Theoretical Calculations
The DFT calculations were conducted with the ORCA program package[15] to obtain the
molecular orbital (MO) information of the hemin molecule in gas phase in the ground
state.[6] Molecular geometry optimization was performed using the B3LYP DFT method
together with the def2-TZVP(-f) basis set.[16–18] The N contributions to both occupied and
unoccupied valence MO are acquired from Löwdin population analysis based on the DFT
(according to the N contribution) is applied to each valence MO and then summed up, to
simulate the XA/XE spectra obtained at the N K-edge.
Results and Discussion
The obtained PFY-XA and XE spectra of hemin in DMSO (monomer) and in 0.5 M NaOH
aqueous solution (dimer) are shown in Figure 2 as blue and red traces, respectively, along
with the difference plot (black trace in the left panel) obtained from the subtraction of the
monomer XA spectrum (blue) from that of the dimer (red). The XA spectra of the two
hemin oligomer species are very similar but on closer inspection three regions with
significant spectral differences can be identified, indicated by the three color-highlighted
areas of the difference plot. The intense absorption feature at 398.5 eV, which represents
the lowest unoccupied molecular orbital (LUMO) at the N sites, is associated with the
porphyrin nitrogen in a N–Fe environment.[20,21] Such a low-lying energy feature is,
therefore, completely absent in small metal-free N-containing molecules.[12,22,23] The
metal-free porphyrin (2HTPP) usually has the first N absorption feature located more than
1 eV below the metal-N peak with much reduced intensity, arising from the inequivalence
of the N species in the absence of the metal centre, leading to iminic =N− and pyrrolic
−NH− nitrogen.[20,21] The slight energy shift between the two absorption edges at around 398 eV is made evident by the blue-highlighted area in the difference plot, which actually
indicates a broadening, instead of an energy shift, of the first absorption feature for the
hemin dimer species since its peak position at 398.5 eV does not exhibit observable shift
when compared with that of hemin monomer (the broadening effect is discussed below).
Nonetheless, the NFe features of the two hemin species are in general very similar, which
is in line with the similarity of the LUMO observed in the Fe L-edge XA spectra, [7]
indicating that the NFe bonding is not strongly influenced by the dimerization process, or
affected by the different solvents significantly. The absorption features at 400-403 eV
(green-highlighted) originate from N * orbitals as N is part of the aromatic ring system,
while the arising absorption edges at the brown-highlighted area are in the region of the
ionization potentials (IPs).[12,22] The N * orbitals and IP thus exhibit distinguishable
characteristics for different hemin solutions. The exact origins of these differences will be
Besides the unoccupied valence orbitals revealed by XAS, slight differences
between the occupied valence states at the N sites are also uncovered by the XE spectra of
the two hemin solutions (Figure 2). Emitted photon energies, instead of photon energy
losses that are often observed in highly localized and correlated electron systems as in d or
f orbitals, are shared by the N XE features measured at various excitation energies, marked
by vertical dashed green lines in Figure 2. The absence of the loss features indicates little
electron correlation in the N 2p orbitals, as expected for generally delocalized orbitals like
valence s or p. The XE spectra of hemin in NaOH aqueous solution (red traces) present
generally a better resolution (narrower peaks) when compared with the spectra of hemin in
DMSO (blue traces). This is in line with the previous observation at the Fe L-edge that the
Fe XE peaks of hemin dimer species are narrower than those of hemin monomer, owing to
the higher degree of orbital localization induced by hemin dimerization.[7] Different
degrees of orbital delocalization (or localization) in the two hemin oligomer species also
lead to the elastic peaks with different intensities. The elastic peak of each red XE spectrum
(hemin dimer) in Figure 2 shows higher intensity than the blue trace (hemin monomer)
when the excitation energy tuned to the corresponding absorption peaks, indicating higher
cross-sections of the N 2p 1s transition for hemin dimer. It can be argued that the higher
degree of orbital localization in hemin dimer preserves a density of states (DOS) with the
p character of the N 2p orbital better than in the hemin monomer, resulting in more
dipole-allowed 2p 1s transitions. If the N 2p orbitals mixes more with Fe 3d orbitals, lower
transition probability is expected since lower DOS with p character is present at the N sites
due to the higher extent of N 2p orbital delocalization in the hemin monomer.
The more intense elastic peak and better resolved emission features in the N XE
spectra of hemin in aqueous solution could be regarded as an indicator of hemin
dimerization, similar to the observation of the local energy gap opening at the Fe L-edge
used to indicate the hemin dimerization.[7] However, unlike the local gap opening at the Fe
L-edge that involves the energy shift of the characteristic spectral feature, these observed
spectral differences in the N XE spectra only contain intensity variations. Signal strength
often largely depends on extrinsic parameters and thus cannot be used as an intrinsic and
reliable indicator for hemin dimerization. The observed differences of the N * orbitals
differentiate between hemin monomer and dimer species. It is instructive to compare these
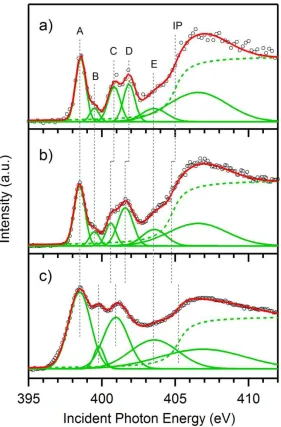
N XA spectra of the small scale intermolecular bonding species (dimer) in Figure 2 with
that of a large scale case in solid form, to clearly identify the characteristic spectral
evolution under the various extents of hemin aggregation. Such a comparison of the XA
spectra is presented in Figure 3, with their respective fitted components (green traces) as
well as the summations of the components (red traces). Each individual fitted Gaussian
component below IP is marked by vertical dashed lines and labeled as A, B, C, D and E.
The IPs are fitted by arctan step functions with their energy positions marked by vertical
lines as well.
The most striking difference between the solid state and the solution spectra is the
considerable broadening of almost all the spectral features in the solid state spectrum. This
is likely due to the extensive orbital overlapping in the solid state [24,25] and was also
somewhat evident in the previous study of aminobenzoic acid.[12] This solid state
broadening makes the component A, originating from the N–Fe interaction as discussed in
Figure 2, and component B resolvable in Figure 3a and 3b after the Gaussian fitting appear
to be irresolvable in Figure 3c. The feature B may stem from a multi-electron excitation,
e.g. a shake-up satellite to feature A, or reflect an electronic state that originates from
solute-solvent interactions since the ground state calculation (vertical bars at the bottom of
Figure 4) does not give rise to any molecular orbitals in this energy region. Feature A keeps
relatively similar peak widths in Figures 3a and 3b because the N–Fe interaction is not
directly involved in the dimerization process. However, its broadening in Figure 3c
suggests that the hemin oligomer species in the solid form may adopt different forms of
intermolecular bonding that may involve the N–Fe interaction to some extent. Components
C and D, constituting the green-highlighted difference in Figure 2, exhibit monotonic
energy shifts from the monomer (Figure 3a) to the dimer (3b), and appear to be even lower
in the solid (3c). It seems that these features are associated with the development of
hemin-hemin interactions and can therefore be used to characterize the extent of intermolecular
bonding. The shifts of the features C and D to lower energies indicate that the measured
energy level distances between the N * orbitals and the N 1s core level are systematically
reduced when a larger scale of the hemin oligomer species is realized. The origin of this
lowered or the N 1s core level binding energy raised. Alternatively, a final state effect may
contribute, perhaps reflecting differences in valence charge relaxation upon core-hole
formation, analog to the relaxation shift of CO molecules going from gas phase to solid
state observed in photoelectron spectroscopy.[26] However, recent studies of bipyridine acid
salts and co-crystals indicated that the effect of final state effects on the relative positions
of * features are negligible, even when comparing bipyridine nitrogen species in very
different local chemical environments.[27] Further inspection into the individual
components C and D uncovers that the feature C remains roughly constant in peak width
from Figure 3a to 3c, while the feature D becomes broader and relatively more intense
upon hemin aggregation. The mechanism of this distinct peak evolution is likely due to the
different extents of the orbital involvement in the hemin intermolecular bonding
interactions which will be discussed in detail for Figure 4 based on a molecular orbital
(MO) picture derived from DFT calculations.
The evolution of feature E is very similar to feature A, both exhibiting solid state
broadening. However, the feature E does not have a sole MO origin as for feature A where
the N–Fe interaction can be assigned, because it consists of contributions of many MOs. A
similar situation also occurs for the broadest fitted Gaussian components with their centers
located above the IPs, representing contributions from a number of MOs, as illustrated by
the vertical bars at about 404-411 eV at the bottom of Figure 4. Strictly speaking, each
spectral feature in Figure 3 comprises multiple MOs, and therefore should not be
represented by a single Gaussian function in principle. Nevertheless, the fittings of the
components A, B, C and D with a single Gaussian function still hold the physical
significance discussed above because the contributed MOs to each component are very few
in number and also located closely to each other in energy, as demonstrated in Figure 4.
The characteristic spectral features that can distinguish various hemin oligomer species are
therefore the features C and D in Figure 3 exhibiting systematic energy shifts, and
consequently associated with the extent of hemin intermolecular interactions.
The energy shifts of the IPs, however, do not follow the monotonic energy shift
when going from dimer to solid, as shown in Figure 3b and 3c. The IP shift from Figure 3a
to 3b is in line with the energy shift of the features C and D, which seems to suggest they
explain the non-shifting features, such as feature A, and the opposite shifting of the IP in
the spectrum of the solid sample. The other mechanism discussed above, i.e. the initial state
effect of the valence orbital shifting, has to come to play.
With the help of the ground state DFT calculations, the origins of the characteristic
features C and D that exhibit distinct spectral evolutions of the component width and
intensity in Figure 3 is uncovered at a MO level. The theoretically simulated spectrum at
the occupied and unoccupied valence levels, obtained from the summation of individual N
contributions with a universal Gaussian broadening, is plotted in Figure 4, along with the
combined XA and XE spectra of the hemin monomer (in DMSO) and dimer (in NaOH
aqueous solution) for comparison. The N contribution to each calculated MO, shown as
vertical bars at the bottom of Figure 4, is acquired from the Löwdin population analysis
based on the DFT calculations of the gas phase hemin in the ground state. Even though the
experimental spectra are acquired from the core-hole excited final state (XAS) or initial
state (XES), the simulated peak positions from the ground state calculation are in good
agreement with experiment, allowing for accurate and reliable assignments of the
calculated MOs to the experimental peaks. The characteristic features C and D in Figure 3
can therefore be visualized as the MOs presented in Figure 4. As illustrated in Figure 4, the
feature C mainly originates from the orbitals localized at a single N atom; while the feature
D, on the other hand, is from the orbitals delocalized over all four N atoms, as highlighted
by dotted green circles. With development of the hemin intermolecular bonding through
stacking of the porphyrin ring, the feature D that involves four N atoms will surely develop a higher extent of the peak width broadening as well as intensity enhancement,
owing to the extensive orbital overlapping, when compared with the feature C that has only
very localized orbitals involved in the hemin-hemin interaction. The localized nature of the
feature C inhibits its orbital overlapping with neighbor orbitals and consequently
suppresses the broadening and enhancement of the fitted peak, as demonstrated in Figure
3.
Due to the computational challenges for large-scale hemin oligomer species – dimer
and above – the DFT calculations are only performed on a geometry-optimized isolated
hemin monomer. The proposed N 1s core level shift arising from the different hemin
the ground state, so that the final state effect is not possible to investigate. The spectrum of
the solid sample is not included in Figure 4 for the comparison with the theoretical
simulation because the strong solid state effect is expected to have significant influences
on both initial state shifting and final state relaxation, which shifts certain experimental
peaks significantly when compared with those of the isolated molecules, as has been
demonstrated in Figure 3 for the features C and D. Therefore, attempted assignments of the
calculated MOs performed on the gas phase molecules to the solid state features may not
possess high credibility.
Conclusions
X-ray absorption and emission spectroscopy (XAS/XES) have been performed on solvated
hemin molecules dissolved in DMSO and NaOH aqueous solution, as well as on the solid
state. Characteristic features in the N XA spectra are identified and associated with
electronic structure changes arising from hemin intermolecular bonding interactions. The
spectral evolutions of these features upon the development of hemin-hemin interactions are
further analyzed at the molecular orbital level derived from the DFT calculations. The
results show that N K-edge X-ray spectroscopies provide experimental access to porphyrin
intermolecular interactions in solution and in the solid state by tracking the energy shifts
of the characteristic N K-edge XA features, crucially permitting in situ detection for
electronic structure investigations. The exact energy positions of these characteristic
features also provide a reference to help identify hemin oligomer species in solution, e.g.
monomer in DMSO or dimer in aqueous solution.
Acknowledgements
This work was supported by the European Research Council Grant No. 279344. Part of
this work was financially supported by the Helmholtz-Gemeinschaft via the young
investigator fund VH-NG-635. K.A. acknowledges the financial support of the Einstein
Foundation Berlin for the postdoctoral scholarship. S.L.M.S., J.S.S. and A.G. acknowledge
financial support from the EPSRC through the Critical Mass Grant EP/1013563/1. S.L.M.S.
holds a Royal Academy of Engineering Chair supported by Infineum UK Ltd. and
References
[1] M. Ethirajan, Y. Chen, P. Joshi, R. K. Pandey, Chem. Soc. Rev. 2010, 40, 340–362.
[2] D. González-Rodríguez, G. Bottari, J. Porphyr. Phthalocyanines 2009, 13, 624–636.
[3] L.-L. Li, E. W.-G. Diau, Chem. Soc. Rev. 2012, 42, 291–304.
[4] A. Vecchi, P. Galloni, B. Floris, V. N. Nemykin, J. Porphyr. Phthalocyanines 2013,
17, 165–196.
[5] E. F. Aziz, J. Phys. Chem. Lett. 2011, 2, 320–326.
[6] K. Atak, R. Golnak, J. Xiao, E. Suljoti, M. Pflueger, T. Brandenburg, B. Winter, E. F.
Aziz, J. Phys. Chem. B 2014, 118, 9938–9943.
[7] R. Golnak, J. Xiao, K. Atak, M. Khan, E. Suljoti, E. F. Aziz, J. Phys. Chem. B 2015,
119, 3058–3062.
[8] A. C. Maehly, å. Åkeson, G. Bergson, A. Grönvall, B. Zaar, E. Diczfalusy, Acta Chem.
Scand. 1958, 12, 1259–1273.
[9] K. A. de Villiers, C. H. Kaschula, T. J. Egan, H. M. Marques, JBIC J. Biol. Inorg.
Chem. 2007, 12, 101–117.
[10] K. M. Lange, E. F. Aziz, Chem. Soc. Rev. 2013, 42, 6840–6859.
[11] E. Suljoti, R. Garcia-Diez, S. I. Bokarev, K. M. Lange, R. Schoch, B. Dierker, M.
Dantz, K. Yamamoto, N. Engel, K. Atak, et al., Angew. Chem. Int. Ed. 2013, 52, 9841–
9844.
[12] J. S. Stevens, A. Gainar, E. Suljoti, J. Xiao, R. Golnak, E. F. Aziz, S. L. M.
Schroeder, Chem. – Eur. J. 2015, 21, 7256–7263.
[13] K. M. Lange, R. Könnecke, S. Ghadimi, R. Golnak, M. A. Soldatov, K. F. Hodeck,
A. Soldatov, E. F. Aziz, Chem. Phys. 2010, 377, 1–5.
[14] R. Golnak, K. Atak, E. Suljoti, K. F. Hodeck, K. M. Lange, M. A. Soldatov, N.
Engel, E. F. Aziz, Phys. Chem. Chem. Phys. 2013, 15, 8046–8049.
[15] F. Neese, Wiley Interdiscip. Rev. Comput. Mol. Sci. 2012, 2, 73–78.
[16] A. D. Becke, Phys. Rev. A 1988, 38, 3098–3100.
[17] A. D. Becke, J. Chem. Phys. 1993, 98, 5648–5652.
[19] K. Atak, R. Golnak, J. Xiao, M. Pflüger, T. Brandenburg, B. Winter, E. F. Aziz,
Phys. Chem. Chem. Phys. 2015, 17, 3409–3414.
[20] M. V. Nardi, R. Verucchi, L. Pasquali, A. Giglia, G. Fronzoni, M. Sambi, G.
Mangione, M. Casarin, Phys. Chem. Chem. Phys. 2015, 17, 2001–2011.
[21] N. Schmidt, R. Fink, W. Hieringer, J. Chem. Phys. 2010, 133, 054703.
[22] J. S. Stevens, C. R. Seabourne, C. Jaye, D. A. Fischer, A. J. Scott, S. L. M.
Schroeder, J. Phys. Chem. B 2014, 118, 12121–12129.
[23] M. J. Thomason, C. R. Seabourne, B. M. Sattelle, G. A. Hembury, J. S. Stevens, A.
J. Scott, E. F. Aziz, S. L. M. Schroeder, Faraday Discuss. 2015, 179, 269–289.
[24] J. Xiao, P. A. Dowben, J. Phys. Condens. Matter 2009, 21, 052001.
[25] J. Xiao, P. A. Dowben, J. Mater. Chem. 2009, 19, 2172–2178.
[26] H.-J. Freund, M. Neumann, Appl. Phys. A 1988, 47, 3–23.
Figure 1. (a) Schematic of hemin chemical structure with neutral carboxyl groups (COOH),
(b) geometrical arrangement of hemin dimer, and (c) schematic of hemin chemical
[image:14.612.94.521.72.223.2]Figure 2. PFY-XA and XE spectra of hemin dissolved in DMSO (blue) and in NaOH
aqueous solution (red). The black trace is the difference plot of the two XA spectra, with
color-highlighted areas indicating the differences observed in the PFY-XA spectra of the
two hemin solutions. The excitation energies used for XES measurements are labeled on
the right side of the figure, and also indicated by horizontal green dashed lines pointing to
the corresponding PFY features in the left panel. The vertical green dashed lines in the
right panel mark the major XE features at the N K-edge. All spectra were normalized to
[image:15.612.100.504.79.424.2]Figure 3. N K-edge PFY-XA spectra, represented by circles , of a) hemin in DMSO, b)
hemin in NaOH aqueous solution and c) hemin powder in solid form, with their respective
fitted components in green and the summation of these components in red. The ionization
potential (IP) is fitted by step functions arctan, represented as green dashed traces, while
the other components by Gaussian functions (solid green traces) with labels A, B, C, D and
E. The energy positions of the IP and fitted Gaussian components, as well as their relative
Figure 4. Off-resonant XE spectra (solid blue and red traces) at the excitation energies of
420 eV for the hemin dissolved in DMSO and NaOH aqueous solution, respectively,
combined with their respective PFY-XA spectra (dashed blue and red traces). The
experimental spectra are identical to the corresponding spectra in Figure 2. The theoretical
DFT calculations and individual MOs weighted by N contributions are shown at the bottom
as black trace and vertical bars, respectively. The characteristic features C and D identified
in Figure 3 are assigned to certain calculated MOs with visualized orbitals presented on the
right side of the figure. The orbitals localized at the N sites are highlighted with dotted
TOC Figure
Characteristic X-ray absorption features indicate the extent of hemin intermolecular