This is a repository copy of
Assessing the expected value of research resolving
uncertainty and improving implementation
.
White Rose Research Online URL for this paper:
http://eprints.whiterose.ac.uk/97825/
Version: Published Version
Monograph:
Grimm, S.E. orcid.org/0000-0002-2175-7999, Dixon, S. and Stevens, J. (2015) Assessing
the expected value of research resolving uncertainty and improving implementation.
Discussion Paper. HEDS Discussion Paper Series (15.03). Health Economics and
Decision Science, School of Health and Related Research (ScHARR), University of
Sheffield , Sheffield.
[email protected] https://eprints.whiterose.ac.uk/ Reuse
Unless indicated otherwise, fulltext items are protected by copyright with all rights reserved. The copyright exception in section 29 of the Copyright, Designs and Patents Act 1988 allows the making of a single copy solely for the purpose of non-commercial research or private study within the limits of fair dealing. The publisher or other rights-holder may allow further reproduction and re-use of this version - refer to the White Rose Research Online record for this item. Where records identify the publisher as the copyright holder, users can verify any specific terms of use on the publisher’s website.
Takedown
If you consider content in White Rose Research Online to be in breach of UK law, please notify us by
School of
Health
And
Related
Research
Health Economics & Decision Science (HEDS)
Discussion Paper Series
Assessing the expected value of research: resolving
uncertainty and improving implementation dynamics
Sabine Grimm, Simon Dixon, John W Stevens
Corresponding author: Sabine Grimm
ScHARR, University of Sheffield, Regent Court, Sheffield, S1 4DA
Telephone: +44 (0)114 222 9187
Fax: +44 (0)114 272 4095
Email:
[email protected]
Disclaimer:
This series is intended to promote discussion and to provide information about work in progress.
The views expressed in this series are those of the authors. Comments are welcome, and should be
sent to the corresponding author.
Assessing the expected value of research resolving uncertainty
and improving implementation dynamics
Authors:
Sabine Grimm (MSc, ScHARR, University of Sheffield) Simon Dixon (PhD, ScHARR, University of Sheffield) John W Stevens (PhD, ScHARR, University of Sheffield)
Corresponding author:
Sabine E. Grimm (MSc, BA)
HEDS, ScHARR
The University of Sheffield
Regent Court, 30 Regent Street
Sheffield S1 4DA
ABSTRACT
Background: With low implementation of cost-effective health technologies being a problem in many health systems, it may be worth considering the potential effect of research on implementation at the time of technology appraisal.
Objective: To demonstrate methods for assessing the value of research in terms of both reduction of uncertainty and improvement in implementation, considering the dynamic nature of implementation.
Methods: We extend an existing framework to assess the values of information and implementation to account for the relationship between information and implementation and to reflect implementation dynamics. The resulting framework is applied to a genuine technology in the area of pre-term birth screening and results obtained from static and dynamic analyses are compared. The data to inform the effect of research evidence on implementation dynamics was obtained through a previous elicitation of expert opinion on quantities that informed the parameterisation of a dynamic implementation curve based on diffusion theory.
Results: Incorporating the relationship between information and implementation in the assessment of research led to an expected value of research much larger than the one based on reduction of uncertainty alone in the exemplar case study. Considering the dynamics of implementation makes a significant difference to the expected value of research and accounting for the time when research reports may do so as well, both making existing analyses more realistic. However, such analyses require additional data and therefore resources.
Conclusions: Assessing the expected value of research in terms of both, the reduction in uncertainty and improvements in implementation dynamics, has the potential to complement currently used analyses in health technology assessments, especially in Recommendation with Research decision.
Assessing the expected value of research resolving uncertainty
and improving implementation dynamics
Background
Implementation of health technologies has often been noted to be low in many OECD countries (OECD Health Project, 2005) and also especially in the UK (Department of Health, 2011), leading to inefficiencies in the health system caused by the co-existence and reimbursement of cost-effective and cost-ineffective
technologies. These inefficiencies pose a burden to the payer in terms of money lost that could be spent in a more effective way elsewhere, and ultimately to patients in terms of health lost. The NHS has therefore declared getting cost-effective technologies into practice a priority (Department of Health, 2011). Despite this, there is no standardised procedure in place in the UK that allows evaluating implementation measures at the time of technology appraisals (NICE, 2013). In fact, NICE does not have a mandate to recommend
implementation measures, but it can recommend that further research be conducted, if there is large decision uncertainty (NICE, 2013).
Such Recommendation with Research (RwR) or Only in Research (OIR) decisions can be considered using the framework on coverage decisions developed by Walker et al. (2012) and can be assessed for their value using Expected Value of Information (EVI) methods. However, to our knowledge, the EVI methods used in practice do not consider the effect that the recommended research studies may have on the dynamics of health technology implementation. This is an omission, as further evidence may very well influence the
implementation of a new health technology (Fenwick et al., 2008), thus reducing the burden that low implementation poses to the payer.
While research can already be designed to address the decision uncertainty present in appraisals, research could also be designed to improve implementation, as was identified by Fenwick et al. (2008) and investigated further by Willan and Eckermann (2010). These two objectives may or may not be reached by similar research studies and a methodology is required that can assist the design of research studies such that the maximum impact on the burdens of low implementation and uncertainty can be achieved. One possible question that may arise is which research objective to address. EVI analysis may highlight different drivers of decision uncertainty that may differ from the clinical uncertainty that may drive the adoption decision.
of implementation that was observed or estimated at the time, as for example in the application of the expected value of implementation framework by Hoomans et al. (2009), without considering any changes in implementation that might occur naturally.
One reason for these omissions may be methodological issues: the estimation of potentially low and changing implementation in the future can be challenging, especially when the technology has not been introduced yet (Serra-Sastre and McGuire, 2009); and effects of any implementation measures, including research, on implementation are equally as difficult to predict.
The aim of this research was to propose a framework that facilitates understanding of the role of research studies for their potential in reducing the burdens of uncertainty and low implementation, using elicited data on implementation dynamics for the pre- and post-research implementation estimates.
This article is structured as follows: in the next section, the concepts needed for the evaluation of
implementation measures and research are described and then, the concepts are extended to incorporate the dynamic nature of implementation. Following that, static and dynamic expected value of research analysis will be illustrated in an anonymised genuine case study in pre-term birth screening. Lastly, results and implications will be discussed.
Concepts for assessing the Expected Value of Research
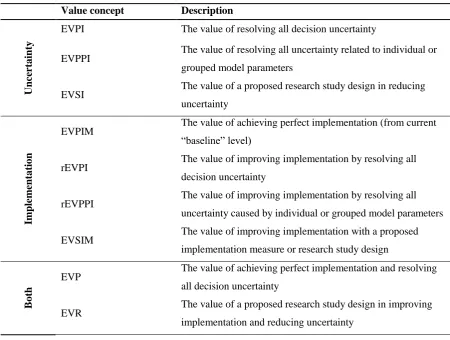
We first describe the existing Expected Value (EV) concepts and then describe how we extended them. All of these concepts are summarised in Table 1. We show the mathematical expression for each of the value concepts in the technical appendix.
Existing concepts for evaluating research and implementation
The Expected Value of Perfect Information (EVPI) is the expected value of reducing all uncertainty about parameters present in a decision (Briggs et al., 2006). When a decision is made under uncertainty, because we do not have perfect information about parameters, there is a risk of making the “wrong” decision, that is recommending a health technology that does not provide the maximum expected net benefit (in monetary or health terms). The cost of making this decision under uncertainty, the EVPI, is therefore composed of the risk of making the “wrong” decision and the consequences of making that decision in terms of costs or health foregone.
2008). The EVPIM reflects the losses that the payer will incur due to less cost-effective technologies remaining partially implemented. If the EVPIM is not resolved, that is, full implementation is not achieved, the payer will pay for a mix of technologies that is in use that does not maximise the health gain associated with the spending or that does not minimise the cost associated with the health gain.
When there is a burden associated with both, decision uncertainty and low implementation, the payer faces a combined burden of uncertainty and compliance to the recommendation decision that is described by the Expected Value of Perfection (EVP). Decision uncertainty, measured by the EVPI, can be reduced by conducting further research. When there is low implementation of the cost-effective technology, this can be addressed by investing in implementation measures, thus decreasing the EVPIM. The Expected Value of Perfection can therefore be reduced by implementation measures and research.
It follows that when perfect implementation has been achieved, the Expected Value of Perfection reduces to the EVPI. When perfect information has been achieved, the EVP could reduce to the EV of Perfect
Implementation, assuming that research and implementation are completely independent. In reality, however, effects of research on implementation may result in a reduction in the EVPIM without having executed any implementation measures. This could be called the post-research EVPIM and it is lower than the pre-research EVPIM if research has an effect on implementation. This means that there is a part of the Expected Value of Perfection (and equally the EVPIM) that can be addressed by research activities that tackle both
implementation and decision uncertainty at the same time. This part of the EVP is the realisable EVPI (rEVPI) that was described by Fenwick et al. (2008).
Of practical importance, the distinction of the post-research EVPIM and the rEVPI implies that part of the EVPIM can only be resolved through research. The value of research can therefore be much larger than the EVPI alone. To aid decision-making in terms of improving implementation and reducing uncertainty, it is useful to present the EVP as the sum of the EVPI, the post-research EVPIM and the rEVPI.
Other concepts that are useful in the context of assessing research studies are the expected value of perfect parameter information (EVPPI), that determines how much individual or grouped input parameters contribute to decision uncertainty, and the realisable EVPPI (rEVPPI), that determines the value of resolving all
uncertainty associated with individual or grouped parameters in terms of reducing uncertainty and improving implementation.
The Expected Value of Research
A specific research study can be evaluated using the Expected Value of Sample Information (EVSI). The EVSI indicates by how much the EVPI will be reduced when further research is conducted.
Expected Value of Specific Implementation Measures (EVSIM) of the planned research study as the effect of that research will only manifest itself in improved implementation (or worsened implementation) rather than full adoption. The EV of Perfect Implementation will then be reduced by the EVSIM of the research. The Expected Value of Research (EVR) in terms of both the reduction of uncertainty and the change in implementation is then the sum of the EVSIM and the EVSI because research affects both the EVPI and the EVPIM.
[image:9.595.48.499.261.601.2]The various concepts defined above are summarised in Table 1.
Table 1. Value concepts relating to decision uncertainty and imperfect implementation
Value concept Description
U
nce
rt
ai
nty
EVPI The value of resolving all decision uncertainty
EVPPI The value of resolving all uncertainty related to individual or grouped model parameters
EVSI The value of a proposed research study design in reducing uncertainty
Im
pl
em
ent
at
ion
EVPIM The value of achieving perfect implementation (from current “baseline” level)
rEVPI The value of improving implementation by resolving all decision uncertainty
rEVPPI The value of improving implementation by resolving all uncertainty caused by individual or grouped model parameters
EVSIM The value of improving implementation with a proposed implementation measure or research study design
B
ot
h
EVP The value of achieving perfect implementation and resolving all decision uncertainty
EVR The value of a proposed research study design in improving implementation and reducing uncertainty
Accruing the Expected Value of Research over the population and time horizon
EVP in each year and the discounted annual population EVPs for each year summed up to the decision time horizon.
When specific implementation measures or research studies are to be evaluated against their cost, their value will only accrue for the proportion of the population that can be reached with the cost-effective technology. This proportion of the population is the post-implementation measure implementation and it is multiplied by the affected population to obtain the EV of Specific Implementation Measures and the EV of Research for the England population. The annual discounted population EVSIM can then be summed over the time horizon the decision will remain relevant for.
Incorporating implementation dynamics in the Expected Value of Research
Making the defined value concepts dynamic
The analyses described above do not take implementation dynamics, timings of research or implementation measures into account. In this section, we describe how the elicited implementation dynamics are used in the present framework and how effects of the timing of research and implementation measures are calculated. Taking implementation dynamics into account in the calculation of the EVP requires all measures that are functions of implementation to be adjusted for the proportion of the population receiving the technology in each year up to the time horizon at which the decision ceases to be relevant. This affects the rEVPI, the EVPIM, the rEVPPI and the EVSIM.
The realisable EVPI can be calculated with the mix of technology use for each year. For example, if utilisation of intervention A was at 2% in the first year, then utilisation of comparators B and C would be at 49% each (assuming equal utilisation for the two remaining technologies, due to a lack of knowledge that suggests otherwise), and the rEVPI would be calculated according to that. In the second year, implementation of A might be at 10%, resulting in 45% of implementation of B and C, and so on. The dynamic rEVPI could be presented for every year, but to obtain an idea of the magnitude, the average rEVPI over the periods up to the time horizon is taken, with discounting of future periods accounted for.
Accruing the dynamic EVR concepts over the population and time horizon
It is important to highlight that the interpretation of the EVPI is only that of the maximum value of further research if implementation is also made perfect. If one wanted to know the maximum value of further research given that implementation remains unchanged at a low current level, the population EVPI should be adjusted by the achievable implementation.
Assessing the residual Expected Value of Perfection after research
The residual EVP after research studies are conducted can be calculated by subtracting the EVR associated with the planned research study from the EVP at the outset. For this evaluation, the population values aggregated over all periods until the time horizon should be used to reflect the value of the research to the payer. The research is then worth doing if the population EVR exceeds its cost.
The timing of implementation measures and their effects
When assessing the expected value of implementation measures in a dynamic analysis, the timing of the measure itself and its effects are crucial, as was highlighted by Claxton et al. (2011). For instance, if an implementation measure is a research study that takes two years to report from the time of decision-making, the existing EVPI will only be reduced at the time that a new decision is made based on that new research. The EVPIM may only be adjusted by the EVSIM much later, when implementation changes because of the new findings.
The residual EVP that is left after the planned research studies have been conducted is therefore the sum of the EVP in the first periods until the research reports and a decision is taken – and the sum of the post-research EVP over the remaining periods until the time horizon, where the post-research EVP results from subtracting the EVR from the pre-research EVP.
The static and dynamic EVR frameworks applied in a case study
were calculated using Probabilistic Sensitivity Analysis (PSA), based on 10,000 simulations. EVPPI values were generated using the Generalized Additive Model (GAM) regression method developed by Strong et al. (2014).
Two research studies had been identified in a qualitative study to be relevant to the adoption decision of technology A (referred to as Study I and Study II in the following). Study I would study the predictive ability of technology A and study II the response to treatment after screening with technology A. The EVPPI analysis showed that the parameters are informed by these studies were also driving decision uncertainty.
To facilitate assessing the EVR, information was needed on implementation estimates before and after these research studies were conducted. The dynamic estimates were obtained through an elicitation of expert opinions on parameters that inform an adaptation of the established model of technology diffusion (Bass, 1969). The elicitation method we developed only requires elicitation of three quantities for any multi-period diffusion curve. For the static analysis, we used the estimate of the maximum attainable number of adoptions prior and posterior to conducting further research that we obtained from that elicitation study. Of course, this assumption of a sudden jump in implementation is not necessarily realistic, reflecting the general problem with the static analysis in the dynamic context of technology implementation.
To calculate the EVSI, it was necessary to simulate the research that is planned. The process of trial data simulation has been described previously (Ades et al., 2004, Strong et al., 2015) and we followed the steps outlined there. Both research studies were designed to be one-arm observational studies, which could enable these studies to be conducted even after the technology is recommended. Statistical models for the data to be collected in both studies were specified, together with the sample size of 150 patients for each study and then a dataset from each proposed study could be simulated for each ‘row’ of the PSA on the parameters in question. That is, for each draw from the joint distribution of the PSA, we generated a sample of data for those 150 patients, sampling from a binomial distribution for both research studies. A binomial model was chosen because both studies were investigating a sample proportion with a particular response. Given the simulated data, the implied model parameters for the decision model if only the new data would be used could be calculated. We calculated the EVSI values for both research studies using the GAM regression method developed by Strong et al. (2015).
To calculate the EVSIM of both research studies with the reporting time of research accounted for, we assumed Study I to report within two years of the decision and Study II to report within three years of the recommendation decision and re-appraisal to happen at the time those studies report. In the years up to the time when the research reports (two and three years after the decision for Study I and II respectively),
Results of the static EVR analysis applied in a case study
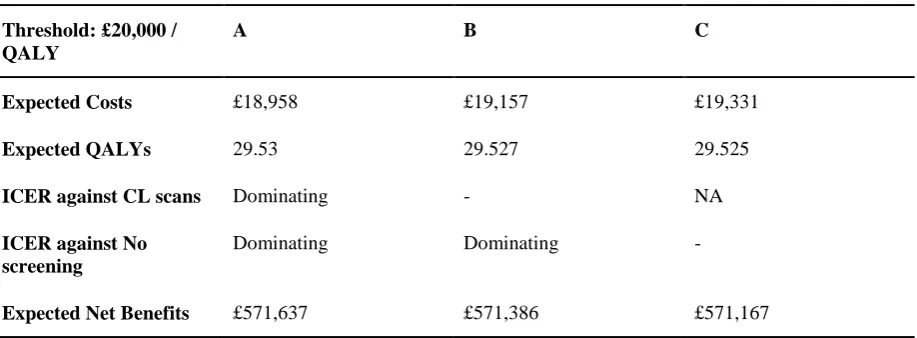
Based on the probabilistic analysis, technology A is expected to be dominating against both technologies B and C, reflecting that it is cost-saving and providing a QALY gain. The PSA results in technology A being the technology with the highest expected net benefit (Table 2). All costs and QALYs are scaled to a per person level.
[image:13.595.53.512.231.400.2]
Table 2. Model results
Threshold: £20,000 / QALY
A B C
Expected Costs £18,958 £19,157 £19,331
Expected QALYs 29.53 29.527 29.525
ICER against CL scans Dominating - NA
ICER against No screening
Dominating Dominating -
Expected Net Benefits £571,637 £571,386 £571,167
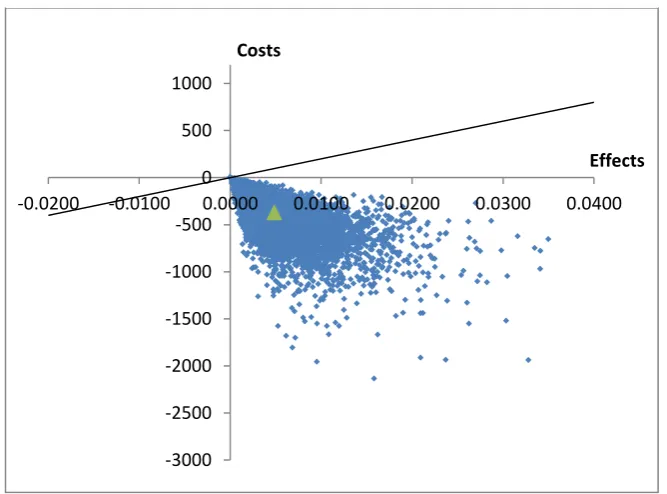
The results presented in Table 2 are associated with some uncertainty as shown in Figure 1 and Figure 2.
The above analyses showed that the per person EVPI is only £17 (see Table 3). However, accrued over the affected population in England and for a time horizon of ten years, further research could potentially be worthwhile if it reduced the uncertainty at costs that fell below the EVPI of £3 million. The EVPPI analysis
Figure 1. Cost-effectiveness plane of A against B
-3000 -2500 -2000 -1500 -1000 -500 0 500 1000
-0.0200 -0.0100 0.0000 0.0100 0.0200 0.0300 0.0400
Costs
Effects
-3000 -2500 -2000 -1500 -1000 -500 0 500 1000
-0.0200 -0.0100 0.0000 0.0100 0.0200 0.0300 0.0400
Costs
Effects
[image:14.595.55.389.418.665.2]estimated that the parameters that would be informed by the identified research studies I and II explained 93% of the EVPI.
The burden caused by low implementation was larger than the burden caused by uncertainty (Table 3). This is because implementation of the dominating technology A was low (at 30%) to start with. At a per person level, it would cost the payer £252, which over the population of affected patients over a time horizon of ten years amounts to almost £47 million (Table 3). A significant part of the EVPIM could be addressed through additional research because of the large realisable EVPI, £125 per person, which translates into almost £9 million for England over a ten year time horizon, which describes the value of resolving uncertainty in terms of changing implementation. This suggests that it may be worth conducting additional research as a means of increasing implementation, thus reducing the burden to the payer of financing other cost-ineffective screening technologies.
Together, the Expected Value of Perfection is £269 per person, or £50 million for the England population over ten years. The possible reduction in the EVP that can be achieved by resolving all uncertainty surrounding the parameters studied in Studies I and II has a value of approximately £7.8 per person or £1.5 million for the England population over ten years (see the rEVPPI in Table 3).
However, the design of Studies I and II only allows the resolution of part of the EVPPI of the studied
Table 3. Static expected value of information and implementation results Per person Population per annum (20,000 patients affected)
Population over time horizon of 10 years (discounted) U nce rt ai nty
EVPI £17 £331,143 £3.08 million
EVPPI (Parameters I) £4.07 £81,521 £759,500
EVPPI (Parameters II) £0.01 £295 £2,753
EVSI (Study I) £4.07 £81,526 £759,543
EVSI (Study II) £0 £0 £0
Im pl em ent at ion
EVPIM £252 £5.03 million £46.9 million
rEVPI £47 £938,111 £8.74 million
rEVPPI (Parameters I+II) £7.8 £156,352 £1.46 million
EVSIM (Study I) £1.9 £37,524 £107,756
EVSIM (Study II) £2.8 £56,286 £162,996
B
ot
h
EVP £269 £5.4 million £50.1 million
EVR (Study I) £5.97 £119,400 £1.11 million
EVR (Study II) £2.8 £56,286 £162,996
Figure 3. The EVP and the post-research residual EVPs
The static EVP and possible reductions in it with the two research studies are presented in Figure 3. The proposed research studies only cause a relatively small reduction in the EVP because the gain in
0 10,000,000 20,000,000 30,000,000 40,000,000 50,000,000 60,000,000
EVP res. EVP
post study I
[image:16.595.54.433.475.697.2]implementation that can be achieved by those research studies is small. The difference in size of the EVR compared to the EVP is especially large when presented at the population level, because the EVR will only be accrued for those patients who receive technology A. It could be worthwhile conducting the proposed research studies if their cost fell below the expected value of research, which at the values presented here may not be likely.
The static analysis indicates that further implementation measures are required in order to reduce the larger EVPIM but the calculation of the EVP and its reductions were based on static baseline implementation estimates that are unrealistic. Dynamic analysis is therefore required and the next section explores how results of the dynamic analysis compare to the results of the static analysis.
Results of the dynamic EVR analysis
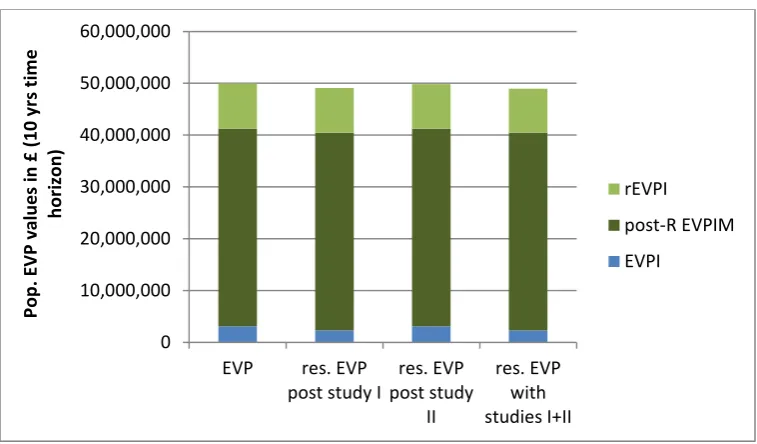
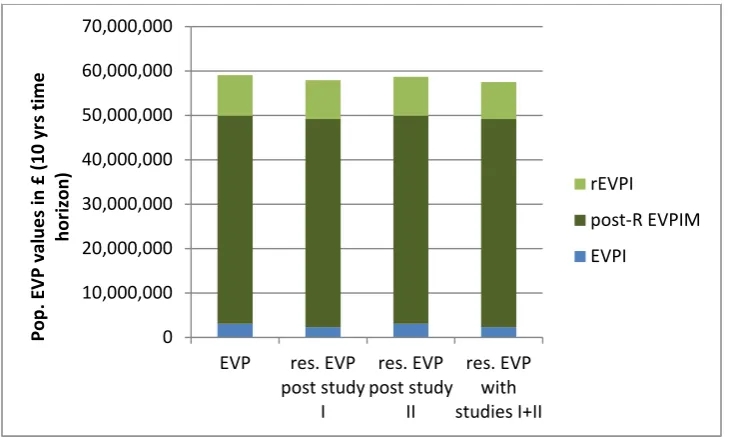
When implementation dynamics are considered (Table 4), results only differ in terms of rEVPI, rEVPPI, EVPIM, EVP and EVSIM values but not EVPI and EVPPI. Figure 4 shows that the reduction in the EVP achievable with the designed research studies remains small. This is because both the EVPIM and the EVSIM have increased and the reduction in the EVP, that is the EVR of both research studies, remains just under 2% of the EVP.
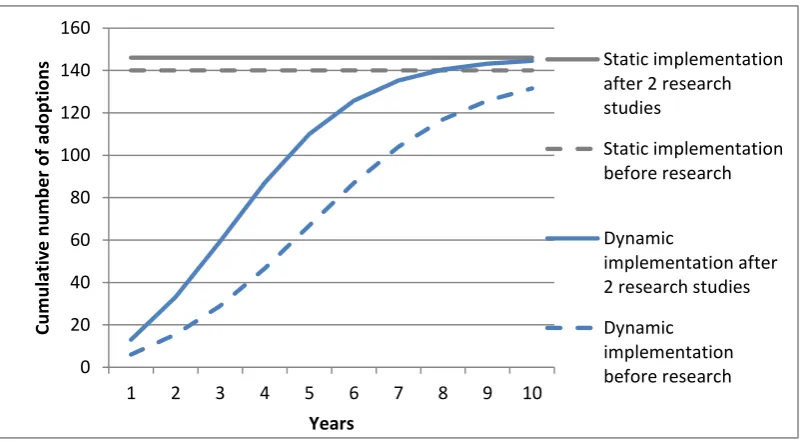
In this case study, results for all of the measures that are influenced by implementation from the dynamic analysis exceed those from the static analysis. The reason for this is illustrated through an example in Figure 5. In the static analysis, it was assumed that a favourable decision for technology A is followed by an immediate jump to the top of the baseline uptake curve, shown by the dashed grey line. Further research Studies I and II before the research recommendation would result in immediate implementation shown by the solid grey line in Figure 5.
Table 4. Dynamic expected value of perfection results Per person Population per annum (20,000 patients affected)
Population over time horizon of 10 years (discounted) U nce rt ai nty
EVPI £17 £331,143 £3.08 million
EVPPI (Parameters I) £4.07 £81,521 £759,500
EVPPI (Parameters II) £0.01 £295 £2,753
EVSI (Study I) £4.07 £81,526 £759,543
EVSI (Study II) £0 £0 £0
Im pl em ent at ion
EVPIM £304 £6.08 million £56.7 million
rEVPI £49 £984,191 £9.17 million
rEVPPI (Parameters I+II) £7.8 £156,352 £1.46 million
EVSIM (Study I) £8.2 £164,236 £409,598
EVSIM (Study II) £12.3 £246,354 £424,172
B
ot
h
EVP £321 £6.41 million £60 million
EVR (Study I) £12.27 £245,762 £1.17 million
EVR (Study II) £12.3 £246,354 £424,172
0 10,000,000 20,000,000 30,000,000 40,000,000 50,000,000 60,000,000 70,000,000
EVP res. EVP
[image:18.595.53.421.480.700.2]When the timing of research is considered and the results of the research only become available after decision making, as could be the case in a Recommendation with Research decision, the values of the EVSIM are lower than the values of the EVSIM when research reported before the recommendation decision (Table 5). The newly calculated EVSIM values, however, are still larger than the values obtained from the static analysis. The fact that the decrease is considerable is explained by the relatively large difference between diffusion curves especially in the first few periods and the discounting that would result in greater importance being placed on the periods in the near future. Figure 6 shows the reductions in the EVP when the timing of research is accounted for.
The implementation curves for the two studies and the kinks they exhibit at the time of reporting of the results compared with the (dotted) curves that could have been obtained if research reported now are presented in
Figure 7. This illustrates that the time at which research reports could have a large effect on the EVSIM. For
example, if research reported only after the ten year time horizon, the EVSIM would be zero. 0 20 40 60 80 100 120 140 160
1 2 3 4 5 6 7 8 9 10
C u m u la ti v e n u m b e r o f a d o p ti o n s Years Static implementation after 2 research studies
Static implementation before research
Dynamic
implementation after 2 research studies
[image:19.595.58.459.119.340.2]Table 5. EVSIM values at future reporting times Per person Population per annum (20,000 patients affected)
Population over time horizon of 10 years (discounted)
EVSIM (Study I) £7.44 £148,800 £324,000
EVSIM (Study II) £9.73 £194,700 £335,000
EVR (Study I) £11.51 £230,367 £1.08 million
EVR (Study II) £9.70 £194,708 £335,249
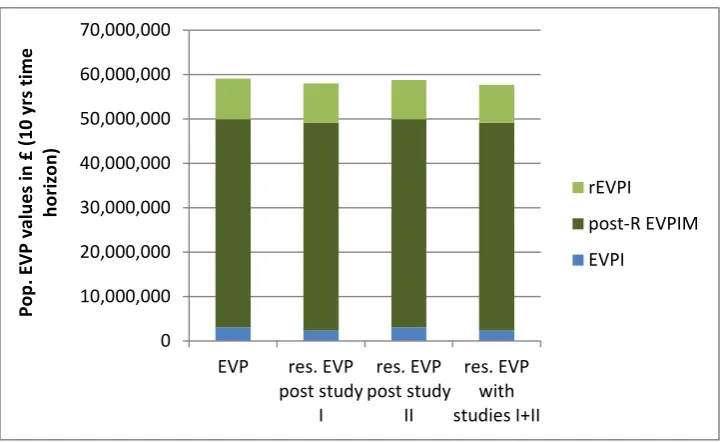
Figure 6. Dynamic EVP and post-research residual EVPs with timing of research
0 10,000,000 20,000,000 30,000,000 40,000,000 50,000,000 60,000,000 70,000,000
EVP res. EVP
Figure 7. Implementation curves with different research studies and reporting times
Even when considering the timing of research, the EVRs of the different research studies have increased considerably with the dynamic analysis compared with the static analysis, making a recommendation with research decision more valuable than under the static analysis. Whether the value of research would cover the cost of these research studies would have to be assessed in further analyses, but it appears unlikely based on the presented results.
Discussion and conclusion of the Dynamic Expected Value of Research analysis
This work has demonstrated an extension to the expected value of information and implementation framework presented by Fenwick et al. (2008) that facilitates assessing research studies for their value in terms of both the reduction in uncertainty and the improvement in implementation. This study has gone beyond other applications of the expected value of implementation (Walker et al., 2014, Hoomans et al., 2009), by considering the effect of research on implementation and by quantifying the dynamics of implementation using diffusion theory and incorporating the timing of research.
These extensions have proven significant in this case study. In the comparison of the static and dynamic analyses, it was shown that dynamic results differed considerably from the results of the static analysis. This means that incorporating implementation dynamics and the timing of research are essential when assessing the expected value of implementation measures and research.
0.000 0.050 0.100 0.150 0.200 0.250 0.300 0.350
1 2 3 4 5 6 7 8 9 10
P ro p o rt io n a l im p le m e n ta ti o n Years
Study II - 3 years reporting time
Study I - 2 years reporting time
Study II - reported now
The expected value of research may be larger than thought when only the EVPI is calculated because research may also have value in terms of increasing implementation through the rEVPI, which was identified as important by Fenwick et al. (2008). Its importance was proven in this case study, in which the impact of research on the value of implementation was much greater than the impact on the value of reduced decision uncertainty. In practical terms this could have a substantive effect on the conclusion of a value of research recommendation.
The analysis of the dynamic EVPIM could be a tool for decision-makers to recognise the impact of low implementation and the potential value of implementation measures. Although at present the reimbursement authority in the UK, NICE, does not have the mandate to decide on implementation measures other than recommending the collection of data (NICE, 2013), the dynamic expected value of research that was proposed here can support a Recommendation with Research (RwR) decision, which is one type of managed entry agreements used by reimbursement authorities and manufacturers to agree on a process of recommending a new technology (Walker et al., 2012). With this analysis, research efforts cannot only be directed to yield the largest EVSI but also to maximise implementation, thus optimising the EVR. Of course, a RwR decision requires other preceding analyses which were outlined by Walker et al. (2012), such as assessing the
reversibility of any decision, or checking for similar studies being currently undertaken in other jurisdictions. When implementation is not expected to be an issue, this approach is irrelevant in the decision-making process of a reimbursement authority. There may be some health technologies that are generally less prone to low implementation. To our knowledge, there is no standard way of identifying technologies with potentially low implementation, hinting at the need for a screening process that should precede any further analysis to identify future implementation levels. This screening process could entail qualitative interviews with relevant stakeholders and ideally an elicitation exercise to quantify implementation.
The strength of this study is the incorporation of implementation dynamics, the estimation of which is based on the theory of diffusion of innovative technologies (Rogers, 2003) and an adaptation of the Bass model of new product growth (Bass, 1969), using elicitation of expert opinions. This method, only requiring the elicitation of 3 parameters for each diffusion curve, enabled us to take the relationship between information and implementation into account. As such, it has the potential to make the assessment of implementation measures and the value of research more realistic, both in terms of the implementation that can be achieved and in terms of the expected implementation when doing nothing.
This work should add transparency to decision-making processes by highlighting the cost of low implementation to the payer. It can also be used to facilitate initiatives to improve implementation by revealing the value of implementation measures.
time of technology assessments would save the health care system resources and therefore provide health gains for patients.
The applicability of the EVR framework and the use of implementation dynamics within technology appraisals are restricted to those health technologies that may experience low implementation, which means that this knowledge is a prerequisite for this analysis. If this framework was adopted by a decision-maker, there would be additional resources required for the trial simulation and in quantifying implementation levels with and without the use of implementation measures.
Another limitation is the assumption that technologies B and C have an equal share over those patients that do not receive technology A. It is possible that one of the alternative technologies B and C may benefit from the implementation of A and push the other technology out completely. Better estimates of the implementation of B and C, conditional on implementation of A, would thus be desirable. Related to this, changes in short-term expected net benefit when the technology switch occurs that were explored in a study by Van de Wetering et al. (2012) could result in reduced EVSIM levels. This was ignored here but could be incorporated in the present framework.
The calculations of the expected value of implementation and the realisable EVPI were deterministic and did not take uncertainty surrounding implementation dynamics into account. An extension to this work could therefore include making the mentioned analyses probabilistic; that is, simulating the possible outcomes for the expected value of research when the parameters informing the implementation dynamics curves are varied. This is possible, given that uncertainty surrounding implementation dynamics was elicited.
It may be beneficial to test the dynamic EVR analysis in other exemplar technology appraisals to obtain a better overview of potential outcomes, uses of the framework and processes required to establish this analysis within technology assessments.
In conclusion, implementation dynamics can be applied in the Expected Value of Research analysis to assess the value of research studies in terms of reducing uncertainty and improving implementation, thus
complementing the currently used analyses in health technology assessments. Importantly, if dynamics of implementation are considered, then it makes sense to draw on diffusion theory and its related research. Elicitation of expert opinions can be used to estimate the relationship between information and
References
ADES, A. E., LU, G. & CLAXTON, K. 2004. Expected Value of Sample Information Calculations in Medical Decision Modeling. Medical Decision Making, 207-227.
BASS, F. M. 1969. A new product growth model for consumer durables. Management Science, 15, 215-227. BRIGGS, A. H., CLAXTON, K. & SCULPHER, M. 2006. Decision Modelling for Health Economic
Evaluation, New York, Oxford University Press.
CLAXTON, K., PALMER, S., LONGWORTH, L., BOJKE, L., GRIFFIN, S., MCKENNA, C., SOARES, M., SPACKMAN, E. & YOUN, J. H. 2011. Uncertainty, evidence and irrecoverable costs: Informing approval, pricing and research decisions for health technologies. Research paper. The University of York - CHE.
DEPARTMENT OF HEALTH 2011. Innovation Health and Wealth, Accelerating Adoption and Diffusion in the NHS. Department of Health, NHS Improvement and Efficiency Directorate, Innovation and Service Improvement.
FENWICK, E., CLAXTON, K. & SCULPHER, M. 2008. The value of implementation and the value of information: combined and uneven development. Medical Decision Making, 28, 21-32.
HOOMANS, T., FENWICK, E., PALMER, S. & CLAXTON, K. 2009. Value of Information and Value of Implementation: Application of an Analytic Framework to Inform Resource Allocation Decisions in Metastatic Hormone-Refractory Prostate Cancer. Value in Health, 12, 315-324.
NICE 2013. Guide to the methods of technology appraisal 2013. London: NICE.
OECD HEALTH PROJECT 2005. Health Technologies and Decision Making. Paris and Washington, D C : Organisation for Economic Co operation and Development p.
ROGERS, E. 2003. Diffusion of Innovations, New York, Free Press.
SERRA-SASTRE, V. & MCGUIRE, A. 2009. Diffusion of health technologies: evidence from the pharmaceutical sector. The Economics of New Health Technologies: Incentives, organization, and financing. New York: Oxford University Press.
STRONG, M., OAKLEY, J. & BRENNAN, A. 2014. Estimating Multiparameter Partial Expected Value of Perfect Information from a Probabilistic Sensitivity Analysis Sample: A Nonparametric Regression Approach. Med Decision Making, 311-326.
STRONG, M., OAKLEY, J., BRENNAN, A. & BREEZE, P. 2015. Estimating the Expected Value of Sample Information Using the Probabilistic Sensitivity Analysis Sample: A Fast Nonparametric Regression-Based Method. Medical Decision Making [Online], 2015. Available:
http://mdm.sagepub.com/content/early/2015/03/19/0272989X15575286.full.pdf?ijkey=6t1Xa911zXr OdCv&keytype=finite [Accessed May 2015].
VAN DE WETERING, G., WOERTMAN, W. H. & ADANG, E. M. M. 2012. A MODEL TO CORRECT FOR SHORT-RUN INEFFICIENCIES IN ECONOMIC EVALUATIONS IN HEALTHCARE. Health Economics, 21, 270-281.
WALKER, S., FARIA, R., WHYTE, S., DIXON, S., PALMER, S. & SCULPHER, M. 2014. Getting cost-effective technologies into practice: the value of implementation. Report on framework for valuing implementation initiatives. In: INTERVENTIONS, P. R. U. I. E. E. O. H. A. S. C. (ed.).
WALKER, S., SCULPHER, M., CLAXTON, K. & PALMER, S. 2012. Coverage with evidence
development, only in research, risk sharing or patient access scheme? A framework for coverage decisions. CHE Research Paper. York: Centre for Health Economics, University of York.
Technical Appendix
The Expected Value of Information:
(1)
Where is the expected net monetary benefit of technology d given the uncertain model input parameters .
The Expected Value of Implementation:
(2)
Where is the probability of implementing technology d with current information.
The Expected Value of Perfection:
(3)
The realisable Expected Value of Information:
(4)
Where is the probability of implementing technology d with perfect information.
Alternatively, the rEVPI can be written as:
(5)
The EVPIM is the sum of the rEVPI and the post-research EVPIM:
The Expected Value of Sample Information:
(7)
Where data X are informative for the input parameters.
The Expected Value of Research:
(8)
The dynamic realisable Expected Value of Information:
(9)
Where t=1,…,T is the time period up to the defined time horizon T, in years.
The dynamic EVPIM, rEVPPI and EVSIM:
(10)
(11)
The dynamic EVPI at population level and over the time horizon:
(13)
With representing the affected population per year and the implementation at perfect information of the technology with the maximum expected net benefit in year t.
The dynamic EVSIM at population level and over the time horizon: