DOCUMEI7
REGIONAL DEVELOPMENT
PROGRAMMES FOR DENMARK
1986-1990
3RD GENERATION
LIBRARY
COMMISSION
This document has been prepared for use within the Commission. It does not necessarily represent the Commission's official position.
This publication is also available in the following language:
DA ISBN 92-825-7122-X
Cataloguing data can be found at the end of this publication
Luxembourg: Office for Official Publications of the European Communities, 1987
ISBN 92-825-7123-8
Catalogue number: CB-48-87-517-EN-C
© ECSC-EEC-EAEC, Brussels • Luxembourg, 1987
Reproduction is authorized, except for commercial purposes, provided the source is acknowledged.
REGIONAL DEVELOP"ENT PROGRAMMES
FOR DENMARK
1986 - 1990
3RD GENERATION
This document has been prepared for use within the Commission. It does not necessarily represent the Commission's official position.
Copyright ECSC-EEC-EAEC, Brussels - Luxembourg, 1987
I General
II North Jutland
III Viborg
IV South Jutland
Chapter I, page 1.
I GENERAL INTRODUCTION
1 Characteristics of economic and social development 1981-1985
1.1 General economic development
Throughout the 1970's Denmark became a land with high inflation and with ever-decreasing competitiveness and profitability.
The domestic industries, primarily the public sector and building, showed a marked growth at the expense of competitive industry which decreased during this period. The harsh recession in the
international market as a result of the oil price shock in 1979 made it clear that new measures must be taken if economic
development was not to go off course. A structural revision of the Danish economy was required. This assumed a considerable
improvement in competitiveness, as total domestic demand had to be adapted to Danish production capabilities.
To bring about economic growth in the longer term and thereby reduce unemployment, a high level of investment in industry had to be ensured, as Danish production had to be brought to a point where it could make use of technical developments.
In recent years there has been a considerable change in the production and demand structure in the Danish economy.
In the case of production, the private sector's share of
It has contributed to the growth in Danish exports that the quotas have been relatively high within a number of specialised products where the market has grown relatively strongly. Examples of these are furniture, wooden articles, machinery, electrical apparatus and medicines.
On the other hand it is characteristic that in Denmark there is only a little production and export of the new so-called high-technology products.
A large increase in imports has however led to an unsatisfactory development in the balance of payments which by virtue of
continued tight control of the economy may have a moderating effect on future growth.
1.2 General development within a number of main areas.
1.2.1 Gross National Product
For the period 1978 to 1981 combined the growth in GNP in Denmark was considerably lower than abroad, while during 1982 it exceeded the foreign level with a growth of approx. 3% against
OECD-Europe•s growth of 2%.
The great growth in GNP took place in 1984 with an increase of approx. 4%. During 1985 growth decreased to 2.5%, approximately the same level as abroad {OECD-Europe).
1.2.2 Inflation
In nearly every single year up to 1983 inflation in Denmark has ·been above the foreign level of inflation (measured by the price
Chapter I, page 3.
1.2.3 Unemployment
The increase in unemployment which had been greater than that abroad during the years 1979 (9.6% in Denmark) to 1981 (12.3% in Denmark) became less than that abroad after 1982. Since the second half of 1983 (13.6% in Denmark) unemployment has fallen in Denmark and in 1984 it amounted to 12.9%. This tendency is expected to continue.
1.2.4 Income development
The average taxable income was DKr 53 000 in 1979 and rose during the period up to 1983 (most recent statistics) to DKr 76 000, an increase of 43%.
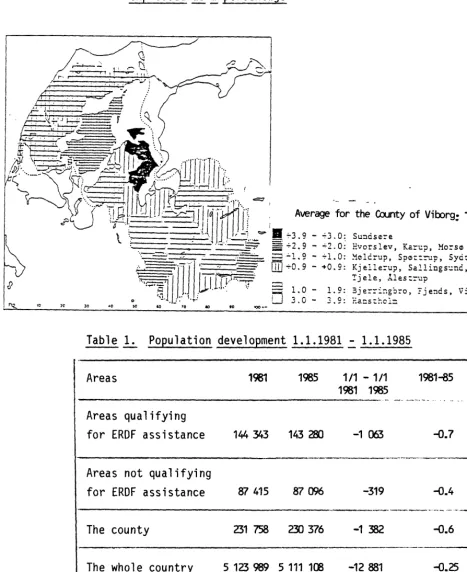
1.2.5 Population development
During the period 1981-85 the population decreased by 0.25% to approx. 5.1 million inhabitants.
1.3 Regional development
1.3.1 Employment
Employment showed regional variation~ in the years 1980 to 1984.
All the County of North Jutland and the northern part of the Counties of Arhus, Viborg and Ringk0bing were considerably worse off than the national average during this period. The same applies to the western parts of the County of West Sj~lland, Lolland
The region around the capital, the Odense region, and also Mid and South Jutland had considerably higher employment.
It could be said that the regional differences greatly increased from 1979 to 1981 and thereafter decreased slowly. This decrease has however been less than the increase from 1979 to 1981 and the regional differences are therefore still greater in 1984 than in 1979.
It is noticeable that the County of Ringk~bing, which had
employment near the national average in 1979, has since developed favourably.
Correspondingly Lolland Falster, the western parts of the County of West Sj~lland, and South West Fyn, which in 1979 were
unfavourably placed in relation to the national average, have had a development which has made their position even worse.
The employment situation in South Jutland has not developed well but since the starting position in 1979 was above the national average the position in 1984 was just a fraction below the national average.
The traditionally greatest area of unemployment in North Jutland has had near-average development and has thus neither improved nor worsened its relative position during the period 1979-1984.
1.3.2 Income development
Income development during the period 1979 to 1983 was positive with a weak tendency towards a levelling out of regional
Chapter I, page 5.
The regional distribution of income is however still very unequal, since in 1983 (latest statistics) only the Metropolitan Region and Esberg had average incomes above the national average (DKr 76 000), while the other regions were on average 8.3% below the national average. Of these the areas covered by the regional fund were on average 12% below the national average.
1.3.3 Agriculture, fisheries etc.
Within the primary sector agriculture plays by far the most important role as far as employment is concerned.
Primary sector employment is highest in the Counties of North Jutland and Viborg, which were far above the national average of
7.5% with an average employment percentage in the primary sector
of ~bout 15% in 1983.
The Counties a~ N:>rth-Jutland, Ribe, South Jutland, Fyn and Storstrem were also far above the national average with average employment of approx. 12%. ?rimary-sector employment in the areas qualifying for assistance from the regional fund was on average 2-3% higher than in the counties concerned.
In the County of North Jutland, the western part of the County of Viborg, the County of Ringkebing and the County of Bornholm
employment in the fishing industry plays an important role however, as some of the processing industries in the most
important fishing ports are connected with fishing. Employment in the areas concerned in the primary sector fell on average by 2% against 3.2% in the whole country.
1.3.4 Industrial development
In 1983 51.2% of all industrial jobs were situated in the 7 Jutland counties, while the corresponding figure for 1980 was 48.5%.
The regional variation in the relative significance of manufacturing industries grew between 1980 and 1983. The
Metropolitan Region and the County of West Sj~lland contributed to this, having a low level in 1980 and relatively weak
development.
The Counties of Ringk0bing, Vejle and Viborg have also contributed to the increased regional difference, having a high 1980 level and relatively favourable development.
Around the beginning of 1984 the Counties of Ringk0bing and Vejle were the most industrialized, while the lowest industrial
employment was to be found in the Metropolitan Region and the Counties of Bornholm and West Sj~lland.
1.3.5 The service industries
During the period 1980-83 growth in employment in the service industries slowed down greatly compared with the preceding 20-30 years.
Development in the regional variation in employment in the service industries in 1980-83 shows a rather weak tendency towards less geographical difference.
The County of Ringk0bing, which in 1980 had the lowest employment in the service industries of all the counties, has experienced less growth than the national average and hence has further
Chapter I, page 7.
The highest employment in the service industries is to be found in the Metropolitan Region, the region of Arhus and in the large towns which are the bases for large state institutions such as hospitals, institutions of higher education, county administration etc. It is also especially in these centres that parts of the private service industry such as banks, the professions and hotel and restaurant businesses are represented.
The least employment in the service industries is to be found in the western part of Jutland and otherwise in the country
districts.
1.4 The extent of the Danish areas which qualify for support from the European Regional Development Fund.
1.4.1 Enlargement of the Danish areas qualifying for support.
The Danish regional development programmes for the period
1985-1990 include all the Danish regional development areas in
accordance with the Government resolution of 1984.
The previous Danish regional development programmes included, in addition to the Greenland area, the Counties of North Jutland and Bornholm and parts of the Counties of Viborg and South Jutland.
The enlargement, which is due to Greenland•s withdrawal from the EEC, comprises parts of the following counties: Ringk0bing, Ribe, Arhus, Fyn and Storstr0m and also a number of the small islands.
The population in the areas qualifying for support in relation to the regional fund amounts to 24% of the total population of the country.
1.4.2 The municipalities qualifying for support
The regional development directorate is at present carrying out a socio-economic analysis of the regional development areas, so that any changes in the demarcation of the areas can be endorsed by the Commission from and including 1987.
The Danish regional development programmes will be reviewed in accordance with this if the case should arise.
The areas qualifying for support from the European Regional Development Fund comprise the following municipalities:
a. All the municipalities in the County of North Jutland.
b. The municipalities of Thisted, Hanstholm, Sydthy, Morse, Sallingsund, Sundsere, Meldrup, Alestrup, Fjends, Skive and Spettrup in the County of Viborg.
c. The municipalities of Samse, Mariager, Langa, Nerhald, Purhus, Randers, Rougse, Senderhald, Grena, Nerre Djurs, Midtdjurs and Ebeltoft in the County of Arhus.
d. The municipalities of Thyholm, Thybor0n-Harbo0re, Lemvig, Struer, Vinderup, Ulfborg-Vemb, Treheje, Ringkebing, Videb~k, Arskov, Brande, Holmsland, Skjern and Egvad in the County of Ringk0bing.
e. The municipalities of Fane, Bramming, Halsted and Ribe in the County of Ribe.
f. The municipalities of Tender, Hejer, Legumkloster, Bredebro, Sk~rb~k, Redding, Nr. Randstrup, Gram, Abenra, Tinglev, Redekro, Lundtoft and Bov in the County of South Jutland.
g. The municipalities of Ir0k0bing, Marstal, Tranek~r, Rudkebing and Sydlangeland in the County of Fyn.
Chapter I, page 9.
i. All the municipalities in the County of Bornholm.
j. 28 small islands without independent municipal status.
1.5 National subsidies and loans and subsidies and loans from the
-Community granted 1981-1985.
The statements concern the counties which qualified for support under the Regional Fund up unti 1 1.1.1985, i.e. the Counties of North Jutland, Viborg, South Jutland and Bornholm.
1.5.1 Regional development assistance
During the period 1981-1985 the regional development law required the authority to provide aid in the form of loans, subsidies or 1 oan guarantees.
Since 1973 regional development support has been granted for a good DKr 3 billion, for industrial investment total ling DKr 7.2 billion, representing 40% of the total industrial investment in the regional development areas. It is estimated that this has led to additional employment of 27 000 jobs.
During the period 1981-1985 the following regional development support has been granted in the areas covered by the Regional Fund:
The County of North Jutland:
Regional development support was granted for industrial investment amounting to a total of DKr 1445 mil lion. Of this a total of DKr 5 5.1 mil l ion was reimbursed from the EEC • s regional fund.
The County of Viborg:
Regional development support was granted for industrial investment amounting to a total of DKr 731 mil lion. Of this a total of DKr
7.1 mi 11 ion was reimbursed from the EEC's regional fund.
It is estimated that the industrial investment has resulted in the creation of 2275 jobs.
The County of South Jutland:
Regional development support was granted for industrial investment amounting to a total of DKr 325 mil lion. Of this a total of DKr
4.7 mi 11 ion was reimbursed from the EEC's regional fund.
It is estimated that the industrial investment has resulted in the creation of 616 jobs.
The County of Bornholm:
Regional development support was granted for industrial investment amounting to a total of DKr 192 mil lion. Of this a total of DKr 3.5 mi 11 ion was reimbursed from the EEC' s region a 1 fund.
It is estimated that the industrial investment has resulted in the creation of 385 jobs.
1.5.2 General subsidy and reimbursement arrangements
Introduction
In Denmark the State finances approx. 40% of the expenses which are met by the municipalities.
The transfers from the State to the municipalities fall into two groups: reimbursement arrangements and general subsidies.
Chapter I, page 11.
Equalization of the municipalities• facilities for maintaining a level of service which does not deviate greatly from the average municipal level of service with an average taxation percentage is mainly achieved by means of the equalization arrangements.
The State refunds 100% of the municipalities• expenditure on
retirement pensions and certain other personal payments. As a rule 50% of the municipalities• expenditure on social services is
refunded. The direct state subsidies to the municipalities- the general subsidies which are distributed in proportion to the municipalities• taxation base- have amounted to a decreasing percentage of the municipalities• expenditure and in 1986 cover approx. 15% of the net expenditure. In 1987 part of the
reimbursement arrangement described above will be changed to general state subsidies whereby this type of financing wil 1 again play a more important role in the economy of the municipalities.
The general state subsidy has a neutral effect in relation to the regional economic differences between the municipalities since changes in the total subsidy have the same significance on the taxation percentage in al 1 the municipalities.
Differences between the municipalities are equalized in an
intermunicipal arrangement which is however administered and fixed by the State.
The equalization and state subsidy arrangements are described in greater detail below.
The curr~nt general subsidy and equalization system
The subsidy and equalization system consists of three elements: a) an arrangement for equalizing the expenditure requirement, b) an arrangement for equalizing the taxation base,
c) a general state subsidy.
The arrangements will be described in this order.
~Equalizing the expenditure requirement
A municipality•s expenditure requirement is calculated by taking into account a number of factors which affect expenditure: the number of children under school age in the municipality, the number of children of school age, the number of old people, the number of people with special social needs.
The expenditure requirement is expressed in DKr per inhabitant. The average expenditure requirement is - in 1986 - approx. DKr 15 000 per inhabitant.
Equalization consists of municipalities with expenditure requirements below the average paying a contribution to the municipalities with expenditure requirements above the average.
In practice it is only approx. 1/3 of the differences between the primary municipalities which is equalized.
Within the Metropolitan Area there is however a special extra equalization. It is calculated in principally the same way and it means that just under 2/3 of the difference in the expenditure requirement is equalized.
For the counties concerned 4/5 of the differences in the
expenditure requirement in all parts of the country is equalised.
£1
Equalization of differences~ the taxation baseChapter I, page 13.
The national average in 1986 is approx. DKr 60 000 per inhabitant.
Equalization consists of municipalities which have a high taxation base paying a contribution to municipalities which have a low taxation base.
For the differences to be fully equalized the subsidy and liability should correspond to the value of the tax on the differences in the taxation base.
In practice it is only approx. half of the differences between the primary municipalities which is equalized.
In the Metropolitan Area there is however an extra equalization of approx. 30%, so that in al 1 approx. 80% of the differences between the municipalities in the Metropolitan Area is equalized.
For the counties concerned the equalization is approx. 80%.
£1
The State subsidyAs stated equalization takes place by the municipalities making payments to each other. In addition to this the State grants a subsidy which is primarily determined historically. It was not considered desirable that the great obligations and burdens
connected with municipal reform after 1970 should lead to a growth in municipal taxation and the municipalities were therefore
compensated for this by the introduction of the general subsidies.
Today the main role of the state subsidies is to maintain the balance between national and municipal taxation.
The subsidy is also regulated in line with changes in the obligations and burdens which the State imposes on the
municipalities. If the municipalities are given a new obligation, the subsidy is increased (the so-cal led total balance principle).
Since the subsidy is not to be equalized it is divided between the municipalities so that it has the same tax value everywhere. If there were no subsidy, al 1 the municipalities would have to increase taxes by the same amount.
The general state subsidy to the municipalities in 1986 is approx. DKr 3.5 billion and the subsidy to the counties is approx. DKr 11.5billion.
The Danish Government have however decided that from 1987 a number of social reimbursements wil 1 be transferred to the general
subsidies.
In accordance with current legislation the municipal block subsidy wil 1 therefore amount to approx. DKr 15 billion in 1987 and the county block subsidy wil 1 amount to approx. DKr 12 billion.
Reimbursements
In the social field, state reimbursements of the order of DKr 70 billion are provided. Most of this, approx. DKr 50 billion, is paid as 100% reimbursement on expenditure for social pensions (retirement and early retirement pensions), child allowances and rna i ntenance a 11 owance in the event of i 11 ness or childbirth. Most of the remaining DKr 20 billion is paid as 50% reimbursement of municipalities' expenditure on social institutions (nursery
schools, day nurseries, nursing homes etc.) and social assistance. A smaller part of the amount concerns expenditure on health
visitors etc. in the primary health sector.
As mentioned above reimbursements corresponding to approx. DKr 12 billion are to be changed in 1987 to general subsidies. This concerns reimbursements for the social institutions and the
Chapter I, page 15.
Special subsidy arrangements
In addition to the general arrangements described above, the state grants various subsidies to municipalities with special economic problems.
This is a matter of subsidies to disadvantaged municipalities which are for relieving special economic problems which have resulted in a high tax burden and other special problems. The special problems arise in particular when the municipalities have extreme criterion-values, for example many old people or many school children, or where the taxation base is very low. This subsidy is distributed as is deemed necessary. In addition subsidies are granted for shipping services to certain smal 1
islands, for municipalities with particularly many immigrants and, to a limited extent, to individual municipal development projects and the like. Finally in the area of health, various specific subsidies are granted for dialysis and other special functions.
Table.!.:_ Summary of general subsidies to the ERDF-areas for the period 1981-85
DKr 1000 1981 1982 1983 1984 1985
Storstn?Jm 350843 39'-t 520 402 926 444 431 4(f) 954
North Jutland 2 297 298 2 614 652 2 695 484 2 857 3(£) 2 713 (29
Bornholm 243 065 272 754 278 723 ~ 501 282 240
Fyn 121 583 138928 141 184 1!£) 733 149 044
South Jutland 551 895 633 645 f:/)5 212 705 242 677 227
Ribe 291 811 338 4~ 348 117 3t/) 998 343 423
A rhus 724 485 835 ~ 858959 913 345 868 038
Viborg 731 102 844 396 879 WYJ 942 4(j3 859 ~
Ringk0bing 379 188 440 508 449 041 478 770 453 530
1.5.3 Support from the European Regional Development Fund
.
a) The greater part of the Danish share, around 80%, was to be used for projects in Greenland.
b) That part of the quota which was left for the rest of Denmark was to be used to support commercial investment and to support investment in infrastructure in a minority of the Danish
regional development areas.
Following Greenland•s withdrawal from the Community as of 1.1.85 the Government resolved that the reduced Danish share of the regional fund was to be used in al 1 the Danish regional development areas.
The subsidies from the regional fund for the period 1981-85 for the Danish areas previously qualifying for support and for 1985 for the areas included in those qualifying for support as of
1.1.85 are shown below.
In the period 1981-85 subsidies were granted total ling DKr 196 mil lion for the partial financing of capital costs of DKr 540
mil lion in connection with 54 infrastructure projects in the
Counties of North Jutland and Bornholm and part of the Counties of Viborg and South Jutland.
Chapter I, page 17.
Table~ Distribution of ERDF support for the period 1981-85
ERDF-. Number of projects Subsidy (millions) Total
investment
North Jutland 20 130.0 346.0
Viborg 18 22.0 60.0
South Jutland 10 28.0 80.0
Bornholm 6 16.0 54.0
Ringk0bing* 3 12.5 25.0
A rhus* 6 12.5 25.0
Ribe* 2 2.3 7.5
Fyn* 1 1.2 2.5
Storstr0m* 2 2.8 5.6
Total 68 227.3 605.6
*Only subsidy in 1985.
1.5.4 The EEC's agricultural policy/EAGGF's subsidy schemes
The agricultural structure policy is of special regional interest because of economic assistance for the modernization of
agricultural undertakings and assistance for structural projects in connection with the processing and marketing of agricultural products. The two schemes referred to are supported by EAGGF's development section.
Community assistance for the modernization of agricultural undertakings amounts to 25% of the approved measures.
Assistance for structural projects only covers the secondary sector of agriculture (dairies and slaughterhouses), and is
By far the largest part of the assistance is received in Denmark by the slaughterhouse and dairy sector.
The regional effect of the two forms of assistance becomes noticeable in areas of high agricultural production- animal production in particular.
The areas covered by the Regional Fund include the Counties of North Jutland and South Jutland. Here there has been a slowing-down in the reduction of employment in rural districts, both
directly in the agricultural sector and indirectly in undertakings that supply agriculture with feedstuffs and fertilizers and
process agricultural production.
Within the counties that include areas covered by the Regional Fund, total planned investment amounted to DKr 1185 mil lion, of which the EAGGF is expected to grant a subsidy of approx. DKr 300 million.
Total planned investment amounted to DKr 1185 mil lion, of which the EAGGF is expected to grant a subsidy of DKr 300 mil lion.
Table 3. EAGGF subsidies for development plans 1981-84
County Development plans DKr million
Bornholm 5 4.0
South Jutland 240 222.0
Viborg 137 111.0
North Jutland 214 184.0
Chapter I, page 18 (cont.)
Within the areas referred to above the following investment in structural projects was made during the years 1981-84:
Table 4. EAGGF subsidies for structural projects
County Structural projects EAGGF subsidies
Bornholm 50.0 7.8
South Jutland 54.0 6.7
Viborg 51.0 9.3
North Jutland 152.0 24.6
1.5.5 The European Investment Bank•s activities~ the areas covered~ the Regional Fund (ERDF-areas)
During the years 1981-84 the European Investment Bank granted loans to Denmark amounting to DKr 6487 mil lion, consisting of DKr 1121 mil lion in 1981, DKr 1715 mil lion in 1982, DKr 2105 mil lion in 1983 and DKr 1546 mil lion in 1984.
The loans were granted to the Danish Government partly to finance State projects and partly as a global loan for lending onwards to smal 1 and medium-sized undertakings, predominantly through the Directorate of Regional Development. In addition, direct loans were granted for large private and municipal projects.
In 1981 the Danish Government took up global loans total ling DKr
75 mil lion for financing small and medium-sized projects in the ERDF-areas. In addition loans granted to State and municipal projects for implementing the Community•s energy policy amounted to DKr 932 mil lion.
In 1982 over half of the loans were made available for projects to
reduce the Community•s dependence upon oil, DKr 820 mil lion. The Danish Government took up a global loan for further distribution to small and medium-sized undertakings in the ERDF-areas total ling DKr 50 mil lion.
In 1983 the Investment Bank•s loans for energy projects were
doubled to a total of DKr 1704 mil lion. Four new global loans were made available for Danish borrowers for the advancement of smal 1 and medium-sized undertakings in the ERDF-areas total ling DKr 50 million.
In 1984 the Danish Goverment took up a global loan of DKr 40
Chapter I, page 20.
In addition to the loans granted by the European Investment Bank from its own funds, Denmark received NCI loans total ling DKr 2741 mil lion during the period 1981-84.
NCI (the new Community instrument for the taking up and granting of loans) loans were granted for investment projects by smal 1 and medium-sized undertakings, the rational use of energy and
infrastructure for encouraging regional development. DKr 1861 , mil lion of the loans granted was used for improving the natural
gas network and processing equipment.
It is not possible to give a regional breakdown of the loans granted.
The volume of assistance granted to areas covered by the European Regional Development Fund (ERDF-areas) is of special interest.
In the County of North Jutland, a total of 33 commitments was made during 1980-84- amounting to approx. DKr 64 mil lion - to smaller and medium-sized undertakings as global loans.
In the ERDF-areas in the County of Viborg, during the same period, there were 25 commitments amounting to a total of DKr 41.2
million.
In the ERDF-areas in South Jutland, there were 5 commitments during the period amounting to a total of DKr 32.8 mil lion.
Bornholm received 3 global loans amounting to approx. DKr 6 mil lion during the period 1980-84.
Concerning large projects within the Regional Fund areas, during the period 1980-84 the following loans were granted: 2 loans total ling DKr 60 mil lion for a marine research centre in
Hirtshals, a loan for the widening and deepening of the shipping channel from Alborg harbour to Kattegat total ling DKr 68 million, 2 loans total ling DKr 15 mil lion for the modernization of Tejn harbour on Bornholm and a loan of DKr 15 mil lion for the
2. Prospects for future development 1985-1990
2.1 Economic development
During the period up to 1990 continued positive economic
development is expected, and a real increase in GNP is expected to continue at the same level as during the period 1983-1985, i.e. on average 3 - 3 1/2%.
As a special economic development prospect, the production of oil and natural gas in the Danish sector of the North Sea is expected to play an important role in the Danish economy in the years up to 1990.
It is assumed that production will rise by nearly 25% per year on average, so that the value of the production of oil and natural gas in 1990 is estimated to amount to approx. 2 1/2% of GNP (at current prices) against nearly 1% in 1984.
It is therefore assumed that domestic production will meet 50% of energy consumption in 1990.
2.2 The labour market
The continued growth in production is expected to lead to a reduction in unemployment of about 215 000 people in 1990.
The reduction in unemployment is a net result of an expected
Chapter I, page 22.
This projectional lows for approx. 110 000 more employed in the private sector in 1990 than in 1985, of which approx. 40 000 in industry.
2.3 Bottleneck problems
In a situation where the private sector is looking for extra workers there is a risk of there being bottleneck problems.
This is due to the fact that for the past 20 years the education system has been mainly designed to meet the growing demand for workers from the public sector.
Considerable demands wil 1 therefore be made for the labour market and the education system to adapt.
If the private sector cannot have its demand for a qualified work force met in the years to come there is partly a danger of
pressure on salaries in the areas where there are shortages and partly a danger of lower rises in productivity if it should become necessary to use labour without the proper qualifications.
2.4 Regional prospects
The question is whether industrial development can be expected to continue to favour the Jutland fringe areas in particular or whether on the contrary there are signs that in the future expansion wil 1 take place in other parts of the country.
In the rather longer term it could be possible that development will change in character.
One of the circumstances which could be an ever greater problem in the future for industries in the fringe areas is access to skilled
labour in the individual localities.
Some of the most important reasons for this include:
-Decentralisation and moving towards the west of industrial production has not resulted in a corresponding movement of educational institutions. This applies especially to higher education.
-The demand from industry for highly qualified labour has been-and will continue to be·- on the increase been-and higher education in particular is concentrated around Copenhagen, Arhus, Odense and Alborg.
-The geographical mobility of the work force will probably continue to decrease, among other reasons on account of the increasing employment of women.
- For labour with both technical and economic training there is a favourable employment situation which makes it extra difficult for undertakings situated far from the educational institutions to attract these types of labour, which are among the most sought-after of those with higher education.
The regional distribution of employment in the service industries shows a concentration in the large urban communitities and in the eastern part of the country.
Those parts of the country which do not have large urban communities and which are situated in remote areas have, in addition to employment in agriculture and fishing, in the main only employment in manufacturing industries as an alternative to enable them to maintain the economic activity of the population and maintain reasonable standards of living. Employment in the manufacturing industries in these areas must therefore be
Chapter I, page 24.
Areas dominated by individual large undertakings or characterized by a pronounced industrial monostructure (the textile industry, fisheries, shipbuilding industry, the timber and furniture industry) must be developed in the direction of a more
differentiated industrial structure in order to reduce sensitivity to the state of the market and thereby reduce the risk of serious regional development problems.
2.5 Fisheries
It is still too early to give a precise evaluation of the effects of the Community's fisheries policy upon production and employment in the areas of Denmark which are dependent upon fisheries, among other reasons because the importation of raw materials must be taken into consideration.
It is however obvious that the regulations laid down will mean a reduction in production and employment.
An attempt can be made to counteract this negative effect by
fishing for species which are not endangered and are not therefore subject to restrictions. This presupposes an alteration in
fisheries and the fisheries industry which would require previous research and product development.
In addition there could be a higher level of improvement to known products.
This creates important assumptions for compensatory development in these areas.
Putting the guidelines laid down by the Community for the special Community action into the form of a programme was begun in co-operation with the regional authorities and the programme is expected to be put before the Commission by the end of 1986.
3. Regional policy
3.1 Main elements
Industrial policy and labour market and education policies form the most important links between general economic policy and region a 1 po 1 icy.
The geographical dimension in regional policy is contained in national planning policy and regional development policy.
Regional development assistance and assistance from the EEC's Regional Fund represent important implementation instruments in the regional policy.
3.2 Main ~
Even if regional development assistance has had a favourable effect upon development in the weaker areas, the goal has not yet been reached.
Chapter I, page 26.
By calculating the level of development in accordance with different criteria (employment, levels of income, degree of industrialization, the importance of the service industries, the distribution of different age groups and the extent of industry) it has been found that there are still marked differences between parts of the country which provide ample justification for
continued regional development assistance to the weaker areas.
In the regional development areas considered together, the
unemployment percentage has been 22% above the national average in recent years and taxable income has been 13% lower than in the country in general.
The main aims of regional policy are therefore stil 1 to encourage development in the weaker regions, including encouraging the use of modern technology in manufacturing industries and the
development of new products intended for the international market.
3.3 Development strategy
In order to maintain and develop Danish production in growth areas it is vital that undertakings in general but in particular in the weaker regions are encouraged to invest in the new production processes which modern technology can offer.
Industrial policy and the contribution of the State in research and education must to the highest possible degree encourage industries to move into growth areas.
In the field of industry, industrial policy will be redirected to a greater extent from solving the problems in industries hit by crises, including interest assistance arrangements, towards
The technological development programme is an example of such a change. Approx. DKr 1.5 billion has been earmarked for this programme for up until the end of the 1980's.
Within the framework of the EEC, Denmark is also participating in a number of large research programmes which will also contribute to breathing new life into industry. These include programmes within the fields of computing, information technology (ESPRIT), basic technical research and the use of new technologies {BRITE), biotechnology and energy.
At national level, an effort is being made to develop the two largest centres in the weakest areas, Esbjerg in the south-western part of Jutland and Alborg in North Jutland, into provincial
centres containing a number of main service facilities etc. on an equal footing with Arhus in East Jutland, Odense in Fyn and
Copenhagen which is both a provincial centre and the national centre.
Within the individual regions an .effort is being made to build up a network of towns in a hierarchy with in principle one regional centre supplemented by a number of smaller centres of decreasing size.
The aim is to create a fair and varied supply of labour, jobs, public and private services, energy and transport within a given geographical area. In the national assistance areas there are considerable difficulties associated with realizing this development strategy, where for example the supply of public services in a number of areas of education is below that assumed by regional planning.
Chapter I, page 28.
In general development within the manufacturing industries in the weaker areas must be encouraged to constitute a greater share of total employment than the national average to compensate for the lack of public jobs.
3.4 Important partial goals~ regional policy
-to form effective and flexible frameworks for-industrial development by means of planning at regional and municipal level,
- to encourage co-ordination between local industrial development and local work-orientated education,_
- to encourage the use of information technology in smal 1 and medium-sized undertakings which dominate the weaker regions,
- to consider regional development problems in the administration of general measures to encourage technology,
- that when granting assistance within the national support areas corresponding to the areas covered by the ERDF, an attempt is made to achieve localization which is appropriate for industry and which fits in with other measures to encourage development which the State has implemented or considers implementing.
- that the development of the 27 smal 1 Danish islands which amount to a special support area is to be encouraged as much as
possible, partly by means of financial support and partly by positive discrimination in administrative affairs.
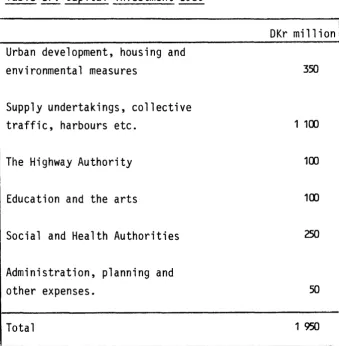
4. Public investment programmes and resources
4.1 National investment of importance for the regions
A considerable part of the investments which are included in the public investment programme contribute towards achieving the required infrastructure.
This is a matter of investment within the traffic and
communication sectors, investment in supply systems for e.g. gas and electricity and the investments which are implemented by
licensing the utilization of Danish energy resources in the North Sea.
The investment programme comprises government and municipal
investment and also investment in licensed companies. In addition private investment is included which is subject to public
regulation, including publicly assisted building.
The investment programme is composed of two parts, a basic • programme containing the investment projects which have already
been included in budgets and agreed upon with an estimate of a realistic course of investment during the period 1989-94 and also a supplementary programme of projects which are still being
Chapter I, page 30.
Table 5 The public investment programme 1984-94
Price and 1984 1985 1986 1987 1988
wages level 1985
Budgets/projections 12.1 14.8 12.9 12.7 10.3
Energy supply
Traffic 5.8 5.6 5.5 5.5 5.3
Communications 3.2 3.1 3.1 3.0 2.9
Housing 7.2 7.6 7.6 7.6 7.6
Services etc. 14.9 15.9 15.6 14.6 14.3
Total 43.2 47.0 44.7 43.4 40.4
Supplement
Bridge for road and rail
over Store BCElt*
-
-o.o -o.2 -o.2 -o.2Hybrid network
-
0.3 0.5 0.6 0.5TV-2
-
-
0.2 0.2 0.1Housing area
-
-
-D.1 -D.4 -D.6Total
-
0.3 0.4 0.2 -o.2Investment programme
including supplement 43.2 47.3 45.1 43.6 40.2
* Extra expense compared to implementation of combining ferry services.
Source: Budget statement 1985
1989-94 average per year
9.5
5.4
2.8
7.4
13.6
38.7
1.5
0.2
--D.6
1.1
[image:36.576.41.479.77.565.2]4.2 Special regional support arrangements
Regional development support
In February 1985 the Danish Government passed a new law concerning regional development support which among other things abolished low-interest loans as a means of support along with a couple of seldom used financing instruments of lesser importance.
As compensation, total resources for support in the form of
Chapter I, page 31.
Subsidies cannot exceed 25% of capital costs but in priority areas this is increased to 35%.
The potential for giving investment loans to municipalities for partial financing of industrial building for sale or rent is maintained at the same level as before.
There wil 1 continue to be financial assistance in the form of global sub-loans from the European Investment Bank.
It is expected that approx. DKr 600 mil lion wil 1 be used in support during the period 1986 to 1991 as capital subsidy, while it is expected that approx. DKr 130 mil lion wil 1 be granted in loans to municipal industrial building. It is expected that support will be granted to the smal 1 islands (traffic support etc.) amounting to approx. DKr 55 million within the same period.
4.3 ERDF resources
ERDF resources (at present approx. DKr 80-100 mil lion per year) are intended for use within al 1 the national support areas. An effort is made to distribute the resources fairly, which means that approx. 2/3 wil 1 be used within the priority areas.
Approx. 40% of ERDF resources is intended to be used for industrial investment, mainly for industries with high use of technology and export-oriented production.
Special importance wil 1 be placed upon the question of employment and also the matter of diversification in the area of industry.
Stress wil 1 be put upon encouraging in general smal 1 and medium-sized undertakings to make use of modern technology and also upon the removal of obstacles within the field of communications where this is of special significance for the development of industry.
It is the intention to use to an ever greater extent national programmes of interest to the Community in connection with encouraging development within the ERDF-areas.
The support resources in connection with the special fisheries action (approx. DKr 100 mil lion over 5 years) are intended to be used within the given framework in such a way that total
investment during the period of the programme amounts to approx. DKr 500 mi 11 ion.
5. Implementation
The implementation of regional development programmes takes place in co-operation between the central and the regional authorities.
The programmes are for guidance only and can be altered or changed as a result of statutory reviews of the regional plans approved by the Government.
The regional programmes• investment plans are likewise of an advisory nature and can be adjusted in connection with annual regional budgeting.
The elected county councils are responsible for the preparation of proposals for the regional development programmes in accordance with the centrally approved regional plans.
Central acceptance of the development programmes of the regions qualifying for support and concrete proposals for support from the EEC•s regional fund takes place in a committee under the Ministry
of Industry representing the Prime· ~1inister's Department, the iJiinistry
o·f ::oreign Affairs, the f·linistry of Finance, the i'linistry of Labour,
the Ministry of Agriculture, the Winistry of Fisheries, the Directorate
Chapter I, page 33.
On the initiative of the Regional Development Directorate annual meetings are held between the individual county councils of the areas qualifying for support, the Regional Development Directorate and the Planning Board, where the county councils• proposals for projects and programme initiatives for putting into effect the regional development programmes are given preliminary priorities.
II REGIONAL DEVELOPMENT PROGRAMME
THE COUNTY OF NORTH JUTLAND
This county, which is the most northerly in Denmark, covers an area of 6172 km2 with a population of 482 000, which corresponds
to a population density of 78 people per km2
• North Jutland is the
country's largest county measured by area and the fourth largest measured by population.
Administratively, the county is divided into 27 municipalities, of which the largest - Alborg - has 155 000 inhabitants. It is
therefore the country's fourth largest urban area. In addition, the county has two large boroughs Hj0rring and Frederikshavn -each with more than 30 000 inhabitants.
The entire county is a special regional development area and the Government has decided that the county as a whole wil 1 continue to fall under the European Regional Development Fund.
The adopted regional plan for North Jutland divides the county into 7 regions. The regions have characteristic differences in industrial structure, since some regions are dominated by agriculture, others by fishing and others by industry. The division into regions is based partly upon information about commuting conditions and partly upon historical conditions based upon commerce. The regions are defined in such a way that home to workplace commuting mainly takes place within the same region.
Against the background of the regional divisions a network of towns has been appointed which wil 1 act as regional and municipal centres and as localization points for industry and public and private service.
Chapter II, page 2.
1. Social and economic development
a. General development
Population
During the period 1980-85 the population has increased by 0.1% to 481 963. The marked net migration into the county throughout the 70's has decreased considerably and this combined with the falling birthrate has resulted in a small increase in population.
During the same period the population of the country as a whole has fa 11 en by 0.2%.
Table~ Population development 1980-85
The county
The whole country
1980
481.335
5.123.989
Source: D.S. Population
1985
481.963
5. 111.108
1980-85
Absolute %
628 +0, 1
-12.881 -0,25
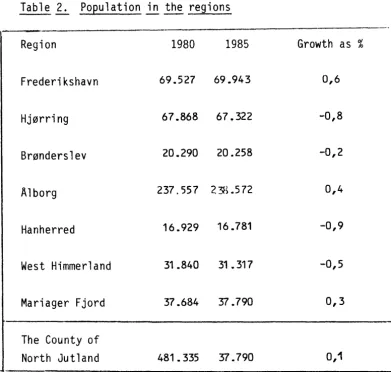
Table 2. Population~ the regions
·---·,
Region
Frederikshavn
Hj0rring
Br0nderslev
Alborg
Hanherred
West Himmerland
Mariager Fjord
The County of North Jutland
1980 1985
69.527 69.943
6 7 • 86 8 6 7 • 32 2
20.290 20.258
2 37 . 55 7 2 38 . 5 72
16.929 16.781
31.840 31.317
37 .684 37.790
481.335 37.790
Growth as %
0,6
-0,8
-0,2
0,4
-0,9
-0,5
0,3
0,1
Source: D.S. Population in the municipalities as of 1st January each year.
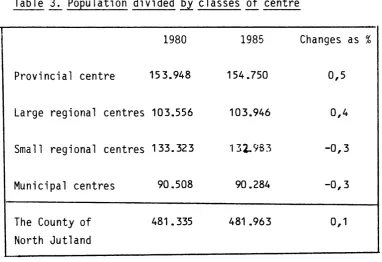
In relation to the centre classes in the regional plan, the growth in population has been linked to the provincial centre and
[image:43.569.64.455.75.447.2]Chapter II, page 4.
Table ~ Population divided by classes of centre
1980
Provincial centre 15 3. 948
Large regional centres 103.556
Small regional centres 133.323
Municipal centres
The County of North Jutland
Source: D.S. Population
Employment development
90.508
481.335
1985 Changes as %
154.750 0,5
103.946 0,4
132.. 9£3 -0,3
90.284 -0,3
481.963 0,1
During the period 1981-83 the total employment situation became a 1 ittle worse. In Denmark as a whole employment fell by 0.04% against approx. 0.3% in North Jutland.
[image:44.564.107.490.80.342.2]Table~ Employment development
Number of employed people living in the area.
Areas Agriculture Manufacture, Service, Total
building and transport,
construction commerce
_,_ _______
Absolute % Absolute % Absolute % Absolute %
Qualifying for ERDF support:
1981* 2.8 937 13,0 60 184 27,0 133 387 60.0 22 508 100 1983* 27 982 12,3 58 765 26,0 139 668 61.7 226 415 100 1981-83** -955 -3.3 -1 419 -~._£..__±Q 281 4.7 3 907 1 .. 8 North Jutland:
1981*
-
-
-
-
-
-
-
1001983*
-
-
-
-
-
-
-
1001981-83**
-
-
-
-
-
-
-The whole country:
1981* 195 743 7.6 649 559 25.2 1 730 028 67~ 2 2 575 330 100 1983* 189 472 7_5 640 827 25,21712 403 67. 3 2 542 702 100 1981-83** -6 271 -3~2 -8 732 -1.3 - 17 625 -1,0 - 32 628 -1,3
*
Relative share ** Growth percentageSource: D.S. S:E. Labour market.
In North Jutland, as for the country as a whole, employment
development has been characterised by a decline in agriculture and in the building, construction and manufacturing category. However development in this category covers two contradictory tendencies, since the manufacturing sector has shown a growth in employment during this period while the building and construction sector has had a fall in employment due to its extreme sensitivity to the state of the market and high interest rates. The service,
Chapter II, page 6.
Table ~ Employment structure ~ industry.
North The whole Change 1980-84
Jutland country North The whole
1980 1984 1980 1984 Jutland country
% % % % % %
Production of 0~6 0~7 0 .. 3 0.3 17. 5 -11. 5
raw materials
Food, drink and
tobacco 27.6 26.7 19.5 19.8 16.4 0.8
Textiles and
clothing 5 .. 3 4~8 7.6 7.8 -3.9 1 "6
Timber and furniture
industry 4.5 4.4 5.7 6~3 3.3 10.5
Paper and printing 5.3 5.1 9.1 8.8 8.1 -3 .. 9
Chemical industry 3.6 4.0 9,4 9.8 16., 1 3~2
Stone, clay and
glass industry 10u5 9"4 5.,7 4 .. 7 -7"9 -19.6
Iron and metal
enterprise 1. 3 1. 3 2.0 1. 6 10. 1 -19.4
Iron and metal
industries 41.0 42.6 39.3 39.6 9.4 -0.3
Others 0 .. 3 0-6 1 ~ 6 1.5 104 .. 7 -7.2
Total 100 ... 0 100~0 100.,0 100 .. 0 5.0 -1.:0
[image:46.572.85.528.82.674.2]In North Jutland employment in industry rose during the period 1980-84 by approx. 5%, against a drop for the whole of Denmark of approx. 1%.
This growth in employment has been especially within the following lines of business: the food, drink and tobacco industries, the chemical industry and the iron and metal industries.
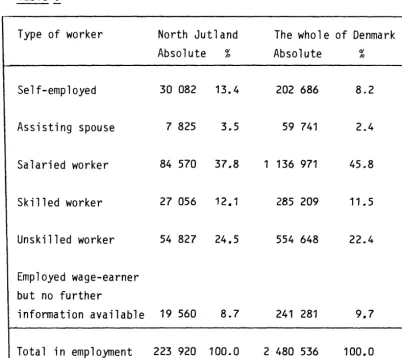
The distribution of employment by type shows that there is a
Chapter II, page 7.
Table 6
Type of worker North Jutland The whole of Denmark
Absolute % Absolute 0/
/0
Self-employed 30 082 13.4 202 686 8.2
Assisting spouse 7 825 3.5 59 741 2 .. 4
Salaried worker 84 570 37.8 1 136 971 45 .. 8
Skilled worker 27 056 12.1 285 209 11 .. 5
Unskilled worker 54 827 24.5 554 648 22 .. 4
Employed wage-earner but no further
information available 19 560 8.7 241 281 9.7
Total in employment 223 920 100.0 2 480 536 100.0
Source: Register-based employment statistics. Specially prepared for North Jutland and "News from Danish Statistics"
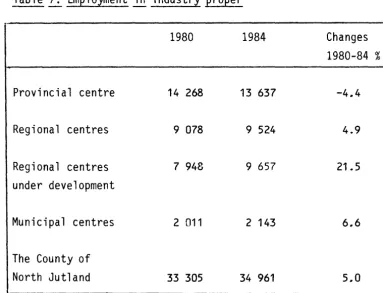
[image:48.579.104.506.89.446.2]Table ~ Employment~ industry proper
Provincial centre
Regional centres
Regional centres under development
Municipal centres
The County of North Jutland
1980
14 268
9 078
7 948
2 011
33 305
1984
13 637
9 524
9 657
2 143
34 961
Source: Industrial statistics (own calculations)
Changes
1980-84 %
-4.4
4.9
21.5
6.6
5.0
[image:49.574.71.455.82.375.2]Chapter II, page 8.
In addition there is a tendency towards industrial growth in the weaker regions. In particular the regions Hanherred, West
Himmerland and Mariager Fjord have had an expansion in manufacturing industry.
Table 8. Employment~ industry proper, 1980 and 1984, ~
regions~ North Jutland.
Region 1980 1984 Change
Absolute %
Frederikshavn 6 256 6 615 359 5.7
Hj0rring 4 101 4 330 229 5.6
Br0nderslev 1 525 1 490 -35 -2.3
Alborg 16 472 16 603 131 0.8
Hanherred 757 887 130 17.2
West Himmerland 1 602 1 991 389 24.3
Mariager Fjord 2 592 3 045 453 17.5
County of North Jutlan~3 305 34 961 1 656 5.0
Tab 1 e 9. Unemp 1 oyment. Unemp 1 oyed converted to fu 11-t ime unemployed~! of the number insured
1981 1984 1981-84
Absolute % Absolute % % increase on abso 1 ute figures
The county 27.368 16,6 30.006 16,4 9,6
The whole 216.588 12,3 240.051 12,9 10,8
country
Source: D.S. Unemployment statistics.
The unemployment percentage (insured unemployed as % of the total number insured) rose from1.2 .• 3% in 1981 to12.9% in 1984 for the country as a whole and it fell from16.6.% in 1981 to 16.4% in 1984
in North Jutland.
The difference between the unemployment percentage in North Jutland and in the whole of the country is thus almost unchanged and unemployment remains considerably higher in the North Jutland area.
Employment rates in North Jutland are lower than in the country as a whole, especially for women. It is expected however that over the next 5-10 years there wil 1 be an equalization in the
Chapter II, page 9 (cont.)
Tab 1 e 10. Emp 1 oyment rates ~ North Jut 1 and and ~
the who 1 e of Denmark. (Work force ~
!
of the tot a 1 popu 1 ati on l!!_ the ~ group 16-66.)North Jutland
The whole of Denmark
men
88.6
86.8
1980 women
67.4
70.9
1984
men women
85.6 . 70.5
85.7 72.7
Source: For the 1980 figures: S.E.: Work force and housing survey
1981 (covers the year 1980 ).
Income development
The level of income in North Jutland is below the national average in relation to the rest of the country. Within the region there is however a relatively wide range (see table 13, page 12).
Conclusions concerning regional inequalities~ comparison with the
country~! whole.
The business structure in North Jutland is different to that in the rest of Denmark. There is over-representation of industry which is in decline as far as employment is concerned. For example there is much employment within the agricultural sector. Making agricultural production more efficient by combining farms into
larger farms and also a relative decline in demand for
agricultural products have resulted in a reduction in employment in this sector. Since this sector is of relatively greater
importance in the total employment picture in North Jutland, this has effected it relatively more.
A corresponding problem exists in industries which are sensitive to the state of the market such as fishing, the building industry, the transport sector and ship-building.
Changes in demand within these industries affect North Jutland re 1 ati ve 1 y more.
These conditions are reflected in the traditional regional deve 1 opment prob 1 ems:
unemployment, which is approx. 30% above the national average,
- taxable personal incomes are 10% below the national average,
Chapter II, page 11.
Inequalities within the county
The County of North Jutland does not act as one large labour force catchment area. Within the region 7 smaller work force catchment areas/regions can be indentified, c.f. the map on page 3, between which there are differences in the industrial structure,
unemployment and incomes.
In certain regions agriculture dominates - for example in West Himmerland. Here the decline in agriculture has had a great effect upon employment. In this region there has been a concentration upon animal production which gives problems in relation to the EEC's agricultural policy concerning animal production.
Table~ Employment~ North Jutland~~ region(%) 1.1.1984 (end of November 1983).
Region Agriculture Manufacture, Service,
building and transport, construction commerce
Frederikshavn 11.1 28.2 {JJ.7
Hj0rring 16.9 24.1 59.0
Br0nderslev 17.0 26.1 56.9
Alberg 7.9 25.9 66.2
Hanherred 24.2 23.8 52.0
West Himmerland 20.4 25.1 45.5
Mariager Fjord 18.7 26.8 54.5
County of North
Jutlan:l 12.2 25.9 61.9
Total
100.0
100.0
100.0
100.0
100.0
100.0
100.0
100.0
Source: Register-based labour force statistics (specially prepared for North Jutland (end of Novemer 1983)).
Table 12. Unemployment~ North Jutland by region (February 1985).
(Insured full-time unemployed as% of those insured.)
Region
Frederikshavn Hj0rring Br0nderslev Alborg Hanherred
West Himmerland Mariager Fjord
Unemployment percentage
19.1
19.8
19.1
19.5
24.7
19.7
20.7
r·~---~--~---1
County of North Jutland 19.7
Source: D.S.: Unemployment statistics.
There are also regional differences in taxable incomes.
Table 13. Taxable income (average)~ North Jutland by region ~ 1983.
Region Income
Frederikshavn 102.7
Hj0rring W.7
Br0nderslev 94.5
Alborg 102.7
Hanherred 88.2
West Himmerland 90.9
Mariager 94.2
County of North Jutland 100.0
[image:55.589.88.427.124.369.2] [image:55.589.91.401.455.718.2]Chapter II, page 13.
In general this gives a picture of how the industrial structure within the region also results in inter-regional differences in the standard of living.
b. Measures during the period 1981-85
Regional development assistance
During the years 1982-85, the following assistance was granted to the County of North Jutland:
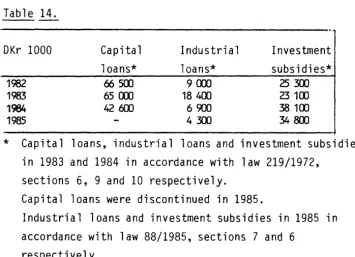
Table 14.
DKr 1000 Capital Industrial Investment
loans* loans* subsidies*
1982 f:iJSOO 9 OOJ 25300
1983 65 OOJ 18 400 23100
1984 42 600 6SUJ 38100
1985 4 300 34 BOO
* Capital loans, industrial loans and investment subsidies in 1983 and 1984 in accordance with law 219/1972,
sections 6, 9 and 10 respectively.
Capital loans were discontinued in 1985.
Industrial loans and investment subsidies in 1985 in accordance with law 88/1985, sections 7 and 6
respectively.
The assisted investment has resulted in the creation of the following number of jobs:
1982 1983 1984 1985
[image:56.581.118.473.276.533.2]Infrastructure investments
The following summary lists the most important infrastructure investments in the national and county framework - and only to a lesser extent the municipal and licensed companies:
- Freight transportation: A new freight terminal has been established at Alborg East, a new post terminal at Alborg including sorting and transportation equipment for Alborg post office amounting to DKr 225 mil lion ~the State), and a new cargo and ro 11-on/ro 11-off termi na 1 at A 1 borg East Harbour for the container business. The annual investment for new
Chapter II, page 14.
- Other ports: A number of improvements have been carried out to the State ports in the County of North Jutland, partly in the form of expansion and partly in the form of modernizations. The following state investments were made in 1981-85: Frederikshavn DKr 36.1 mil lion, Skagen DKr 56.8 mil lion and Hirtshals DKr 128.1 million.
- Airports: State investments in Alborg Airport during the period 1981-85 amounted to DKr 50.7 mil lion, which were mainly for expanding and modernizing the airport.
Roads: Investments in the trunk road and main road network during the period are divided into approx. DKr 70 mil lion per year for new construction and approx. DKr 150 mil lion per year for maintenance and operations (the State and the county). As a special measure for the western part of the region DKr 21
mil lion (the State) was invested in bridge and dam construction at Sebbersund in 1983.
- Education. In connection with the construction of Alberg University Centre there was capital investment during the period amounting to DKr 300 mil lion (the State). During the same period the number of students doubled from 2 000 to 4 000.