,
COMMUNAUTE
ÉCONOMIQUE EUROPÉENNE
EUROPAISCHE
WIRTSCHAFTSGEMEINSCHAFT
COMUNITA
ECONOMICA EUROPEA
'EUROPESE
ECONOMISCHE GEMEENSCHAP
EUROPEAN
ECONOMIC COMMUNITY
~-Organization
of World Markets
for Ag rieu ltu rai
Commodities
A joint action
programme for developed
and developing countries
Agricultural
series
15
BRUSSELS
STUDIES
AGRICULTURAL SERIES No. 15 BRUSSELS 1964
Organization
of World Markets
for Agricultural
Commodities
A joint action
programme for developed
and developing countries
A. Kruse-Rodenacker
CONTENTS
ABBREVIATIONS
FOREWORD
INTRODUCTION
A. CURRENT RELATIONSHIPS AMONG NATIONAL AGRICULTURAL MARKETS
1. Analysis by Groups of Countrie$ 1. Five groups of countries
2. Distinguishing features of the five· groups of countries 3. Conclusion : There exists a structural imbalance
II. Analysis by Commodities
1. The choice of food products for investigation
2. Review of separate products
3. Conclusion : Equilibrium is not in sight
III. The lmbalance on the WorldMarketfor Agricultural Commodities 1. Surpluses. and priee distortions
2. Food deficit and deficient demand for food
3. Conclusion: The imbalance is world-wide
B. ORGANIZATION OF WORLD AGRICULTURAL MARKETS
1. The Reasons for Organization and its Purposes
1. The reasons for international action
2. The purposes of organization
II. The Kind of Organization Required 1. Inapplicable solutions
2. Market-oriented solutions
III. The Impact of Organization on the Problems of Economie Development
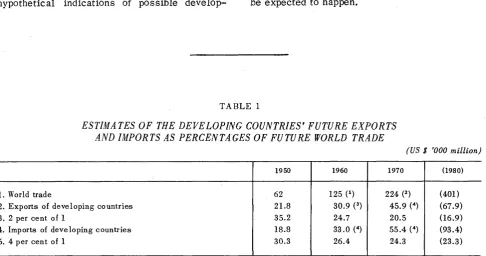
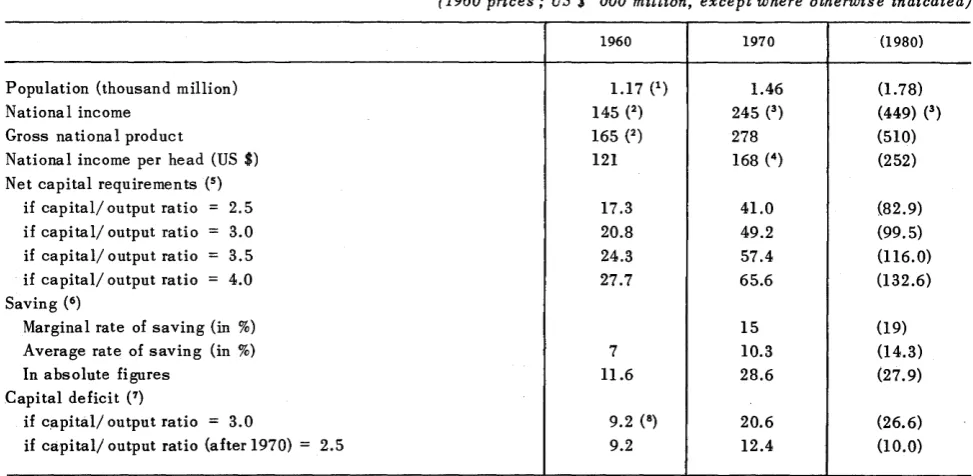
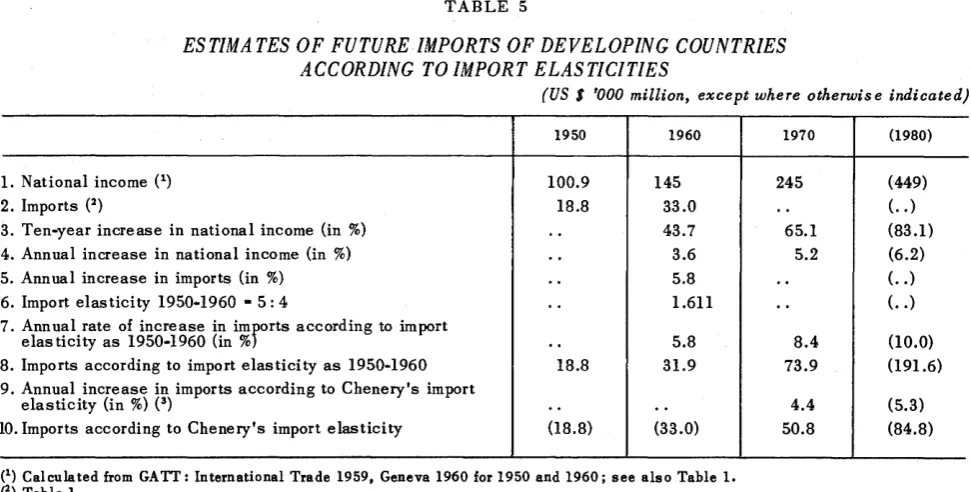
1. Estimates of the developing countries' capital deficit and foreign trade
2. The long-term nature of the problem of developing countries
IV. The Methods of Organization
1. Stages and sy-stems of economie integration
2. Trade-policy systems
3. A common market with third countries ?
4. Sectoral integration is no solution either 5. Co-ordination of national agricultural markets
V. The Ten Princip! es of Organization
C. THE INSTRUMENTS OF WORLD AGRICULTURALMARKET ORGANIZATION
1. Consumption Policy
1. Expansion of consumption in less developed countries 2. Expansion of consumption in developed countries
Pages
5
7
9
11
11 11
11 15
16 16
17
20
20 20 21
24
25
25 25 26
26 26
27
27
28 30
31 31 32
33
35 36
36
38
II. Production Policy
1. Adjustment of supply to wor1d demand 2. Stocks
III. Foreign Trade Policy 1. Minimum export priees
2. Export policy
3. Import policy
IV. Demand Transfer
1. The transfer of withheld import demand
2. The extent and distribution of financia1 burdens
3. The application of the economie princip1e
CONCLUSION
ANNE X
Pages
39 39 40
41 41 41 42
42 42 43 43
45
DM
ECAFE
ECE
EEC
EFTA
FAO
GATT
GNP
OECD
SITC
UK
UN
us
USSR
ABBREVIATIONS
Deutsche Mark
Economie Commission for Asia and the Far East
Economie Commission for Europe
European Economie Community
European Pree Trade Association
Food and Agriculture Organization of the United Nations
General Agreement on Tariffs and Trade
Gross National Product
Organization for Economie Co-operation and Development
Standard International Trade Classification
United Kingdom
United Nations
United States of America
FOREWORD
In recent years there bas been a growing tendency to place the economies of separate countries in a much broader setting. This tendency is reflected in the creation of inter-national organizations, in economie integration and association, and in international agreements of a general or specifie kind. Relations among countries, and especially their tracte relations, have thereby acquired a much more distinctly multilateral character than they used to have.
In this new situation, the impact of any single
country' s agricultural polie y measures on the
world market and their distorting effects on international tracte are more marked than ever, in spi te of all the rules which have been devised to govern international trade. New attempts are,
therefore 1 now being made in many fields to
arrive at the formulation of rules designed for wider purposes, and in particular to work out a new order for the world markets of agricultural commodities.
A world-wide solution of this kind raises sorne extraordinarily complex problems. Anxious to make its contribution to the examination of these problems, the EEC Commission requested Dr Albrecht Kruse-Rodenacker of the Tech-nische Universitlit, Berlin, to write a study, in which a critical analysis of past and current meàsures to protect agriculture would lead up to the formulation of principles which might govern trade regulations on an international plane. The EEC Commission expresses its sincere gratitude to Dr A. Kruse-Rodenacker for the fundamental contribution he has made with the study which follows.
However 1 this study is not to be taken as
INTRODUCTION
During the last twenty or thirty years agri-culture bas more and more come to play a peripheral part in the economie expansion of many countries. Economie theory, economie po licy and the work of international organizations alike show up an increasingly sharp cleavage betweeen agriculture and industry. In many developed countries the two sectors today no longer have a commonlanguage. Communication among experts and co-operation among the government authorities responsible for eco-nomie policy are going from bad to worse.
Domestically, conflicts of interests are
becoming keener, and internationally the
problems of world agricultural trade in its interconnections with tracte in manufactures are causing growing disturbances. It is impossible to exaggerate the consequences of the isolation of agriculture, both in national and in inter-national terms.
In many a country we witness the emergence of a sort of Monroe doctrine for agriculture, as an expression of the belief that the countries concerned can afford to, and indeed should, keep their agriculture insulated and protected. But imbalances and contradictions in world agricultural trade have reached a point where it becomes imperative to reorganize the market for agricultural commodities. How is this to be done, when the agricultural sector is being withdrawn more and more from the reach of the classical rules of competition and the
classical mechanism of world tracte ? This is
the subject of the study which follows.
9
The free competitive adjustment of supply and demand bas been ruled out for decades in the agricultural sector by all kinds of interventions. For many reasons, which will be discussed presently, the introduction of a competitive market system is not feasible today inpractice. Nevertheless, the discussion which follows ad-heres to the principle that government inter-vention in the agricultural sector ought to be minimized. The term " organization " of world agricultural markets is meant in the sense of establishing a new order, and not in any insti-tutional or administrative sense.
The first part of the study analyses existing imbalances in the world' s markets for agri-cultural commodities. This is followed by a discussion of possible ways to reorganize world agricultural markets. The purpose is not to propose deviees simply for dealing with the symptoms of imbalance, but to suggest how the very causes of imbalance and contradictions can be removed.
The study is primarily concerned with those food produc1:s which are now in the limelight of international discussion, but the results of the investigation are equally relevant to other agricultural commodities.
A. CURRENT RELATIONSHIPS AMONG NATIONAL AG RI CULTURAL MARKETS
!. ANALYSIS BY GROUPS OF COUNTRIES
1. FIVE GROUPS OF COUNTRIES
In analysing current relationships among
nadonal agricultural markets we make a dis-tinction between industrialized and
non-indus-trialized countries. ( 1) Sin ce, however, both
these broad groups comprise countries of en-tirely different patterns of production and foreign tracte, the results are meaningful only to a rather limited extent.
Severa! fundamental studies of the tendencies and problems of the world economy have the crippling defect that countries at comparable stages of economie development are lumped together in one and the same group, even though they may occupy very different positions in world tracte. For this reason we introduce a rather more refined distinction into the classi-fication by development stages.
Sin ce the beginning of the nineteenth century, when economists first began to think in terms of economie stages, until our modern analysis of stages of economie growth, severa! classi-fication schemes have been worked out to group countries at different stages of development. We want to go further still, and to group coun-tries according to their position in world agricultural tracte, with particular reference, in the context of this study, to the different parts they may be playing in creating or maintaining market imbalances.
From this point of view we establish five groups of countries with reference to the world market in agricultural commodities :
FIVE GROUPS OF COUNTRIES
l) Developing countries with a
)
static economy
low stage
2) Developing countries with a of development dynamic e con orny
3) Centrally planned communist
}
intermediate stageeconomies of development
(1) The principles according to which countries are regarded as
belonging to one or the other group are those adopted by GATT and the United Nations.
4) Developed agricultural export countries
5) Developed indus trial countries
1
high stage of development
The countries under 1) and 2) are the developing (underdeveloped, that is, non-industrialized) countries in the true sense of the word. Group 3) comprises the countries of the Eastern Bloc, most of which are already at a fairly high stage of development and in sorne cases are really to be regarded as developed, th at is, industrialized. Groups 4) and 5) are the developed and highly developed countries.
The main features of these five groups are sketched below, and certain countries are cited
to illustrate particular points. It would be
neither useful nor advisable to allocate each country to one of the five groups and so to " grade " them. What matters for this study is not to allocate gradings but to show clearly how greatly the positions of the se groups differ wh en looked at from the angle of world tracte.
2. DISTINGUISHING FEATURES OF THE FIVE GROUPS OF COUNTRIES
1) Developing countries with a static economy
Examples of countries belonging to this group are Nepal, Tanganyika and Bolivia. Countries in this group are still in the pre-development stage, which precedes economie development
every-where. We call their economy static in the
sense that no radical change has as yet taken place in their productive structure, or at least none is as yet visible. It is, of course, perfectly possible that these countries are already de-velopment-conscious, that there is a certain amount of local initiative and that production begins to expand. Society in these countries is traditional in the sense that its structure is on the who le still characterized by inherited forms rather than by those which are a necessary condition for sustained economie development.
far as there is anything more than a negligible tradition of manufacture, it is mostly of the
artisan type. Local trade occupies a fairly
important place, but there is no developed
domestic market. The rate of investment is
very low - say, 5 percent or less. The economy still lacks the distinctive features which would characterize it as" national" : political factions, regional autocracy in administration, and the absence of anything like a developed system of money, capital or communications prevent the emergence of an efficient domestic market. It. is not precluded th at sorne bran ch of production, or sorne region, may achieve a notable expansion of output, but the net domestic product as a whole, and with it per caput income, never exceed certain limita in this initial stage.
The structure of society has undergone no radical change and is closely connected with
the structure of agriculture. The individual
has very little chances of improving his station. The majority of the population can hardly hope to better the ir own or the ir children' s social
statua or standard of life. For this reason
people display no initiative. Any change in the social and economie structure is taboo to the ruling class, and for the _subjects lies outside any of the categories of their thought and action.
As a consequence of these structural charac-teristics, countries of this type participate only to a very limited extent in world trade and are in no position either to aggravate or to mitigate existing imbalances in the world market for agricultural commoditieso ·
2) Developing countries with a dynamic economy
The group of developing countries with a dynamic economy · includes roughly half the world's nations. India, Egypt and Colombia may serve as typical examples. Sorne of them are on the eve of their transition into the higher develop-ment stage of group 4).
Ever since industrialization began under Eng-land's lead more and more countries have been emerging from the static initial stage. It may be assumed that eventually the process of structural social and economie change will
spread to practically an countries. This
process is often set in motion or intensified
by contact with the outside world. More
especially it is stimulated by the growing internationalization of political and economie interests, including the creation of large blocs. Structural economie change, which is the essen-ti al characterisessen-tic of a dynamic economy, is evident in an existing branches of production
and new ones begin to appear. Production
becomes more diversified. Agriculture still ·
has more relative weight than industry and trade, accounting, as it does, for 50 to 70 per cent of employment and for a sizeable share
in the gross national product (about ~0 per cent)
and in exporta. The higher rate of investment (about 10 per cent), is an important feature. Investment may be located in the most diverse sectors, according to existing raw material resources, national priorities or the pattern of foreign trade, but in general industry is assuming growing importance. Separate economie regions within the country begin to merge in a more or less unified market. Economie growth tran-scenda. the limita circumscribing the static economy and becomes a deliberate purpose of economie po licy.
We know of no single country in which the process of structural economie change came, or is coming, to pass without radical changes in
the social structure. There are, it is true,
quite a few countries where social change is promoted or accepted only half-heartedly and does not go far enough, so that economie growth is slow or indeed the country relapses into stagnation for prolonged periods. Nevertheless, once structural change has begun, it acquires a certain momentum of its own and receives continuous support from outside. Yet there is nothing to justify the expectation of continuous development. It may weil happen that the social structure hardens after initial sucees ses and so leads to economie stagnation at a higher level, either paralysing the process of structural economie change for an indefinite period or arresting it altogether.
Sorne of the countries in this group enter the world market for foodstuff s as suppliera and, given the ir need to earn foreign ex change,
must continue to do so. Many more of the
countries in this group fail co exercice as much demand on the world food market as would correspond to their needs. This is so for two reasons, to be discussed in more detail later : first, shortage of foreign exchange, and secondly, absence of sufficient infrastructures, especially as regards storage, processing and distribution facilities. The same, incidentally, applies also to countries of group 1).
3) Centrally planned communist economies
Sorne of the countries in this group are to be regarded as developed industrial countries.
even to countries whose natural raw material resources place certain limits upon industri-alization.
It is not a distinguishing feature of countries in this group that heavy industry plays the dominant part in economie growth, for the same thing was, and is, true of western industrial nations. Nor is the distribution of investment among the capital and consumer goods industries a distinguishing feature, in so far as in the USSR, the leading country in group 3), the relevant proportions have in recent years come rather close to those of the western world.
Fin ally, it is not peculiar to the development of these countries that important sections of the infrastructure have been neglected, so as to be able to concentrate on investment with high
capital returns. This was typical also of
countries in groups 4) and 5) at comparable stages of their development.
But in other respects the pattern of development in centrally planned economies differs very much from that in countries of groups 4) and 5). This
applies in particular to agriculture. In the
leading communist countries the productivity of agriculture is relatively low, both on their own showing and in terms of international
comparisons. Agriculture ties down a large
part of the labour force - more than half of it in the USSR only a few years ago.
Agriculture is drawn upon to an extraordinarily large extent for capital formation in industrial
sectors. At the same time, the pattern of
agriculture is subject to sudden alterations. Ali in all, the value of agricultural output rises only very slowly, and prolonged periods of stagnation or even retrogression in output per head of the population are by no me ans excluded.
The countries of this group participate in world tracte only to the limited extent of 11 per cent of its total. Apart from intra-trade among them-selves, they make only an increasingly irregular appearance as suppliers of foodstuffs on the world market for agricultural commodities. Measured in terms of their per caput incarne and domestic production, there must be a consid-erable potential demand for food in the countries of this group at an intermediate stage of devel-opment. This demand is likely to increase in the future, but it remains to be seen whether it will be met by imports in the absence of sufficient
domestic production. The FAO projections
explicitly allow for the possibility of such imports. There are severa! reasons why the countries of group 3) have so far restricted
their net imports of food from other groups of
countries. Apart from the priority of import requirements for industrial products, the chief reasons are to be sought in the institutional
rigidity of foreign economie relations - e.g.
bilateral settlement of foreign payments, the principle of balance-of-payments equilibrium over given periods, barter transactions, the pur suit of autarky, etc.
It is true that in recent years the countries of group 3) have been buying major food products abroad, but even their large food imports have not come anywhere near exhausting their re-serves of unsatisfied demand. Even though sorne of these countries have been exporting certain commodities for decades, the prospect for the future re mains that the problem of oversaturated agricultural markets is a long way off in these countries.
4) Developed agricultural export countries
This group comprises primarily the countries of the southern temperate zone, such as Argen-tina, Uruguay, the Republic of South Africa .. Australia and New Zealand.
From the point of view of their relatively high per capita incarne and the pattern of their pro-duction, these countries must be regarded as developed. In sorne of them, indeed, sec tors other than agriculture contribute a consider-able share to the national product, but the country' s predominantly agricultural type is still reflected in the composition of exports.
Agricultural production generally rests on fa-vourable soil and climatic conditions. Further-more, tarrn units are of favourable size and the application of modern techniques, buttressed by often large-scale investment in rural infra-structures, leads to extraordinarily high agri-cultural productivity.
Far from contracting un der the impact of the outflow of agricultural labour toward other economie sec tors, agricultural output keeps rising.
The countries of this group consistently offer growing supplies of food on the world market. Since they cannat maintain or improve their standard of living without exporting food, these countries will no doubt continue to press as
hard as they can for further outlets. This
applies also to those of the countries in this group which place increasing emphasis on the
diversification of their production. Growing
imports of manufactures, and more especially of capital goods, swell their demand for foreign exchange, which they wish to earn by exporting agricultural commodities.
each of them produces many foods in sufficient quantity and adequate quality arid range for its own needs.
5) Developed indus trial countries
This group is made up of the countries of North
America(1
), the European Economie Community
and the European Pree Tracte Association, and Japan.
The industry of these countries is the work of three generations of their peoples. In spite of differences in the concepts and means of economie policy, industrial growth followed a
remarkably uniîorm pattern in all these
countries. Each of them, it is true, specialized on particular branches, such as machine tools and machinery, the chemical or electrical industry, etc., but by and large the structural characteristics of industrial growth were the same. The mere size of the ir national in come, net investment, foreign trade and international liquidities now put the industrial countries in a position where they can exercise a decisive influence on the future course of the world economy. It is in this sense that we speak of them as highly developed.
Productivity having grown more rapidly in industry th an in agriculture, the se co un tries nowadays are led more and more to transfer
part of the non-agricultural sectors1 income to
agriculture. Agricultural production is, there-fore, stimulated not only by technological prog-ress, but also by income transfers, and for sorne years has tended to grow faster than
domestic consumption. No reversai of this
tendency is to be expected and the saturation of markets will increase.
In the light of these developments the situation of exporters of agricultural commodities, es-pecially in this group of countries, threatens to become more and more difficult. They will make every effort not only to maintain, but to improve their position on the world market. Yet these efforts are doomed to failure at least to the extent that the import margin narrows in the importing countries of the same group, which so far were among the major and most secure outlets for food products on the international market.
(1) Here and elsewhere the term North America always includes the United States of America and Canada.
6) The position of agriculture in the economies of the {ive groups
It is typical of countries with a static economy (group 1) that manufacturing industry contributes little, and much less than in any other group, to gross national product.
In group 2), which is numerically very large, the share of agriculture in GNP typically decreases and the share of industry increases. The proportion of agricultural employment in total employment is still high.
In the centrally planned communist economies (group 3) industry makes a considerable con-tribution to GNP, while other sectors, like commerce and services in general, contribute much less. In nearly every case, more than half the working population is still engaged in agriculture.
In group 4), developed agricultural export co un-tries, agriculture• s share in GNP is quite con-siderably smaller than in the centrally planned
economies. In the course of economie
development, agriculture gradually receded in relation to industry. In Argentina, where sorne 25 per cent of the labour force are still occupied in agriculture, agriculture and manu-faL.turing industry contribute equal shares of
22 per cent to GNP.
Lastly, in the developed industrial co un tries (group 5) agriculture is clearly eclipsed both as regards its share in GNP and its proportion of employment. The process of contraction is likely to continue apace in many of these countries, without necessarily reducing agri-cultural output as such - a proviso which applies also to group 4).
From the point of view of both the origin of the national product and the composition of the working population, the relative importance of agriculture sharply decreases throughout groups 2) to 5) from each step to the next in ascending or der. Any given increase or decrease in the value of agricultural output is bound, therefore, to have a much stronger impact on the national income of developing and centrally planned countries than on that of deve'loped countries.
The developing countries of groups 1) and 2) generally sell only small quantities and a small range of products other than those of their monocultural farming, and the proportion of their agricultural exports to total exports is relatively high.
THE POSITION OF AGRICULTURE IN THE ECONOMY OF SELECTED COUNTR/ES IN THE FIVE GROUPS (1959-1960}
{in%)
Contribution to gross national product by
Ratio of agricultural Group and country
1. Tan gan yi ka 2. Thailand
Co lombia ln dia 3. Yugoslavia
Hungary Soviet Union 4. Argentina
New Zealand 5. France
Canada German y (F. R.) United States
{1) Including mining, building and power. {2) 1956.
e>
lncluding mining.(4) Estimated from national statistics 1946-1954.
Agriculture
59 36 36 48 26 23 21 22 22 10 7 7 4
to total employment Manufacturing industry
7 80-90
14 84
16
-17 (1) 74 (2)
44 (3)
-57 (3) 58
53 (3) 48
22 25 (4)
22
-37 23
26 (1) 17 (4 )
39 14
30 8
Source: Calculated from national statistics and UN: Statistical Yearbook 1961, New York 1961.
Yugoslavia' s agricultural exports was US ~210
million and accounted for 47 per cent of total exports.
The characteristic feature of developed agri-cul<.:ural exporters (group 4) is that their exports
consist almost exclusively # or at any rate
overwhelmingly, of agricultural products.
As regards developed industrial countries
(group 5) finally # agricultural products account
for a smaller share of total exports than in any other group. It is worth noting, however, that the export share of agriculture varies greatly from one country to another; for North America the figure is 26 per cent (without forestry) and represents enormous quantities in absolute terms.
3. CONCLUSION: THERE EXISTS A STRUCTURAL
lM-BALANCE
Developing countries with a static economy (group 1) hardly participate in world tracte of
most products. Developing countries with a
dynamic eco no my (group 2), wh ile in sorne cases
exporting considerable amounts of agricultural
commodities (raw materials), possess neither the foreign exchange nor the infrastructures which might enable them to meet their food
requirements by imports. The centrally planned communist countries (group 3) possess both, but prefer for reasons of economie policy to cover only part of their food import require-ments. Developed agricultural export countries (group 4) have no net import demand for most
products. Developed industrial countries
(group 5) do possess enough foreign exchange and suitable infrastructures to maintain or expand imports, but prefer for a variety of reasons to let their own agriculture cover a growing portion of their demand for food.
Those countries in group 2) which export food, have to do so even to the detriment of domestic supply, be cause in the interests of the ir economie development, they cannot afford to do without the corresponding foreign exchange earnings. The same applies to those countries in group 3) which export food. In their turn, the countries of group 4) have to promote their food exports in order to forward an improvement in their standard of living as well as industrialization In spite of the relatively small importance of agriculture for the _ domestic economy of the
countries in group 5) - the importance of
agriculture decreases with advancing
develdp-ment - the developed industrial countries are
THE EXPORT SHARE OF AGRICULTURE IN SELECTED COUNTRIES OF THE FIVE GROUPS (1960}
Group and Country Food experts Other agricultural Total agricultural Ratio of agricultural
experts experts to total exports
1. Tanganyika 51
2. Thailand 192
Co lombia 346
lndia 433
3.-
-4. Argentina 736
New Zealand 461
5. Canada 1022
France 910
Germany (F .R.) 239
United States 3 319
Source: From FAO: Trade Yearbook 1960, Rome 1961.
Taking an the five groups of countries, there-fore, there is an imbalance between supply and demand, and this imbalance is largely condi-tioned by structural differences in the countries' stage of development and their production plans
and foreign trade. Viewed as a whole, the
resulting market tendencies are such that the imbalance must be expected to grow in the future rather than to diminish.
Il. ANALYSIS BY COMMODITIES
1. THE CHOICE OF FOOD PRO DU CTS FOR INVESTIGATION
If world trade agricultural commodities as a
whole is out of balance, there are also equi-librating elements which tend to narrow down the gap between demand and supply in the case of certain individual products. These elements are not the same in every case, because different groups of countries supply any one commodity to the world market or demand it, and because the elasticities of production and consumption vary from one commodity to the other.
In investigating the markets for separate com-modities, we shaH limit ourselves to food products, and more particularly to tho se which are now in· the limelight of international dis-cussion : grains, beef and veal, dairy produce sugar, and edible fats and oils.
16
million dollars %
78 129 84
150 342 85
15 361 78
151 584 44
-
-
-285 1021 95
335 796 96
155 1177 36
228 1138 19
llO 349 4
1627 4946 26
In terms of value, the commodities under consideration together account for the biggest single item in world agricultural trade, as shown in the table below.
VALUE OF WORLD AGRICULTURAL TRADE, ANNUAL AVERAGE 1957-1959
(US 1 '000 million)
Food
Commodities under consideration Citrus and other fruit
Tropical beverages, wine, tobacco
Agricultural raw materials
Forest products
Total agricultural products
11
1 5
5
5
27
Source: Compiled from FAO: Agricultural Commodities Projec• tions for 1970, Rome 1962.
Generally speaking, world trade in agricultural products accounts for only a relatively low pro-portion of world output of them. The commodities
under consideration - especially grains, dairy
world output are exported in the case of other agricultural commodities. For example, about 70 per cent of aU tropical beverages produced enter world tracte, and so do more than 70 per cent of many agricultural raw materials.
RATIO OF WORLD EXPORTS TO WORLD PRODUCTION, 1957-1959
Sugar 33
Edible fats and oils 32
Grains 10
Dairy produce 7
Beef and Veal 4
(in%)
---···---·
Source: Calculated from FAO: Agricultural Commodities Projec•
tions for 1970, Rome 1962.
Different commodities play a different part in the tracte between particular groups of
countries. ln sorne cases, like grains, beef
and veal, and dairy produce, tracte flows are largely between developed countries (groups 4 and 5); an example to the contrary is rice, which is traded overwhelmingly / among de-veloping countries (group 2). Edible fats and oils of animal and vegetable origin are supplied by practically ail groups of countries, but the main buyers are industrial countries (group 5). It is only in the case of sugar that the bulk of the tracte flows goes from developing countries (group 2) to industrial countries (group 5).
2. REVIEW OF SEPARATE PRODUCTS
The following brief review of the world markets for grains, beef and veal, dairy produce, sugar and edible fats and oils is not meant as a full-scale analysis. Past trends, the current situation and prospects of tracte in agricultural commodities are today am ply documented; special reference is made to F AO's analysis in Agricultural Commodities - Projections for 1970 (Rome 1962, E/CN.l3/48, CCP 62/5). In the present context we shall merely draw on the existing documentation to outline the situ-ation on particular commodity markets, with special reference to differentiai tendencies with respect to market imbalance.
Grains - Volume of world trade 1961: 80 million tons
Exporting countries of group 5) account for 65 per cent of world tracte. Their output has been expanding quite extraordinarily for many years
17
past, thanks to technological improvements, to production incentives during and after the war, and to the production-raising effects of
agri-cultural subsidies. In the other groups of
countries output has also been rising steadily. This applies especially to many countries of group 2), where natural conditions are propitious and great efforts are being made toward a rapid increal3e in production, though in absolute terms the level of output is often still very low.
Demand has been stationary in developed coun-tries, in spite of the growth of their population. In the future, much will depend upon the con-sumption of feed grains for the production of animal products. In developing countries demand has been exp an ding continuously, but very un-evenly and from a very low level of con-sumption.
Looking at the world market for grains as a who le, it may be said th at for sorne years past output has been in excess of demand and has been exp an ding much more th an the latter. The result was an enormous accumulation of stocks, which has long exceeded any reasonable limit. Under the pressure of growing stocks, artificial deviees have been introduced to pro-mate the non-commercial utilization of grains.
In future years, severa! equilibrating factors may come into play. Foremost among them are certain restrictions on production in developed countries of group 5), growing demand for feed grains in developed countries of groups 4) and 5), and expanding consumption in· developing countries of group 2). Centrally planned eco-nomies of group 3) have not been taking an important part in world trade in grains. The Peoples' Republic of China has been importing sizeable quantities, but in view of the shift of emphasis to dornes tic agricultural production these imports can hardly be expected to con-tinue in the future. Long-term projections for other countries in this group, and especially for the USSR, suggest that their demand for grains will expand, and they may therefore be
expected - though not with certainty - to
expand also their grain imports.
Given the existing imbalance between supply and demand, the effectiveness of these equilibrating factors must, however, be regarded as limited. Non-commercial grain deliveries amounted to 22 million tons in 1961 and so accounted for about one third of world tracte; this has created an entirely new situation as regards the com-position of exports on commercial and
non-commercial terms. Any reduction in the
Among commercial b'uyers major importera or groups of importers took up the following absolute and relative quantities in 1961 :
EEC UK Japan
14.9 m. tons 20% of world exports
9.3 m. tons = 13% of world exports
4.4 m. tons
=
6% of world exportsThe United Kingdom and Japan have only limited possibilities of replacing imports by domestic
production. The United Kingdom entertains
special political and commercial relations with its principal suppliers. The EEC's grain imports are subject to wide fluctuations, given the relatively high degree of self-sufficiency and the looser political and commercial ties with
certain other exporting countries. It is not
precluded that in the future a contraction of net wheat imports due to growing self-suffi-ciency might be made good by expanding
im-ports of fe~d grains.
Non-commercial exports during the same year amounted to 22 million tons, distributed as follows among major importers (the percentage figures refer to the total of non-commercial exports) :
Group of countries 3) 2.1 million tons = 9.5%
(e.g. Poland, Yugoslavia)
Mediterranean countries 4.5 million tons =
20.5% (excl. Yugoslavia)
Asia 7. 7 million tons = 35%
Latin America 3.8 million tons
=
17.3%Africa south of the Sahara O. 7 million tons ==
3.2%
Bee f and veal - Volume of world trade 1961: 3.5 million cattle and 1 million tons of beef and veal
Developed countries produce and consume two thirds of ali meat; the remaining third is attributable to developing countries, which have roughly two thirds of the world's population. Neither they nor the centrally planned economies play more than a negligible part in world trade. Only 7 per cent of world output enters world tracte, which is carried on mainly among devel-oped countries. In the case of beef and veal, developed countries of group 5) account for 66 per cent of world tracte.
The principal suppliers are Argentina and
Uruguay. Sin ce the war Oceania has been
supplying growing quantities of meat, and so have certain European countries like Denmark, Ireland, the Netherlands, Yugoslavia and -more recently - France. The principal
im-porters are Western European countries,
among which the United Kingdom alone accounts for nearly half of total world imports. Unlike their gross imports, net imports of the United States are very small.
At present, the world market for beef and veal displays no structural oversupply. Should a vigorous expansion of production lead to excess supply in the future, equilibrium between supply and demand could no doubt be re-established- by priee changes, given the high priee elasticity of demand for beef and veal. World trade will continue to be largely between developed countries of groups 4) and 5). There is sorne prospect that centrally planned eco-nomies (group 3) may import more, but developing countries of groups 1) and 2) will continue for sorne years to take little part in world trade.
All this adds up to a relatively stable market, from which the developing countries are, to
aU intents and purposes, absent. Radical
changes are, however, not to be excluded on
the supply si de, if Oceania should exploit its
rich production potential and France and the Netherlands raise their supply within the EEC. In the United States, too, the situation may change in the direction of growing domestic production, especially if priees rise. On the demand side the determinant factor is the attitude of the United Kingdom. Any change in its traditional sources of imports, such as was discussed during the negotiations on Britain's entry into the EEC, would alter the market situation.
Dairy . produce - Volume of world trade 1961 : 2.2 million tons (dairy produce}
Exporters of group 5) alone account for 67 per cent of wprld tracte in dçiiry produce. Gener-ally speaking, supply is characterized by
steadily expand~ng output. The
production-raising effects of agricultural subsidies are especially marked in the case of dairy pro-duce, and many countries also apply export subsidies on a large scale.
On the demand side, the main feature is a relatively high per caput consumption in developed countries, where no major expansion
of consurnption can be expected. Priee
re-ductions might stimulate butter consumption in countries with large margarine consumption.
For the rest, the priee elasticity of demand for dairy produce is rather low. Milk con-sumption, which accounts for 30-40 per cent of total consumption of dairy produce, can hardly be expected to grow to any considerable
extent. Developing countries remain largely
All in all the world market for dairy produce is marked by strong oversupply. Developed countries are surrounded by protectionist tariff walls and their consumers pay artificially high priees. World market priees, by contrast, have fallen and often fail to cover the costs
of the che~pest sellers. A strong increase ïn
oversupply on this market is expected for the
future. Large amounts of dairy produce are
included in non-commercial surplus utilization
There is no expectation that demand ort the part of centrally planned economies can do anything rn uch to mitigate the growing fm-balance on the world market for dairy produce
in the future. These countries will remain
marginal importers for years to come. Sorne of them may expand their butter imports, but others, like Poland, will maintain their exports.
Sugar - Volume of world trade 1961: 18 million tons (raw sugar}
During the last ten years sugar output more than doubled, even though the traditional export countries, especially Cuba, have not as yet exploited their potential for higher production. The outlook for the future is that developed countries cannot step up their output much
more, while considerable increases are to be expected in developing countries, especially in Latin America.
Total demand bas been rising sharply in recent
years. Industrial countries (group 5) have
clearly reached saturation point, while devel-oping countries of group 2) expanded their consumption along with their domestic pro-duction. Until 1960 centrally planned economies played an insignificant part in world tracte; on balance, they bad negligible net exports. In 1961, however, these countries purchased 4. 7 million tons from Cuba, th us absorbing 77 per cent of its exports. Even though the Eastern countries eventually re-exported part of these imports, the example is instructive, in that it shows what a difference these countries can make to the market situation, if they allow their potential demand and inter-national purchasing power to enter the world market.
The sizeable oversupply which was the deter-mining feature of the world market situation for sorne time, gave way in the last two years to a general shortage of supply. The main reason of this reversai of fortunes is the political situation of Cuba. Not only has
Cuba' s output fallen considerably, but bilateral
agreements with the USSR and other Eastern countries will prevent, or at least sharply diminish, Cuban supplies to the world
market-19
the more so since these countries would actually appear to have become deficit areas them-selves.
In the immediate future the market must be expected to rem ain tight, un til rising production elsewhere evens out the situation.
Edible fats and ails - Volume of world trade 1961: 8. 7 million tons (fat content}
Edible fats and oils, too, have for sorne years
now been registering steady production in-creases, especially in the United States and also in many developing countries. Expansion
of output was especially vigorous during th~
war and the Korea cr isis, and affected in particular animal fats and oils, the by-products tallow, fish oil, soya be an oil and cottonseed
oil, and peanut oil. Consumption bas been
rising at almost the same pace, and this is all the more remarkable as a large part of fat consumption, which used to go to the soap industry, bas now be en replaced by synthetics. In many countries - including especially India,
Indonesia and Argentina - growing domestic
consumption made inroads into their exports. In dia, a traditional exporter, bas now become a net importer.
The proportion of by-products traded inter-nationally bas been growing appreciably since about 1953, and the share of the developing countries in international tracte bas fallen
considerably. These developments were
ac-companied by remarkable priee stability, except for sorne passing periods of sharp fluctuation and a marked trend of a faU in priees for edible oils (soya bean oil, peanut oil) and by-products.
Among the communist planned economies the Peoples' Republic of China, which bad at first exported large quantities despite the very low per caput consumption at home, was notable for the considerable reduction in the scale of its sales abroad. The group as a whole was a net importer, though the quantities involved were smaU.
or covered by domestic production, to expand which these countries are willing to pay rising
costs. In this connection it should be noted
that there are large surplus stocks in the US and that considerable quantities (especially of soy beans) have been exported on non-commercial terms since 1955.
3. CONCLUSION : EQUILIBRIUM IS NOT IN SIGHT
To sum up, it may be said that, although
certain equilibrating elements tend to reduce the imbalance between supply and demand on the world markets for the commodities here under consideration, the effects are far too weak to establish equilibrium on any of these markets, let alone all of them.
Where imbalances do tend to diminish, it can be se en from the existence of supply management in different forms, as well as from non-commercial transactions, that the equilibrating effects by no means originate in market forces alone, but owe much to government intervention. Furthermore, the priee elasticity of demand is low in most markets, so that an adjustment of supply and demand through the priee
mechanism cannot be expected. A further
point to note is that in a growing number of countries the elasticity of demand will tend to fall as income grows.
Lastly, it must be stressed that in this brief review no allowance has been made for the interdependence of markets. But interdepend-ence means that any approach to equilibrium on the market for one commodity may be wiped out by disequilibrium or changes on the markets for other commodities. This applies no less to products within the broad groups of grains, meat, dairy produce and edible fats and oils, than to the relationships of the se groups of commodities to each other. A case in point is the cheap production of eggs and their world market supply, thanks to non-commercial importa of grains.
Taking all the commodities here considered as a who le, the conclusion cannot be evaded that the market tendencies in evidence hold out no hope of adequate market equilibrium either now or for sorne years to come. On the contrary, the observer is struck by the abundance and variety of tendencies which cause or accen-tuate market imbalances.
Ill. THE IMBALANCE ON THE WORLD MARKET FOR A GR/CULTURAL COMMODITIES
The foregoing analysis by groups of countries and by commodities has shown that in the
current relationships between agricultural
markets there is an imbalance between demand and supply, in the case of all the major food products and all the five groups of countries.
Careful examination would reve al sim il ar strong
imbalances between demand and supply with respect to other foodstuffs and agricultural raw materials.
The origins of this disequilibr lum go back to the first world war and the subsequent
agri-cultural criais. Ever since, the causes of
imbalance have been closely linked to the critical problems of agriculture' s part in economie development.
Before discussing how an organization of world agricultural markets might remove the existing imbalance, it will be well to de scribe the latter' s elements.
1. SURPLUSES AND PRICE DISTORTIONS
a} Surplus es
Given normal stocks, we define as surplus tho se quantities of any country' s products which neither domestic nor foreign demand takes up at the domestic supply priee. To arrive at an
idea of the real extent of surpluses, we must,
therefore, add to the unsold carryover from the old crop year also such non-commercial dispos al as may have taken place. Given the multiplicity of methods applied to influence the market, it is extremely difficult to determine what the size of surpluses would be in the absence of inter-vention.
This circumstance has to be kept in mind when we now look at the considerable surplus stocks which have been accumulating for years in sorne countries, notably in the United States, but also in Canada, Argentina and Australia. Carryover stocks of wheat and coarse grains give sorne
idea of surplus supply of these commoditi~s.
So far, surpluses have emerged mainly in the case of storable foodstuffs, including in par-ticular grains, and of a few agricultural raw materials, like cotton.
Storage and administration costs in the United States are said to exceed one million dollars
per day. In 1962, total wheat surplus stocks
CARRYOVER STOCKS OF WHEAT AND COARSE GRAINS AT THE BEGINNING OF THE NEW SEASON
(in million tons)
Country Commodity 1957/1958 1960/1961 1961/1962 1962/1963
United States Wheat 24.7 35.8 38.4 35.5
Coarse grains 44.4 68.0 77.0 65.4
Canada Wheat 19.9 16.3 16.5 10.6
Coarse grains 6.6 4.6 4.5 2.8
Argent ina Wheat 1.6 1.2 0.8 0.2
Australia Wheat 1.1 1.7 0.7 0.5
Source: From FAO: The State of Food and Agriculture 1963, Rome 1963.
low priee elasticity of demand or the far-reaching insulation of agricultural production from market developments.
In all cases, the pressure of growing stocks has proved a coercive element in fashioning
the behaviour of surplus countries. This
applies also to non-commercial surplus
utili-zation. Sorne surplus countries even adopted
agricultural policy measures which stimulated production alongside with growing surplus utili-zation, so that oversupply increased further.
Finally, surpluses of sever al agricultural com-modities undeniably threaten to develop in Western Europe within the next few years. Agricultural surpluses thus become a problem
typical of the market Situation of most, or at
any rate of the most important, countries of groups 4) and 5).
b) Priee distortions
Agricultural protectionism creates domestic capacities which often produce at much higher costs than major and cost-favoured sellers on the world market and which raise domestic supply beyond domestic demand. Export sub-sidies channel part of the supply to the world
market, where it is sold· at arbitrary p~ices.
Demand con tracts as major importing countries become more self-sufficient and at the same time the pressure of supply increases in many countries under the impact of export subsidies ; the result is considerable priee distortion on the market. Often enough priees faU below the costs of the cheapest suppliera.
The situation is indeed paradoxical : agri-cultural commodities are produced with the
help of subsidies, and further subsidies are
then needed to export part of these same commodities. We are face to face, here, with an essential element of the imbalance from
21
which world agricultural markets suffer; while it affects primarily the developed countries of
groups 4) and 5), it is present in all o~her
groups of countries as well. Sales on the
world market are no longer determined solely by comparative costs, but also by the ability and willingness of exporting countries to sub-sidize their exports.
Sorne ide a of the extent of priee distortion may be gained from a comparison of domestic priees in major importing or exporting countries and the world market priee.
By comparison, world market priees for the most important qualities (cif AntwerpjRotter-dam) were on the average as follows between
August 1962 and December 1963 (US ~ per ton) :
Wheat Bar ley
64-70
56 Oats Maize 58-64 60
There is a striking difference between world market priees and the domestic priees of industrial importing countries which practice agricultural protection. Nowadays, the priees of most commodities (accounting for 85-90 per cent of world production) are subsidized by government and there is a discrepancy between the guaranteed domestic and the world market priee on the majority of produce markets.
2. FOOD DEFICIT AND DEFICIENT DEMAND FOR FOOD
a) The food deficit
con-GUARANTEED DOMESTIC PRODUCER PRICES, 1963
A.
Exporting Countries
United States (1) Canada (2 ) Argentina (3 ) Australia (4
)
France (5)
B.
lmporting Countries
Germany (F.R.) (5)
Ital y
Netherlands (6)
United Kingd,Qm (4) Denmark (7 ) ·
{ 1) National average support priee.
(2} Initial payments.
(3) Support priee. {4) Guaranteed priee.
Wheat Feed barley
67 44
51 42
55 37
59
-92 74
Wheat Feed barley
111 95
102 (5) 71 (6)
98 81
73 74
71 67
(in US 1 per ton)
Mai te Oats
49 45
-
3840 33
-
-81
-(in US 1 per ton)
Maize Oats
-
-68 (6)
--
--
76-
63{5) Derived target priees. Main surplus area. Beginning of the crop year. {6) Target priee. Beginning of the crop year.
{7) For wheat: minimum priee. For barley and oats: base priee.
Source: From EEC: Marchés agricoles -Prix, Direction générale de l'agriculture, Brussels.
taining over half the world' s population, food consumption was well below the minimum; in areas containing somewhat less than a third of world' s population, food consumption was well in excess of the minimum; in the remaining areas, containing about one sixth of the world's population, food consumption was close to the minimum. After the war, the food situation of the world's peoples was worse still, and only sorne of them have so far regained the ground
they had lost. According to F AO's latest
figures (Third World Food Survey, Rome 1963) the situation has not yet radically improved. Developing countries have barely managed to return to their inadequate pre-war consumption levels; sorne 20 per cent of their populations are undernourished today, and sorne 60 per cent live on diets which are inadequate in nutritional quality.
Food needs will grow very much in the future. Assuming no more than a constant nutritional standard, that is, no improvement in the existing level of diet, FAO calculates that population increases alone would caU for food supplies in developing countries to rise by 41 per cent
22
between 1958 (=100) and 1975. Postulating an
annual increase of 2.3 per cent in per caput food supplies, requirements in 1975 would be
as shown in the table below.
INDEX NUMBERS OF NEEDS IN TOTAL FOOD SUPPLIES BY 1975
Low-calorie countries World
Total food
179 151
(1958 = lOO)
Animal food
221 158
Source: From FAO: Third World Food Survey, Rome 1963.
[image:22.561.41.536.57.383.2]Apart ~from the products of fishery and hunting,
animal products are derived from plant
products. A great many primary calories of
vegetable origin go to make up one secondary
calorie of animal origin. If food consumption in
low-calorie and in high-calorie countries is expressed in the common denominator of primary calories consumed directly and used for the production of animal foods, primary calorie consumption in the two groups of countries is seen to differ very greatly.
Apart from the "fuels" measured in terms of calories, the human body needs other essential substances, such as minerals, vitamins, etc. Their shortfall together with the deficit in primary and secondary calories, adds up to the food deficit. The food deficit varies
con-siderably not only from one are a to another a
but over time. It may happen that alternating periods of hunger and of transitory abundance add up to average figures of " sufficient" food supply in the calculation of any area's food balance.
The nutritional standard of a people is made up of a number of components, nam ely, calorie consumption with due regard to proteins of vegetable and animal origin, the degree to which the diet is balanced from the point of view of the supply of vital substances, regularity of food supply, and finally the adaptation of food supply to special needs and living
con-ditions (infants, tropical areas, etc.). If any
one of these components falls short of phys-iological norms, it may impair the nutritional standard as a whole and imply a food deficit. Bec a use it is difficult to define adequate nutrition in terms of physiological indicators and to quantify the real nutritional level, the food deficit is generally measured solely in terms of lacking calories (and vital substances) even though as a rule it encompasses much more.
To sum up, the conclusion cannot be evaded that the physiological food needs of the popu-lations of developing countries can today be met only in part by domestic production and
imports. It may well happen that even less
of their needs can be met in the future.
b) Demand for food
Physiological food needs have to be sharply distinguished from effective food needs. The latter are determined by the purchasing power, or the effective demand, which is exercised on the market. In many less developed countrie.s only a fraction of physiological food needs is translated into effective demand.
The reasons for this state of affairs include not only the lack of purchasing power, but
also inopportune or backward food habits (in-cluding taboos). Furthermore, a considerable part of the food consumption of countries in groups 1) and 2) is covered by the family units' own production. Ali the se factors restrict effective demand on the domestic market. What little demand there is in comparison with physiological needs is kept away from world markets by shortage of foreign exchange and the priority accorded to industrial imports.
As economie development proceeds, households
consume less self-produced food. To the
extent that incomes per head and the division of labour grow, more demand is directed to the domestic market, but only part of the demand expansion is reflected in import demand. The reasons are increasing domestic agri-cultural production, even at comparatively high
.~osts, insufficient communications between local markets (infrastructures), priorities for other imports, the pur suit of autarky, etc.
Nevertheless, a comparison of pre- andpost-war figures shows that developing countries did expand their imports of grains, for example, and indeed expanded them far more ttian might have been expected from the relatively small growth of their national income.
GRAIN IMPORTS OF SOUTH AMERICA, AFRICA AND AS/A
Regions
South America Africa Asia
(Annual averages in million tons}
1934-1939 1.3 0.6 2.6 3.5 3.4 13.6
Source: From EEC: Marchés agricoles -Prix, Direction
géné-rale de l'agriculture, Brussels.
The major importera are Brazil in Latin Amer-ica, Egypt in AfrAmer-ica, and ln dia, J a pan and Pakistan in Asia.
The fact remains that the countries of groups 1)
and 2) exercise far less demand for food on the world market than would be desirable in
the light of their food deficit. They feel
3. CONCLUSION! THE IMBALANCE IS WORLD-WIDE
AU in all we are led to the conclusion that the imbalance on . world agricultural markets affects the majority of countries. in aU five
groups. Structural factors having to do with
differences in thé stage of development of the five groups of countries account for a large part of the reasons for the imbalance. The
situation differs considerable as between
different commodities, but no general improve-ment is in sight; sorne produce markets indeed display a tendency towards growing imbalance.
Because of the problematical situation in which agriculture now finds itself both on domestic and world markets, the classical market mech-anism is today largely inoperative in world agricultural trade. Priee no longer adequately fulfils its function of adjusting supply and demand.
Surpluses, priee distortions, food deficits and deficiency of effective demand are indications of the world-wide extent of the imbalance.
24
The production-raising effect of agricultural subsidies reduces the net imports of many developed countries and pushes their domestic output beyond their domestic demand, so that surpluses threaten to emerge in a growing
number of countries. Shares in world trade
are no longer determined by comparative costs alone, but also by the amount of subsidies which governments are willing and able to impose on taxpayers. Subsidies to agricultural production are followed by export subsidies
for part of the output. As a result, priees
are distorted. ln the less developed countries only part, and sometimes a small part, of
thèir food deficit is covered. Their small
import demand is due to a variety of reasons, including shortage of foreign exchange and the domestic market's lack of dynamism and communications (infrastructures).
In the course of the years to come, the market imbalance must be expected to increase rather
than to dim~nish. If things are left to