Theses Thesis/Dissertation Collections
12-23-2015
Workload in Nursing: A Descriptive Study Using
Cognitive Work Analysis
Jonathan Umansky [email protected]
Follow this and additional works at:http://scholarworks.rit.edu/theses
This Thesis is brought to you for free and open access by the Thesis/Dissertation Collections at RIT Scholar Works. It has been accepted for inclusion in Theses by an authorized administrator of RIT Scholar Works. For more information, please [email protected].
Recommended Citation
Rochester Institute of Technology
College of Liberal Arts
Department of Psychology
WORKLOAD IN NURSING: A DESCRIPTIVE STUDY USING
COGNITIVE WORK ANALYSIS
by
Jonathan Umansky
A Thesis in
Experimental Psychology
Submitted in Partial Fulfillment of the Requirements for the Degree of
Master of Science
We approve the thesis of Jonathan Umansky
____________________________________________________________________________
Esa M. Rantanen, Ph.D. Date
Associate Professor of Psychology, Rochester Institute of Technology
Faculty Adviser and Chair of the Thesis Committee:
______________________________________________________________________________
Heidi Mix, MS, RN Date
Director of LPN and CNA Programs
Genesee Valley Educational Partnership
Reader
______________________________________________________________________________
Samuel Huber MD, MS Date
Associate CMO for Patient Safety and Quality Rochester Regional Health System
Reader
Acknowledgements
I would like to thank all employees at Rochester General Hospital who either participated
or facilitated the data collection process. Most notably, I would like to thank the nurse managers
in the Emergency Department (Mary Mahler), gynecology (Melanie MacDonald), and Vascular
Surgery (Annette Stewart). They were instrumental in making this research as stress free as
possible. I would also like to thank Heidi Mix and Samuel Huber, M.D. who were kind enough
to participate in this project as readers, and offer expertise. Last, I would like to thank my
faculty advisor and chair of the Thesis Committee, Esa Rantanen, Ph.D. His knowledge and
research methods expertise were invaluable.
Abstract
Nursing is a high workload profession, and excessive workload has been shown to have an
adverse effect on patient care. This problem has been compounded by shortages of qualified
nurses in hospitals, resulting in increased workload of the existing nursing staff. Prior research
has focused on patient-staff ratios and skill mix to analyze the relationship of workload and
degradation of care. The current research implemented a multi-dimensional model for analyzing
nurses’ workload in a large general hospital. This method afforded the researcher the
opportunity to examine a work domain from multiple angles. Nurses play versatile roles, and
workload extends beyond the care of the patient with team and organizational responsibilities.
The current research expanded on the concept of a multi-dimensional approach to workload in
nursing. Workload drivers were introduced as multiple, unique factors that contributed to the
totality of nursing workload. Prior research examined such factors as organizational and
environmental factors (patient acuity) and factors that vary within a nurse’s shift (time pressure).
The current study engaged in a systematic examination of these concepts, in addition to
extracting workload drivers that were specific to the observation setting (different departments at
Rochester General Hospital). A Cognitive Work Analysis (CWA) was conducted to map out the
work domain of nurses, and identified sources of workload. This was a detailed and multi-stage
investigation of nursing in terms of goals, functions, tasks, physical resources, and mental states
and processes (decision making). The output was a collection of diagrams, tables, and
interviews that illustrated areas in nursing that produced the most workload. A detailed
integration of the material supported an estimation of workload experienced by nurses.
Table of Contents
Acknowledgements………iii
Abstract………...iv
List of Figures ………..viii
List of Tables………...x
Introduction………..1
Nursing is a High Workload Profession……….1
Nursing Profession………..2
Degradation of Care………3
Workload as a Theoretical Construct………..6
Workload in Nursing………...8
Workload Drivers………..10
Skill-Rule-Knowledge-based Decision Making………...14
Cognitive Work Analysis (CWA)……….15
Purpose of the Research………18
Thesis………18
Hypothesis……….19
Method………...20
Participants………20
Observations………..20
Interviews………...20
Materials………...20
Observations………..20
Interviews………...21
Design………...21
Procedure………...21
Observations………..21
Interviews………...25
Population of Cognitive Work Analysis………...26
Results ………27
Task Analysis………27
Observed Tasks………..27
Formation of Categories from Observed Tasks……….28
Tasks Identified in Interviews………29
Synthesis of Tasks (Observations and Interviews)………29
Observations (Workload Drivers)……….31
Organizational and Environmental………31
Variable………..31
Workload Drivers Correlation Analysis………...36
Interviews (Cognitive Work Analysis)……….46
Work Domain Analysis………..46
Work Organization Analysis………..48
Cognitive Transformation Analysis………...51
Cognitive Strategies Analysis………54
Cognitive Processing Analysis………..55
Discussion………..56
Organizational and Environmental Workload Drivers……….56
Variable Workload Drivers………...56
Limitations………62
Implications………...65
Conclusion………66
References………..69
List of Figures
Figure 1. Cognitive Work Analysis (CWA)………..17
Figure 2. Direct observation template implemented for data collection………...22
Figure 3.The structure of the methodological process including observations and interviews….26 Figure 4. Frequencies of tasks and subtasks by unit……….27
Figure 5. Combined frequency of most common tasks in observation with tasks identified in interviews………...30
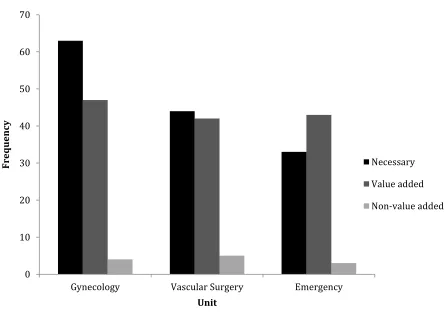
Figure 6. Unit-by-unit analysis of activity type illustrating necessary, value added, and non-value added tasks……….32
Figure 7. Scatterplot for number of steps taken and time pressure ratio………...39
Figure 8. Scatterplot for sub-tasks and SRK Continuum………..39
Figure 9. Scatterplot for sub-tasks and NASA-TLX Mental Demand………..40
Figure 10. Scatterplot for number of tasks and time pressure ratio………...40
Figure 11. Scatterplot for number of tasks and subtasks………...43
Figure 12. Scatterplot for number of tasks and TLX Mental Demand……….43
Figure 13. Scatterplot for number of tasks and SRK Continuum………..44
Figure 14. Scatterplot for number of tasks and TLX Total………...44
Figure 15. Scatterplot for sub-tasks and time pressure ratio……….45
Figure 16. Scatterplot for time pressure ratio and SRK Continuum……….45
Figure 17. The abstraction-decomposition space generated from the Work Domain Analysis…47 Figure 18. Contextual activity matrix generated from the Work Organizational Analysis……...50
Figure 19. An example of one participant’s decision ladder generated from CTA………..52
List of Tables
Table 1. Categories of Primary Tasks………28
Table 2. Most Common Tasks………...28
Table 3. Patient to Nurse Ratio between Units………..31
Table 4. Measurements of Time on Primary Tasks………...33
Table 5. Measurements of Physical Expenditure of Primary Tasks………..34
Table 6. Unit-by Unit Comparison of Final Weighted Rating of NASA-TLX……….35
Table 7. Comparison of Workload Demand Type……….35
Table 8. Correlation Matrix for 66 Variables………37
Table 9. Positive Correlations of Workload Drivers……….38
Table 10. Negative Correlations of Workload Drivers………..41
Table 11. 10 Tasks Analyzed in Decision Ladders………51
Table 12. Frequency of Stages within Decision Ladders………..53
Table 13. Cognitive Strategies Generated from a Situation Assessment………...54
Table 14. Cognitive Processing Modes Generated for a Situation Assessment………56
Introduction
Nursing is a High Workload Profession
Defining roles. There is existing literature providing evidence for a shortage of nurses
worldwide, and that patient care is affected as a result (Weissman et al., 2007). Nurses’
workload naturally increases from shortage of personnel, and from having to play more versatile
roles increasing work demands. Two themes that relate to the versatile role nurses must play
have emerged. One is collidingexpectations, which is the conflict nurses face between their
perceived job functions and what they actually are required to do. The other is you want too
much, which identifies the pressures nurses face professionally. The nursing work environment
needs to be restructured to make their roles more definitive (Pellico, Brewer, & Kovner, 2009).
Addressing staffing issues. Patient-staff ratios, which are an index of hospital-wide
employee shortages, have been a topic of nursing management and state legislature for years
(Aiken et al., 2010). Due to the growing problems associated with shortages, California has
implemented mandates to control patient-staff ratios, and the overall workload of nurses.
Through a cross-sectional study comparing survey data and discharge data between California
and two states without mandates (New Jersey and Pennsylvania), Aiken et al. (2010) concluded
that the latter two states created one more patient assignment per nurse (surveys questioned
nurses regarding their patient load and a mean workload was assigned for each hospital; the
mean workload was the mean patient-staff ratio for each hospital). This is evidence that staffing
issues and increased workload are widespread, but not managed similarly across hospitals.
Additionally, burnout rates were higher in New Jersey and Pennsylvania. Kane, Shamliyan,
Mueller, Duval, and Wilt (2007) found that more nurses per patient was associated with less
and intensive care units benefited greatest from improved patient-nurse ratios, although no causal
relationship was identified. Others (Wright, Bretthauer, & Cote, 2006) have suggested that new
models must be implemented to address staffing issues, while still ensuring economic stability
for hospitals.
Nursing Profession
Licensing and education. The path to becoming a nurse requires licensing within the
desired state of employment, and said state is the governing body to ensure standards of practice
are met. This includes requirements for licensure and retention of one’s license through
education and competency, determining practice parameters, and examining complaints of
licensees and potential discipline (“How to become a nurse,” n.d.). There are both undergraduate
and graduate degrees in nursing to satisfy academic requirements. The undergraduate path offers
a Diploma in Nursing (one year degree), an Associate Degree in Nursing (ADN), which is a two-
year degree, and a Bachelor of Science in Nursing (BS/BSN), which is a four-year degree. The
major difference between the two and four-year degrees is that the two-year degree is designed
to prepare students for all technical aspects of nursing, and the four-year degree is more
comprehensive; these educational requirements for four-year nursing students result in broader
knowledge of cultural, political, social, and economical issues affecting patients. Graduate
degrees offered are Master’s Degree (MSN), Doctor of Philosophy (PhD), and Doctor of Nursing
Practice (DNP). These paths are designed for nursing administrators, researchers, and clinicians
in leadership roles, respectively (“How to become a nurse,” n.d.).
Nursing roles. The responsibilities of nurses range from performing basic nursing care,
such as physical exams and health histories, to more complex tasks, such as coordinating care in
Additionally, nurses are required to promote healthy lifestyles, educate patients, administer
medications, and make critical decisions (“What nurses do,” n.d.).
This research covered all categories of nursing staff. Only if specific training or
responsibilities of nurses are relevant to their workload, a finer-grained analysis included their
rank. In the following, the term “nurse” thus applies to all categories of nursing staff, although
most relevant research has been focused Registered Nurses (RNs)
Holistic profession. Nursing has become a holistic profession, and patients’ psychosocial,
developmental, spiritual, and cultural needs are also cared for (Henderson, 2006). The activities
that nurses are responsible for are broad, and typically the nurse becomes the primary resource
for the best interests of the patient. This includes nurses assisting the physically and mentally
sick in tasks leading to healthy recovery, and nurturing patients to gain independence.
Henderson (2006) also posited that the nurse is an independent practitioner utilizing necessary
resources and skills to a tailor a plan specific for the patients’ needs. It is also common that
nurses will augment or even replace the services that other healthcare providers, such as
physicians or physical therapists, are unable to perform.
Degradation of Care
Shortages. The direct contact required for direct patient care is lacking if there are not
enough qualified nurses to sufficiently attend to each patient (Berry & Curry, 2012). The
inherent by-product of this scenario is that each nurse will personally experience greater
demands through a higher cache of patient workload and associated job responsibilities.
Additionally, less attention is given to each patient making direct patient monitoring difficult.
Weissman et al. (2007) conducted a retrospective regression analysis to predict adverse
research aimed to illustrate the detrimental effects that high workload can have on patient care
and outcomes. A major finding was that a 0.1% increase in patient-nurse ratio led to a 28%
increase in the likelihood of an adverse event. These events included, but were not limited to,
wounds, hospital acquired pneumonia, sepsis, and urinary tract infections. The work suggested
that hospitals should engineer new structures of care to better address a higher census (Weissman
et al., 2007).
A significant association between the number of patients per RN and the incidence of
missed care (p < .001) has been established (Ball, Rafferty, Morrow, & Griffiths, 2014). It was
discovered that comforting and talking with patients, educating patients, and developing and
updating nursing plans were commonly missed items with increased patient to staff ratios (Ball
et al., 2014). Increased patient to staff ratios reduce the quality of care, and increased workload
results from work demands greater than the resources of the nurse. The care that is left undone is
indicative of a shortage of resources. Smeds, Tishelman, Runesdotter, and Lindqvist (2014)
relied on a similar premise in predicting safe and effective care. In a survey of 9,236 RNs it was
concluded that the perception by nurses of having adequate staffing and resources was positively
correlated to their personal assessment of patient safety as a whole.
Nurses reported low quality of care three times more likely in hospitals with low staffing
(Aiken et al., 2002). The cross-sectional findings suggest nurses control quality of care by acting
as a surveillance system for detecting and preventing negative outcomes. Most notably, Aiken et
al. (2002) tested this model with AIDS patients across 20 hospitals in the U.S. Results indicated
that the odds of dying within 30 days of admission were reduced by half by employing an
Higher proportion of registered nurses. Adverse events have also been observed in relation to proportion of RNs. One study by Duffield et al., 2007 combined longitudinal
retrospective and cross-sectional methods to relate nurse staffing, workload, and patient
outcomes. The longitudinal data uncovered reduced adverse events such as pneumonia,
pulmonary failure, and gastrointestinal (GI) bleeding with higher levels of RN staffing.
Skill mix. The proportion of hours worked by RNs to the total hours implemented in the
staffing matrix by management (skill mix) has been identified to improve care (Needleman,
Beurhaus, Mattke, Steward, & Zelevinsky, 2002). Staffing levels, identified by nursing degree
and experience, depicted a negative correlation to adverse events. For example, if RNs covered a
greater proportion of the available hours versus less qualified nurses, it is expected that
in-hospital deaths, wound infections, urinary tract infections, and length of stay will decrease
(Needleman et al., 2002). The research suggested that it is not preferable to reduce the
percentage of hours worked by more qualified nurses. The result is that less qualified nurses will
transition into new roles with increased responsibility where the needs of the patients may not be
adequately met. It can be inferred that increased patient to staff ratios lead to less effective care
because RNs give up some of their duties to less educated and less qualified nurses (Needleman
et al., 2002).
Patient acuity. Patient acuity has also been identified as a predictor for patient safety
(Dang, Johantgen, Pronovost, Jenckes, & Bass, 2002). The authors categorized staffing in
response to acuity into high, medium, and low intensity, with high intensity representing the
highest level of nursing care required (high acuity) Safety was measured in a retrospective
analysis of discharge data by the type of complication presented with and cared for (cardiac,
were positively correlated with all three groups of complications. Specifically, there was an
increase in likelihood of respiratory complications for patients cared for in low-intensity staffed
ICU’s (compared to high-intensity). Results were similar for the likelihood of cardiac
complications when comparing medium-intensity staffed ICU’s versus high-intensity ICU’s
(Dang et al., 2002). These results indicate that the preparedness of the nursing staff
(implementing high-intensity staffing based on increased acuity) can determine patient
outcomes. It was suggested that increased complications across staffing are indicative of
different levels of monitoring, or not enough nurses to perform critical interventions (Dang et al.,
2002).
Workload as a Theoretical Construct
Workload is a multi-dimensional and complex construct defying exact definitions. In
man-machine systems, such a pilot operating an aircraft, workload is the cost of accomplishing the
requirements of the task (Hart & Wickens, 1990) measured by the inability to attend to other
tasks, stress, fatigue, and the deterioration of attentional and cognitive resources. However, the
interpretation of workload varies across systems and across people making it a difficult concept
to pin down. The large number of variables that affect workload makes it difficult to define the
sources, consequences, and means to measure it (Hart & Wickens, 1990). Athènes, Averty,
Puechmorel, Delahaye, and Collet (2002) described workload in a similar manner; “…it is
generally considered a multifaceted construct that cannot be seen directly, but must be inferred
from what can be seen or measured” (p. 57).
Objective workload. Objective workload has been studied in anesthesiology operating
rooms to improve provider training and design more effective equipment. Weinger, Herndon,
objective measures of workload; the purpose was to study the implications of objective measures
of workload on the anesthesiologist, and to provide user-experience data to new technologies.
The time-motion analysis studied time spent on each primary task and task density (frequency of
tasks initiated per minute). Response latency to peripheral illumination of light was used to
measure secondary task probing as an indirect indicator of workload, or spare capacity to
perform additional tasks (Weinger et al., 1994). It can be inferred from the research that
objective workload primarily addresses task-related issues such as time spent on individual tasks,
frequency of said tasks, and the capacity to perform the task (Weinger et al., 1994).
Objective workload is defined as external events to which one is exposed (Manning, Mills,
Fox, Pfleiderer, & Mogilka, 2001). Air Traffic Control (ATC) research conducted by Manning
et al., 2001 used Performance and Objective Workload Evaluation Research (POWER) measures
to describe the operators’ objective workload. Measures of objective workload included aircraft
count and controller activities (e.g. handoffs accepted, initiated, time to complete handoff,
average time aircraft under control, etc.) (Manning et al., 2001). This is relevant to nursing
because handoffs are a common task in nursing.
Subjective workload. Subjective workload is defined by the degree of processing capacity
that is expended during task performance (Hart & Staveland, 1988). This reflects the
relationship between resource supply and task demand. The NASA Task Load Index (TLX) is a
subjective workload assessment instrument based on a quantitative, multi-dimensional scale. It
measures mental, physical, and temporal demands, perceived effort, perceived quality of one’s
own performance, and amount of frustration experienced (Hart & Staveland, 1988).
Additionally, the NASA-TLX includes information on the individual opinions of subjects.
mitigates this concern with a standardized format using rating scales. Rating scales exist within
each dimension of workload (e.g. mental demand) to ensure limited variability (Hart &
Staveland, 1988). The NASA-TLX provides interesting and important data for the cognitive
processes of individuals. The NASA-TLX displays experimental variance in the degree of
workload experienced amongst different factors (i.e. mental demands can produce more
workload for the individual than physical demands, or vice versa). Additionally, the
NASA-TLX outlines the joining of external and objective task demands, and the individual’s response to
them (Hart & Staveland, 1988).
The current research adopted the NASA-TLX. In a cross-sectional questionnaire study
examining various tools to measure workload, Hoonakker et al. (2011) found that the
NASA-TLX was preferred to other subjective measures of workload in nursing, in terms of both
reliability and validity. Results of the NASA-TLX may also help identify causes of workload
(Hoonakker et al. (2011).
Workload in Nursing
Generally, the literature has limited the scope of workload in nursing by synthesizing
relatable terms and concepts into an overly simplified definition (Morris, MacNeela, Scott,
Treacy, & Hyde, 2007). This has led to misinterpretation of the concept in nursing. As a result
of a literature review, Morris et al. (2007) suggested a broad and dynamic method for measuring
and defining workload in nursing as a combination of definitions already in place. They
portrayed the major care provided as a function of the nursing profession including direct care
(administering medications, etc.), indirect care (ordering medications, phone calls pertaining to
patient care, etc.), and non-patient related activities (staff meetings, nursing education, etc.).
review by Kwiecien, Wujtewicz, and Medrzycka-Dabrowska (2012) who concluded that
measurement of workload must be comprehensive and dynamic. Additionally, movements
toward more experimental measures are preferred, such as physical and psychological workload
(fatigue) this approach addresses the changing nature of the nursing environment, and the
subsequent changes in workload that nurses are exposed to (Kwiecien et al., 2012). Older
measurements have focused merely on work intensity and volume of work.
Multi-dimensional approach. Weinger, Reddy, and Slagle (2004) suggested multiple
workload measures for a more complete profile of workload. Physiological (heart rate),
psychological (self-assessment), and procedural (response latency) measures were used as the
criteria across tasks, such as inducing and maintaining anesthesia, and responding to emergent
anesthesia events (Weinger & al., 2004). Inducing anesthesia and emergent anesthesia displayed
increased workload versus maintenance procedures. Inducing anesthesia produced the greatest
workload, but it was highly variable.
Non-patient related factors and workload. Fagerstrom and Vainikainen’s (2014)
cross-sectional qualitative content analysis yielded four factors from the nurses’ perception of work.
They are (1) organization of work (planning schedules, meetings), (2) working conditions
(telephone traffic, interruptions), (3) self-control (mental stress), and (4) cooperation with staff.
Myny et al. (2011) discovered similar results from a literature review that examined non-direct
factors influencing workload within the methods of prior research. The review suggested a
systems approach to workload due to the plethora of workload drivers that exist. Myny et al.
(2011) identified influencing variables (drivers) by level of impact, defined as the part of the
hospital system that is affected: (1) hospital and ward, (2) nursing team, (3) individual nurse, (4)
Working definition. Based upon prior research within nursing and other fields, workload
is the entire make-up of the work a person experiences. Ideally, if one were to simplify the
meaning of workload, it would be the culmination of the day’s work including organizational,
environmental, personal (physical, physiological, and psychological), and situational factors. In
summary of the prior research on workload, a best fit definition to truly encapsulate the
experience is ill-advised. Domain-specific definitions may be easier to interpret within the field
of expertise, but all factors do not generalize to other areas. This research will adopt an approach
that focuses on workload “drivers.” A driver is a mechanical piece for imparting motion to
another piece (Merriam-Webster). In this context as it relates to nursing, a workload driver is a
part of the system that causes or relates to the activity of another part. This research will focus
on how the parts (workload drivers) impact the system (workload) independently.
Workload Drivers
The studies reviewed above identified components within the nursing domain that have
contributed to reduction of care by increasing workload on individual nurses. The workload and
subsequent reduced care was driven by these factors. Additionally, each investigation used a
different method to predict a reduction in care. The common factors that surface are workload
drivers. The forces that drive this are detailed in the following examples.
Organizational and environmental workload drivers. In this context, workload drivers
are static throughout the observations and analyses. The data are generated from standard
hospital reporting on admissions, staffing resources, patient acuity, and skill mix.
Patients/nurse ratio. A secondary data analysis collected from 32 hospitals and including intensive care, intermediate care, and medical-surgical units found that managing and accounting
context of the study, patient turnover can be inferred as the patient to nurse ratio. Increased
patient turnover affected the workload of individual nurses, as units were not staffed to budgeted
levels of patient movement in and out of the units; therefore the study addressed patient to nurse
ratios, and the subsequent increased staffing, as markers for workload (Hughes et al., 2015).
Variable workload drivers. In the current study, the proposed model of workload
generates a broad concept generated by different types of workload drivers. In contrast to static
workload drivers mentioned in the previous section, certain aspects of the nurses’ work vary
throughout the shift.
Frequency of Tasks. Research has found that patient load and frequency of nursing activities as workload drivers are positively correlated to adverse outcomes to the nurses. Such
outcomes were physical, emotional, and inter-personal setbacks. Nurses reported emotional
exhaustion, patient complaints, and a feeling of being rushed as specific indicators of these
setbacks (Al-Kandari & Thomas, 2006). The workload experienced was driven by frequency of
nursing activities.
The air traffic control (ATC) domain has also found implicated frequency of tasks as a
workload driver. Manning, Mills, Fox, Pfleiderer, and Mogilka (2002) found that the number of
ATC communication events (the task of communicating between pilot and controller) is
positively correlated to measures of workload; workload measures included number of aircraft
controlled, handoffs, altitude changes, and length of time controlling aircraft, amongst others
(Manning et al., 2002). This is relatable to nursing in that handoffs are a common task in
nursing. Additionally, number of aircraft controlled is parallel to number of patient assignments
Activity type. The type of activity has shown to be related to nursing workload. One study by Upenieks, Kotlerman, Akhavan, Esser, and Ngo (2007) examined the variability of nursing
workload into three categorical variables. First were value-added operations consisting of direct
or indirect care such as taking vital signs and giving medications. Second were non-value-added
items such as looking for equipment or personnel. Lastly, items such as transcribing orders and
writing care plans were categorized as necessary. Variability, measured with chi-squared tests
and logistical regression, between the two units studied most notably related to necessary and
non-value-added activities. Workload was defined by workload activities (e.g. value-added,
necessary, and non-value-added care), and standards were set based on AB 394 regulatory
staffing ratios (Upenieks et al., 2007). The units were otherwise similar in staffing and patient
census, so it appeared workload was closely related to the type of activity. Workload was
increased for tasks such as looking for equipment or personnel, and transcribing orders
(non-value-added and necessary items, respectively). (Upenieks et al., 2007).
Time pressure. Other research has investigated the interactive effects of perceived time pressure as a workload driver and burnout on patient safety. A cross-sectional survey of 458
nurses across 90 units in two medical facilities in Taiwan found that time pressure does not
independently correlate to reduction in patient safety, but an interaction effect occurs for nurses
that perceive time pressure and are also characterized as high-burnout nurses (Teng, Shyu,
Chiou, Fan, & Lam (2010). Additionally, Athènes et al. (2002) developed a workload measure
that used time pressure in its equation. This measurement is called Traffic Load Index (TLI)
generated from the Air Traffic Control (ATC) domain relying on ATC complexity and controller
workload. The TLI ranges from 1 (basic load) to 3.5 (aircraft in conflict), and incorporates two
gravity or uncertainty, and urgency, or more appropriately, time pressure This rating is assigned
to each individual aircraft, and all aircraft are then added for the entire sector to generate a total
TLI (Athènes et al., 2002). Therefore, it is suggested that time pressure, at least in some part,
influences workload. This is relevant to nursing in that uncertainty and urgency (time pressure)
are common elements to a nurse’s work. There is also a parallel to nursing in that the individual
aircraft can be likened to an individual patient, and the entire sector (collection of aircraft) is
similar to the entire nurse’s assignment (patient load).
Physical expenditure. A multi-dimensional approach to workload, especially implementing experimental factors such as physical and psychological workload (tiredness), was introduced
earlier (Kwicien et al., 2012). Physical expenditure is a continuum of extending work to its
fullest capacity until the subject is fatigued; research by Horstman, Morgan, Cymerman, and
Stokes, 1979 has indicated that perceptual and physiological changes occur linearly during
sustained work over time. Additionally, the perception of fatigue plays a critical role in the
decision to assess one’s expenditure and ultimately discontinue work (Horstman et al., 1979).
Physical expenditure, as a workload driver, can be measured in practice. Crouter, Schneider,
Karabulut, and Bassett Jr. (2003) tested and promoted the use of ten electronic pedometers with
various specifications and sensitivities to find that pedometers are most accurate in measuring
steps versus distance traveled, and even more so than measuring calories. Crouter et al. (2003)
measured energy cost, number of steps, and distance travelled in identifying items relating to
physical expenditure. The current study was concerned with these elements as they relate to
resources required from the system imposed on the user (nurses). Pedometers are generally
believed to be accurate and reliable for measuring physical activity, and although there is
they are most accurate for measuring steps (Crouter et al., 2003). Note this is an indirect
measure of physical expenditure. This research implemented a pedometer similar to those
mentioned above to measure steps as a physical element of the workload analysis.
Skill-Rule-Knowledge-based Decision Making as a Potential Workload Driver
Workload, as measured by decision making and behavior, can be categorized into skill,
rule, and knowledge (SRK) framework proposed by Rasmussen (1983). The model predicts
certain modes of behavior and decision making that occurs within a hierarchy of conscious effort
and mental activity. Skill-based behavior occurs at an unconscious level organized by automated
and integrated behavioral patterns (lowest workload); these elements of decision making are
generated from sensory input, and signals from the environment. The more sensory input that an
individual must attend to equates to more workload. Rule-based behavior relies on known rules
or procedures learned during previous attempts; it may also include conscious problem solving
(moderate workload); these elements are generated from sensory input, but take longer to
incorporate. Again, the more rules that are sorted through and applied, the more workload
imposed on the individual. Last, knowledge-based behavior is concerned with the highest
conceptual level of reasoning, and it is goal-controlled; goals are clearly determined after
examining the current state of the environment and motives of the person. Trial and error is a
staple of this level of decision making, and knowledge-based behavior requires the most mental
activity; workload is increased if there are multiple goals. The model proposed identification,
decision of task, and planning for knowledge-based decisions based on sensory input and
symbolization (Rasmussen, 1983). This stage is the highest workload due to the complexity of
the process (multiple steps), and the amount of time necessary to complete this type of decision.
(skill, rule, and knowledge with knowledge being highest workload), and within each level
workload varies by the quantity of the data (e.g. sensory input for skill-based decision making).
Cognitive Work Analysis (CWA)
A tool for systematic examination of sources of workload drivers in nursing domain is a
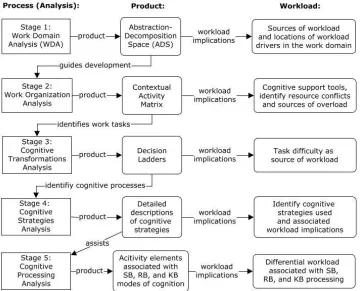
Cognitive Work Analysis (CWA). The CWA is used as an outline to model complex
socio-technical systems, and it is broken down into six stages (Lintern, 2009). This research made use
of five of the six stages to provide a comprehensive analysis of workload in nursing (see Figure
1).
Stage 1. The Functional Work Structure or Work Domain Analysis (WDA) is a technique
within CWA that creates a representation of a socio- technical systems work domain, known as
the abstraction–decomposition space (ADS). The ADS identifies the important,
activity-independent structure of the work domain, to aid researchers in understanding the necessary
values and priorities, work functions, technical functions, and physical resources to fulfill the do-
main purpose of the complex socio-technical system. The purpose of the ADS is to identify
aspects of a work domain that either support the achievement of the domain purpose or constrain
against it. The typical ADS representation portrays the domain purpose as the final element
composed of more detailed levels that follow in a hierarchical fashion. The domain purpose is
listed at the top of the representation, followed by the domain values and priorities, the work
function to obtain the values and priorities, the technical functions necessary to fulfill the work
functions, and ending in the physical resources required to fulfill the technical functions (either
people for socio-technical systems, or technological components for technical systems). Within
Links between nodes at different levels represent means-ends relationships between the linked
nodes.
Stage 2. Partitioning and Organization of Work or Work Organization Analysis (WOA)
focuses on domain functions, as identified in the ADS, work situations, which are the various
situational contexts in which work takes place, and work tasks, which are the distinctive
outcomes to be achieved. The product of this stage of analysis is a Contextual Activity Matrix.
Stage 3. Cognitive Transformations Analysis examines cognitive states established during
task execution, and cognitive processes used to effect the transitions between states. The product
of this stage of analysis is a suite of decision ladders, originally developed by Rasmussen
(Rasmussen, Pejtersen, & Goodstein, 1994). Decision ladders are an extremely powerful tool to
investigate just how operators perform their tasks and what information they need to do so.
Stages 4 and 5. Cognitive Strategies Analysis and Cognitive Processing Analysis focus on
the reasons that a worker may select one strategy in preference to another or may transition
between strategies during execution of a cognitive process and identifies the skills-, rules, or
knowledge-based modes of cognition (Rasmussen, 1983). The products of these stages of
analysis are detailed description of potential strategies and of the factors that will prompt
selection of one strategy over another, as well as of the activity elements associated with the
Figure 1. Cognitive Work Analysis (CWA) indicating all stages implemented for current study
Purpose of the Research
The purpose of this research was to examine nurses’ workload within the framework of
CWA. A holistic approach such as CWA to allow for accurate mapping of workload drivers in
the nurses’ work environment and development of interventions to reduce excessive workload
and its unwanted consequences. The data generated from constructing the products of the CWA
(i.e. abstraction-decomposition space and contextual activity matrix) provided a systematic
approach to differentiating aspects of nursing workload, and ultimately helped identify
domain-specific workload drivers. The CWA, in conjunction with observed data, contributed to a
multi-dimensional and comprehensive approach to describing workload in nursing. The data was then
analyzed to study additional relationships with safety and performance measurements.
The results of the CWA will serve as a guide to further estimation of workload drivers and
the potential degradation of care. It is expected that a systematic representation of the nursing
work domain will help focus on specific aspects of nursing that show a strong relationship with
workload. Specifically, the abstraction-decomposition space from the WDA will map workload
drivers within nurses’ work domain and support accurate interventions where excessive
workload may occur.
Thesis
Specifically, this research examined the following thesis: Identifying workload drivers
from the CWA allowed for estimation of workload experienced by nurses, and further estimation
of reduction in quality of patient care, as well as development of accurate interventions to reduce
excessive workload wherever it may occur. The Cognitive Work Analysis served as a tool to
Hypothesis
Observed workload drivers will be positively correlated with each other (p < .05); these
variables include time pressure, number of primary tasks, mean number of subtasks, total
NASA-TLX score (subjective workload), all six dimensions of NASA-NASA-TLX, scores on
skill-rule-knowledge (SRK) assessment, patient to nurse ratio, and physical expenditure. There will be 78
correlations generated from this analysis comprised of each individual relationship (e.g. total
Method
Participants
Observations. Per suggestion by our collaborators at Rochester General Hospital’s (RGH)
Center for Clinical Excellence and Performance Improvement, participants were chosen using
convenience sampling from three acute-care units; participants were determined based on who
the researcher was permitted and suggested to observe. Fifteen different RNs (five from each
unit) were observed from the Emergency Department (ED), the gynecologic unit, and Vascular
Surgery. RNs (N =15, 13 women and two men) ranging in experience from 1-13 years (M =
5.40, SD= 3.72) volunteered to participate. The census at the time of observation was also
recorded for each participant ranging from three to eight patients (M= 4.71, SD= 1.33).
Participants were not compensated for their time.
Interviews. RNs (N = 6, all females) were interviewed from various units throughout RGH
ranging in experience from 1-35 years (M = 8.83, SD= 13.51). Four RNs were currently
practicing, three of which were from the same vascular surgery unit as direct observations, and
one from pulmonary progressive care. The remaining two nurses were from the Patient Safety
Institute and Nursing Administration, respectively. The one participant from the Patient Safety
Institute could not complete part of interview.
Materials
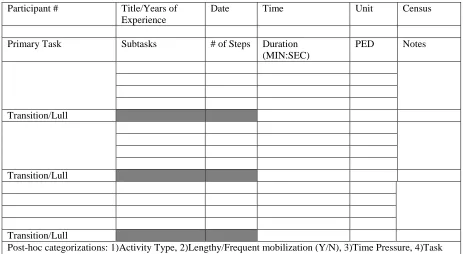
Observations. This stage of the data collection process incorporated a template designed
with specific workload drivers (e.g. time pressure and physical workload) to record basic data
relating to nursing tasks (Figure 2). The study required the use of a stopwatch, pencil and paper,
and other necessary materials to record basic numerical data. Additionally, the NASA-TLX was
used to compare and contrast data observed within the context of the CWA and how the nurses
Interviews. A semi-structured interview was implemented to guide the construction of the
CWA. The associated elements were decision trees, tables, abstraction-decomposition space,
and contextual activity matrix (Appendix B)
Design
This was a descriptive study. The design of the CWA prescribed starting with a general
approach to define nursing functions, and how physical resources are used in the work domain.
This methodology promoted beginning with a macro-ergonomic approach to studying the
nursing domain (i.e. beginning with observations of nursing workload). The CWA became more
precise and focused more on the individual subjects with each subsequent stage (i.e. continuing
with interviews motivated by the data collected from observations).
Procedure
Observations. Participants were given a consent form to read, sign and date, and had the
opportunity to ask questions or express concerns. The full consent form can be found in
Appendix C. Additionally, a third party witness read, signed and dated the same consent form to
signify all rights have been preserved for the participant. Participants were also given a signed
copy for their own records.
The first task in the project was to “shadow” nurses in their working environment. This
allowed the researcher to gain an initial understanding of the working environment and to
observe the work domain within the CWA framework. Observations were recorded using
templates designed by the investigator to collect descriptive statistics and workload drivers
relevant to the research (Figure 2); this process facilitated subsequent analyses. Several
objective measures were collected. These included a list of tasks performed, the frequency each
task was performed during the observation period, and the steps necessary to complete each task.
Participant # Title/Years of Experience
Date Time Unit Census
Primary Task Subtasks # of Steps Duration
(MIN:SEC)
PED Notes
Transition/Lull
Transition/Lull
Transition/Lull
[image:33.612.92.555.70.324.2]Post-hoc categorizations: 1)Activity Type, 2)Lengthy/Frequent mobilization (Y/N), 3)Time Pressure, 4)Task Complexity, 5) SRK
Figure 2. Direct observation template implemented for data collection. The transition/lull cell is
only used if necessary; otherwise, recording continued through more than just four cells if more than four subtasks are observed.
calculated with the use of a pedometer worn by the researcher shadowing a nurse. Time,
measured in seconds, was rounded to the nearest “5” (i.e. if a nurse took 14 seconds to complete
a task, 15 seconds was recorded). Data collection focused on primary tasks (e.g. dispensing
medications), and the associated sub-tasks (e.g. walking to the medication room, pulling the
medication from the computer, delivering medication to patient, and documentation on
computer). This is a condensed and simplified example. Time and steps taken were recorded for
each subtask, with relevant notes, if necessary (e.g. participant had to attempt log in three times).
The moment the nurse discretely altered tasks, the process of recording primary and subtasks,
with associated descriptive statistics, was repeated. Observations lasted two hours per
participant. The concept of time pressure was analyzed using a ratio of time required as a
time spent on all tasks by each participant as a proportion of the two hour observation period
(e.g. a nurse spending 60 minutes on tasks during the observation period was assigned a TR/TA
ratio of .50).
Directly following observations, participants completed the NASA-TLX questionnaire (see
Appendix A). Prior to the study, the original NASA-TLX (Hart & Staveland, 1988) was
condensed and adapted slightly. Changes to the original NASA-TLX included re-organizing the
workbook for clearer explanation and usability. Written instructions and a basic tutorial were
provided. The participant was asked to read through the background and meaning of the
NASA-TLX, and all questions were answered. The investigator guided the participant through the
questionnaire explaining each question from each segment. Preliminary data was initially
recorded in the presence of the subject as they completed each part of the questionnaire. The
participant was thanked for their time and effort, and all questions or concerns were addressed.
At the conclusion of each interview, the investigator recorded the raw data, adjusted data, and
final subjective workload data into the forms. Few calculations were made as proposed by Hart
and Staveland (1988) and found in Appendix A.
A post-hoc classification into skill, rule, and knowledge-based (SRK) taskswas
implemented. The proposed workload driver of SRK classification was further analyzed for each
sub-task and each participant in observations to generate a single mean; this score described the
level of conceptual performance worked by each nurse (i.e. this score summarizes all of the tasks
nurses performed into a hierarchy of decision making). The scoring was arbitrary, and not on an
interval scale. The scores were analyzed in accordance with the SRK framework proposed by
Rasmussen (1983). Additionally, experience in observations and feedback from nurses was
critical in making said judgments. Each subtask was analyzed as follows:
motor performance including unconscious and automated patterns of behavior (Rasmussen,
1983). Represented sub-tasks included walking, dialing a telephone number, and entering
rudimentary data. During the post-hoc analysis, if nurses appeared to be operating without
applying known rules, and were merely carrying out the physical requirements of the set of
sub-tasks needed accomplish the primary task, a score of “1” was applied.
2) Rule-based tasks were assigned a numerical value of “2,” and will be represented by stored
rules or procedures that have been learned or communicated by others. These tasks also involve
problem solving, planning, and goal-oriented behaviors (Rasmussen, 1983). Said tasks included
communication and steps involved in dispensing medication. A score of “2” was applied to
these sub-tasks if they were beyond carrying out the physical requirements of the set of sub-tasks
necessary to complete the primary task; this included the nurse performing tasks that every nurse
would perform in that situation (i.e. there were specific steps either dictated by state, hospital, or
unit protocol that the nurse was required to perform). An example of such requirements was for
nurses to read the date of birth and name to the patient before dispensing medication.
3) Knowledge-based tasks were assigned a numerical value of “3,” and were represented by
unfamiliar events with no procedure or rules from previous occasions. Performance is
goal-controlled; plans are generated and deliberated upon with their success determined by trial and
error (Rasmussen, 1983). Examples of these tasks included reviewing detailed and complex
information such as lab reports. Sub-tasks were assigned a value of “3” if the nurse appeared to
be, or vocalized being, in a complex, novel situation. These scenarios, including reviewing lab
reports was determined to be knowledge-based, because nurses were required to retrieve a
collection of medical information from the labs, the patient history, current patient status, and
Each participant received SRK scores for each subtask. The collection of subtasks for each
participant were then assigned a mean SRK score. Each nurse effectively yielded a mean SRK
score represented on a continuum of 1-3 (mean scores closer to 1 were more skill-based
observation data, and scores closer to 3 were more knowledge-based data).
Interviews. Participants were given a consent form to read, sign and date, and then had the
opportunity to ask questions or express concerns. The full consent form can be found in
Appendix C. Additionally, a third party witness read, signed and dated the same consent form to
signify all rights have been preserved. Participants were also given a signed copy for their own
records. The interview protocol followed the methods of Cognitive Task Analysis (CTA;
Crandall, Klein, & Hoffman, 2006), and questions were generated from the results of the Work
Domain Analysis (WDA). This is the prescribed method proposed by Lintern (2009).
Stages 2-5 of the Cognitive Work Analysis (CWA) were completed within the interview
session. Stage 2 (Work Organizational Analysis) represented cumulative data from all six
participants (i.e. a single product was yielded). Stages 3-5 (Cognitive Transformation Analysis,
Cognitive Strategies, and Cognitive Processing Modes) represented individual participant data
(i.e. multiple products were yielded for each stage of the CWA). As prescribed by Lintern
(2009), each subsequent stage began with data from the previous stage. This created a linear,
systematic data collection process for interviews. Data from the questions regarding “Work
Tasks” provided support for the Cognitive Transformations Analysis. The subject was guided
through a decision ladder based on a work task that was critical and/or interesting to the
investigator. An ongoing dialogue was used between the participant and the investigator to
promote clarity and understanding. This process was repeated for a second task, and a second
decision ladder was completed. Next, a Cognitive Strategies Analysis was completed for the
narrative as to why this strategy can be implemented. Again, the participant was guided through
this process, and an ongoing dialogue was used between the investigator and the participant. The
final product, Cognitive Processing Modes, was completed after the interviews. The interview
template can be found in Appendix B
Population of the Cognitive Work Analysis (CWA)
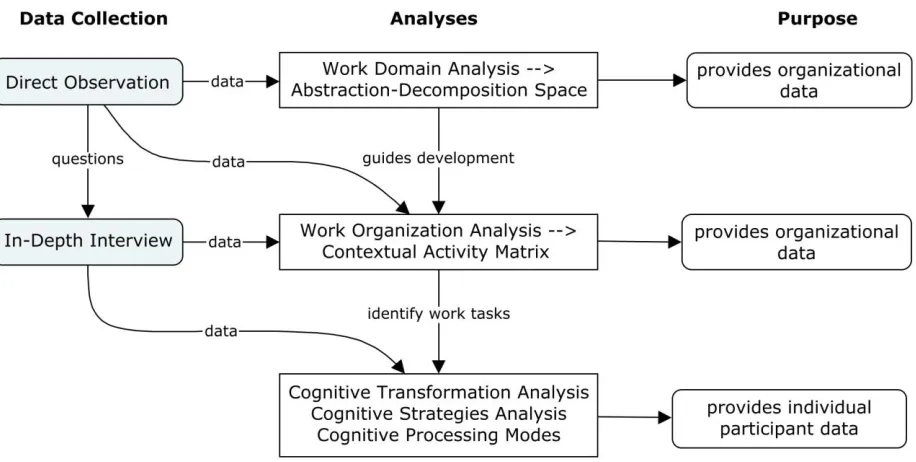
Data from a review of relevant literature, direct observations, and interviews was used to
populate the different products from the five stages of the CWA. Population of the CWA with
data is necessarily an iterative process. Literature review, observations, and interviews continued
[image:37.612.76.534.373.604.2]as long as necessary to gather the data available by these methods.
Figure 3. The structure of the methodological process including observations and interviews.
Results
Task Analysis
Observed tasks. Observations of nursing workload identified 284 primary tasks derived
from 15 participants (M = 18.93 primary tasks per participant); the total of 284 includes all
primary tasks performed, and often tasks were the same (e.g. computer work accounted for 41 of
the 284 primary tasks). Data for all 284 primary tasks, including total number of steps, subtasks,
and total time was recorded. Additionally, the mean, median, and standard deviation for subtasks
was recorded (in seconds). Further, 1,965 subtasks were documented for all participants
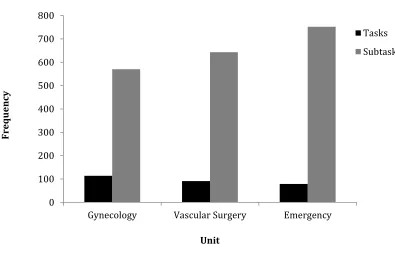
(M = 131 subtasks per participant). Figure 4 illustrates a unit-by-unit analysis of tasks and
sub-tasks. It is evident that as primary tasks decrease in frequency between units, subtasks
[image:38.612.123.518.396.650.2]subsequently increase.
Figure 4. Frequencies of tasks and subtasks by unit. Both tasks and subtasks are represented
0 100 200 300 400 500 600 700 800
Gynecology Vascular Surgery Emergency
Fr
equ
ency
Unit
Formation of categories from observed tasks. The observed tasks were categorized into
19 categories (i.e. “communication with a Patient Care Technician” (PCT) and “communication
with a physician” were simplified to “communication with peer”). Therefore, for analysis, 284
primary tasks were distilled to 19 categories (Table 1). The aforementioned 19 observed tasks
were further analyzed to the five most prevalent tasks that would lead to beginning to construct
the Work Domain Analysis (WDA). This analysis provided additional perspective of the work
[image:39.612.63.520.375.448.2]environment and enhanced understanding of workload drivers. This analysis is displayed in
Table 2.
Table 1
Categories of Primary Tasks
Admission Check on Patient Intravenous Phone Call
Assistance (patient) Clean/Organize Room Material Management Report
Assistance (peer) Communication (patient) Medications Retrieve Items Blood Pressure Communication (peer) Monitor Telemetry Visit Patient
Blood Sugar Computer Paperwork
Note. Nineteen categories were formed from the 284 tasks generated from observations of 15
[image:39.612.73.518.569.674.2]Registered Nurses.
Table 2
Most Common Tasks
Primary Task Frequency Sub-tasks Time (sec.)
M SD Pedometer
M SD
Computer 41 5.50 178.49 169.30 9.10 12.23 Medication 32 15.78 326.78 194.52 76.69 48.54 Communication 22 1.41 80.82 71.54 7.09 9.36 Patient Check 18 6.94 165.83 136.82 30.06 25.61 Phone Call 15 2.40 52.53 33.62 9.67 11.72
Tasks identified in interviews. Primary tasks were also identified from interviews.
Inherently, tasks nurses described were more specific than observed tasks (i.e. observations were
viewed through a wider lens than what a subject matter expert can provide). Additionally, data
collected from interviews was more in-depth as Cognitive Work Analysis was used as a
framework to design questions. This approach yielded tasks related to decision making and the
way in which nurses organize their work; it is a more personal account of nursing work, rather
than the objective, broad approach of observation. One hundred primary tasks were identified
through the various stages of the CWA. Many of these tasks were similar, if not identical, to the
primary tasks observed (e.g. checking on a patient occurred 24 times in the CWA and 18 times in
observations). Subtasks were not identified in this analysis as the nurses’ answers were
high-level descriptions of their work (i.e. “avoid decontamination” was mentioned, but not the
requisite steps to complete the task).
Synthesis of tasks (observations and interviews). The five most common tasks were then
combined with those same tasks identified in interviews (Figure 5). Note that in interviews,
multiple references to a task that are similar are counted separately (i.e. a nurse mentioned they
check if a patient is unsteady, confused, or needs assistance; this response generated three counts
of check on patient). It is evident that common tasks, such as medication and computer work,
were not discussed in interviews with the same frequency as communication and checking on
patient. This finding was a result of nurses not regarding medication or computer work as
relevant to completing the CWA; the interviews making up the majority of stages in the CWA
are driven mostly by cognitive factors, and nurses potentially viewed medication and computer
Figure 5. Combined frequency of most common tasks in observation with tasks identified in
interviews. Dark bars represent data collected from observations, and grey bars represent data collected from interviews.
0 5 10 15 20 25 30 35 40 45
Computer Medication Communication Check on patient Phone call
Fr
equ
ency
Task
Observation
Observations (Workload Drivers)
Organizational and environmental workload drivers. There were four static workload
drivers presented in the literature. The current study only examined patient to nurse ratio. Skill
mix, proportion of RN’s, and patient acuity were not collected because the study aimed to
simplify the organizational factors to include only patient to nurse ratio.
Patient to nurse ratio. The number of patients assigned to each nurse was documented prior to observation. This statistic provided the researcher a baseline measure of workload that
could be expected and documented at the onset of observation. Overall ratios were calculated
[image:42.612.72.521.403.475.2]after data collection was complete, and a unit-by-unit analysis is provided below (Table 3)
Table 3
Patient to Nurse Ratio between Units
Unit M SD
Gynecology (N=5) 5.80 1.48
Vascular Surgery (N=5) 4.40 0.89
Emergency (N=5) 3.75 0.50
Overall (N=15) 4.71 1.33
Note. The patient to nurse ratio for Emergency includes only four participants; one nurse worked
triage, and their assignments are dynamic and variable.
Variable workload drivers. Workload drivers that could be observed, documented,
described, and eventually analyzed were studied, as well. These elements of workload were
prone to vary throughout the observation period.
Activity type. Workload was also examined by the type of activity that the nurse performs. Consistent with the findings of Upenieks et al. (2007) three activity types were documented and
IV, or a dressing change), necessary activities (e.g. computer work and chart review), and
non-value added activities (e.g. search for patient belongings or locate chart). Again, there were 284
tasks identified in observation, in which 140 were necessary, 12 were non-value added, and 132
were value-added activities. Gynecology and Vascular Surgery showed similar results (more
necessary than value added tasks). However, Emergency indicates a different relationship; there
are more value added activities than necessary activities. Across all units non-value added
[image:43.612.80.528.289.607.2]activities were lowest in frequency (Figure 6).
Figure 6. Unit-by-unit analysis of activity type illustrating necessary, value added, and non-value
added tasks; activity types were taken from concepts generated by Upenieks et al. (2007). 0
10 20 30 40 50 60 70
Gynecology Vascular Surgery Emergency
Fr
equ
ency
Unit
Necessary
Value added
Time pressure.Primary tasks were also observed for time pressure. Individual
participants’ data was recorded for the total time that primary tasks elapsed. Also, the mean and
standard deviation for all primary tasks was represented. Last, and most importantly as it relates
to time pressure, the ratio of time required (total time spent on primary tasks) and time available
(two hour observation period) was calculated. Gynecology displayed the most time pressure
with the TR/TA ratio being the highest. This finding illustrated that nurses on this unit put in
work by means of the primary tasks they completed a little over half of what was technically
possible. Emergency displayed the lowest time pressure. However, although Vascular Surgery
didn’t have as much time pressure as gynecology, nurses did spend the most average time on
[image:44.612.78.525.431.502.2]primary tasks (189.25 seconds). Table 4 below illustrates a unit-by-unit analysis of the raw data.
Table 4
Measurements of Time on Primary Tasks
Unit Total Time M SD TR/TA Gynecology (N=5) 20,444 179.33 181.09 .568 Vascular Surgery (N=5) 17,222 189.25 176.80 .478 Emergency (N=5) 13,735 173.86 153.05 .382 Overall (N=15) 51,401 180.99 171.84 .476
Note. Measurements are in seconds. Also, included are analyses of each individual unit
including a time pressure ratio indicated by the column “TR/TA.” The time pressure ratio (TR/TA) was calculated by dividing total “time required” for each participant and dividing by total “time available” (total observation and work time = 120 minutes).
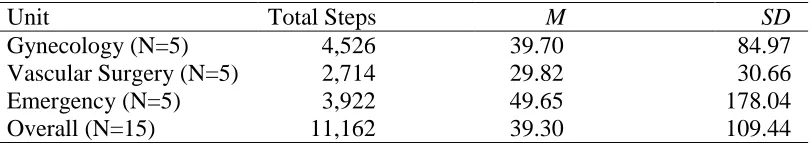
Physical expenditure.Tasks were also analyzed to investigate physical expenditure by number of steps walked. Total steps, mean, and standard deviation for each group of five
participants were calculated. Gynecology displayed the most total steps, and Vascular Surgery
indicative of the nursing work being more physically laborious on these units (i.e. more walking
[image:45.612.74.480.209.281.2]may be inherent to that unit based on design). Table 5 below illustrates the unit-by-unit analysis.
Table 5
Measurements of Physical Expenditure of Primary Tasks
Unit Total Steps M SD
Gynecology (N=5) 4,526 39.70 84.97 Vascular Surgery (N=5) 2,714 29.82 30.66
Emergency (N=5) 3,922 49.65 178.04
Overall (N=15) 11,162 39.30 109.44
Subjective workload (NASA-TLX).Post-observation assessments of workload experienced by each participant analyzed results on two factors (comparisons between units’ final weighted
ratings and workload demand type). Emergency yielded the highest final weighted rating of
NASA-TLX. Vascular Surgery was closest to the overall mean (52.84 and 53.24, respectively).
Gynecology displayed the lowest NASA-TLX rating. Workload demand type indicated that
temporal demand, mental demand, and perceived effort were influential dimensions of subjective
workload experienced by the nurses observed. By comparison, physical demand, frustration, and
perceived individual performance were less important to nurses when assessing their overall
Table 6
Unit-by Unit Comparison of Final Weighted Rating of NASA-TLX
Unit M SD
Gynecology (N=5) 42.08 20.56
Vascular Surgery (N=5) 52.84 11.92
Emergency (N=5) 64.80 10.19
Overall (N=15) 53.24 18.20
Table 7
Comparison of Workload Demand Type
Demand Type M SD
Temporal Demand 64.13 20.56
Mental Demand 61.60 23.02
Effort 59.33 19.59
Physical Demand 39.80 23.66
Frustration 35.00 21.34
Performance 23.60 11.20
The results of the nurses’ perspective of their work was inconsistent with the unit-by-unit
analysis of workload drivers mentioned (frequency of tasks, physical expenditure, and time
pressure). Gynecology was observed having the most workload (e.g. most primary tasks, most
walking, and most time spent on tasks). However, nurses on this unit reported the lowest
NASA-TLX overall adjusted ratings (M = 42.08, SD = 20.56). Additionally, the ED had the
lowest workload in terms of patient to nurse ratio, activity type (fewest non-value added and
necessary tasks) (Upenieks et al., 2007), and time pressure, but reported the highest subjective
[image:46.612.73.450.281.379.2]Workload Drivers’ Correlation Analysis
Correlation matrix. A correlation matrix was generated between workload drivers. Each participant generated one score for objective variables, such as time pressure (time required
divided by time available), number of tasks, mean number of subtasks, SRK continuum, patient
to nurse ratio, and physical expenditure. Additionally, subjective variables were included, such
as the total score on the NASA-TLX, and also six separate scores for each dimension (e.g.
mental workload). This analysis yielded 66 different relationships amongst the variables (Table
8). There were 23 significant correlations at the .05 significance level. However, 13 of the
significant relationships were NASA-TLX scores compared to each other (e.g. mental demand
and total demand or mental demand and physical demand, etc.) Due to the inherent nature of
these scores being correlated with each other, they were not analyzed. Therefore, 10 significant