before-after and cluster randomized controlled study
D'Acremont
et al.
R E S E A R C H
Open Access
Reduction of anti-malarial consumption after
rapid diagnostic tests implementation in Dar es
Salaam: a before-after and cluster randomized
controlled study
Valérie D
’
Acremont
1,2,3*, Judith Kahama-Maro
1,2,3, Ndeniria Swai
3, Deo Mtasiwa
4, Blaise Genton
1,2,5and
Christian Lengeler
1,2Abstract
Background:Presumptive treatment of all febrile patients with anti-malarials leads to massive over-treatment. The aim was to assess the effect of implementing malaria rapid diagnostic tests (mRDTs) on prescription of anti-malarials in urban Tanzania.
Methods:The design was a prospective collection of routine statistics from ledger books and cross-sectional surveys before and after intervention in randomly selected health facilities (HF) in Dar es Salaam, Tanzania. The participants were all clinicians and their patients in the above health facilities. The intervention consisted of training and introduction ofmRDTs in all three hospitals and in six HF. Three HF withoutmRDTs were selected as matched controls. The use of routinemRDT and treatment upon result was advised for all patients complaining of fever, including children under five years of age. The main outcome measures were: (1) anti-malarial consumption recorded from routine statistics in ledger books of all HF before and after intervention; (2) anti-malarial prescription recorded during observed consultations in cross-sectional surveys conducted in all HF before and 18 months after mRDT implementation.
Results:Based on routine statistics, the amount of artemether-lumefantrine blisters used post-intervention was reduced by 68% (95%CI 57-80) in intervention and 32% (9-54) in control HF. For quinine vials, the reduction was 63% (54-72) in intervention and an increase of 2.49 times (1.62-3.35) in control HF. Before-and-after cross-sectional surveys showed a similar decrease from 75% to 20% in the proportion of patients receiving anti-malarial treatment (Risk ratio 0.23, 95%CI 0.20-0.26). The cluster randomized analysis showed a considerable difference of anti-malarial prescription between intervention HF (22%) and control HF (60%) (Risk ratio 0.30, 95%CI 0.14-0.70). Adherence to test result was excellent since only 7% of negative patients received an anti-malarial. However, antibiotic prescription increased from 49% before to 72% after intervention (Risk ratio 1.47, 95%CI 1.37-1.59).
Conclusions:Programmatic implementation ofmRDTs in a moderately endemic area reduced drastically over-treatment with anti-malarials. Properly trained clinicians with adequate support complied with the
recommendation of not treating patients with negative results. Implementation ofmRDT should be integrated hand-in-hand with training on the management of other causes of fever to prevent irrational use of antibiotics.
* Correspondence: [email protected] 1
Swiss Tropical and Public Health Institute, Socinstrasse 57, 4002 Basel, Switzerland
Full list of author information is available at the end of the article
Background
One essential component of the global malaria control strategy is prompt diagnosis and treatment (within 24 hours of onset of illness) with an effective drug [1]. Because of the scarce availability of laboratory facilities and the high mortality of malaria in young children, presumptive treatment in case of fever was seen as the only practical solution to improve child survival. This strategy thus became part of the Integrated Management of Childhood Illness (IMCI) decision chart. The strategy of presumptive treatment was easily and rapidly adopted by health workers to such an extent that it started also to be applied beyond the initial high-risk group: 1) to children older than five years and even adults; 2) in low endemicity areas; and 3) in setting where laboratory diagnosis was actually available [2]. This led to a situa-tion in which the principle of proper diagnosis prior to treatment became an exception rather than the rule. Whatever the medical history (when taken) and irre-spective of the clinical examination (if done at all), the same treatment is prescribed: an anti-malarial drug, pos-sibly supplemented by an antipyretic. When the patient returns with persistent fever a second-line anti-malarial drug is given, sometimes intravenously. This may go on until either the spontaneous recovery of the patient from his/her (often viral) illness or up to a deterioration of the patient’s condition due to an unrecognized bac-terial infection. The strategy of presumptive treatment of all fevers with anti-malarials leads clinicians to believe that all fevers are due to malaria, resulting in a massive over-diagnosis [3,4], and more importantly to ignoring non-malaria causes of fever that have similar, or even higher case fatality rates than malaria [5,6].
The availability of reliable, easy-to-use and affordable malaria rapid diagnostic tests (mRDTs) allows now a realistic switch from presumptive treatment to labora-tory-confirmed diagnosis and treatment upon result [7]. This is especially important considering the trend of malaria decline in Africa, which leads to a strong reduc-tion in the proporreduc-tion of fevers due to malaria [8]. There is general agreement that diagnosis should be part of fever case management and WHO has just chan-ged its recommendation from presumptive to labora-tory-based diagnosis and treatment upon result [9]. Hence, the discussion is now no more on whether laboratory diagnosis for malaria should be deployed [10], but on how best to implement it. Zambia was the first sub-Saharan country to deploy mRDT at the national scale in 2004 followed by Senegal in 2006. Since then, several countries have adopted laboratory-confirmed diagnosis, even in highly endemic areas. However, the implementation ofmRDT at scale poses many challenges. Rigorous procedures to train and supervise clinicians, to strengthen procurement systems
and to ensure quality assurance need to be established. Strong monitoring and evaluation plans need to be put in place. The impact of large-scale implementation of
mRDT needs to be carefully assessed in different set-tings and health systems to ensure that it actually reduces over-diagnosis, wastage of anti-malarial drugs and prevents patient suffering.
In order to evaluate the impact ofmRDT implementa-tion on anti-malarial use and fever case management, a large study was conducted under near-programme con-ditions in Dar es Salaam, the main urban setting of Tan-zania with low to moderate malaria endemicity. The primary objective was to measure the change in overall anti-malarial consumption at different levels of the health system. Secondary objectives were to assess the effect of mRDT implementation on the number and type of patients tested and/or treated for malaria, the number of non-malaria laboratory tests performed and the number of antibiotic prescriptions. Health outcomes were not considered since the safety of withholding anti-malarials in febrile children with a negative result for a rapid test was the subject of a rigorous separate assessment published elsewhere [11]. To ensure robust-ness in the findings, data were collected from two inde-pendent sources and effects ofmRDT implementation evaluated with three different study designs, including a cluster randomized controlled analysis. Introducing
mRDT represents a new approach to managing patients, and requires thus clinicians’ behaviour change. The health facility was therefore used as allocation and ran-domization unit and not the patient as in previous stu-dies [12-14].
Methods
Study setting and population
the staff to participate. One HC/D in each trio was then randomly assigned to be the control HF. There were thus six intervention HF (two HC/D per municipality) and three control HF (one HC/D per municipality); the intervention was also implemented in the three hospitals but for which no control could obviously be found (Figure 1).
Intervention
In February 2007, after a sensitization meeting with the persons in charge of the nine intervention HF, the City Medical Officer of Health (JKM, who was also one of the investigators) and representatives of the Municipal Medical Offices of Health, five one-day training sessions were organized and attended by a total of 116 clinicians, 31 laboratory technicians, 31 nurses and three pharma-cists. The training included one hour on the situation of malaria in Tanzania, half an hour on malaria diagnosis in Africa and in Dar es Salaam, one hour on the clinical use of each type of malaria tests, one hour practical in which participants performed amRDT on each other, and finally two hours of group work on five clinical case studies. The guidelines for the use of mRDTs were the
following: 1) only patients complaining of fever should be tested; 2) no anti-malarials should be prescribed when the result of the mRDT is negative, regardless of the age of the patient; 3) for non-malaria problems, IMCI guidelines should be followed in children under five years.
Investigators then went to each HF to discussmRDT implementation using a standard check-list to be filled in by the focal person for mRDT. Between mid- and end of March 2007, the first consignment of mRDTs was brought to each HF and a supervision visit con-ducted 3 days later. Thereafter, supervision took place 1, 2, 5, 10 and 15 months aftermRDT introduction. Speci-fic problems in 4 HF were addressed by one or two additional on-site meetings. Importantly no incentives were given to any health worker. Control HF were given
mRDTs after 18 months (November 2008), after a simi-lar training of their clinical staff.
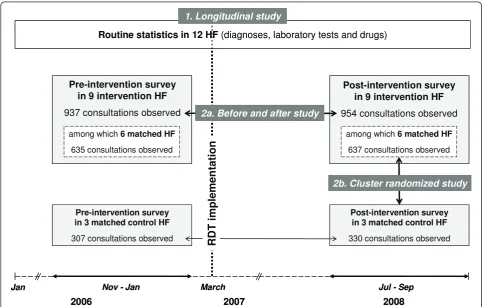
Project design
In order to come to robust conclusions data were col-lected with two complementary tools, and outcomes assessed with three different designs (Figure 1).
Pre-intervention survey in 9 intervention HF
937 consultations observed
Post-intervention survey in 9 intervention HF
954 consultations observed
2007 2008
2006
Pre-intervention survey in 3 matched control HF
307 consultations observed
Post-intervention survey in 3 matched control HF
330 consultations observed
Jan
among which6 matched HF
637 consultations observed among which6 matched HF
635 consultations observed
2b. Cluster randomized study
Nov - Jan March Jul - Sep
Routine statistics in 12 HF (diagnoses, laboratory tests and drugs) 1. Longitudinal study
2a. Before and after study
RDT i
m
plemen
tation
Data collection tool 1: routine statistics from ledger books A longitudinal study based on the continuous monitor-ing of routine statistics (MTUHA books) was conducted in intervention and control HF for a period of 15 months before (including one long and one short rainy season) and 18 months after mRDT implementation (including two long and one short rainy seasons). All MTUHA books from the years 2006 to 2008 were col-lected to get monthly information on the following: number of new attendances, number of specific diag-noses, number of laboratory tests, number of malaria tests and their results. The number of anti-malarials and antibiotics consumed per month per health facility were collected from ledger books in the main stores. To get the monthly consumption for each drug, the total num-ber of tablets, vials or blisters (for artemether/lumefan-trine - ALu) issued by the main store to the different departments of the HF was counted, excluding the drugs issued to another HF. To get the monthly number of ALu dispensed to patients, the number of patients receiving one of the four types of blisters was counted from the books used at the dispensing windows.
Data collection tool 2: cross-sectional surveys of consultation processes
Two cross-sectional surveys were also conducted, one that took place 2-5 months before and the other 15-18 months aftermRDT implementation in the nine inter-vention and three control HF (Figure 1). In each HF, 100 consultations were observed at the Outpatient Department by a person (clinical officer or nurse) that was independent from the health facility and from the research team and did not know what the primary out-come of the study was. In order to lessen the influence of season, 50 consecutive consultations were observed in each HF in a first week and an additional 50 consulta-tions were observed 6 weeks later. The targeted sample size for each of the two surveys (before and after) was thus 1,200 consultations. The sample size of 600 patients in the intervention and 300 patients in the con-trol primary care HF was not calculated to detect a sig-nificant difference on the primary outcome since the effect of the introduction of mRDT on anti-malarial pre-scription was expected to be considerable and hence the sample size needed very small. But a small sample size would have precluded assessing with sufficient confi-dence the effect of mRDT introduction on other out-comes of interest. Hence, the sample size was calculated to allow the detection of a 20% difference in secondary outcomes, i.e. proportion of patients tested and propor-tion of patients prescribed antibiotics (assumed to be both 50% in the intervention group) with a power of 80% and a significance level of 0.05.
The inclusion criteria for attending patients (of any age) were: 1) first consultation for the present problem;
2) absence of severe illness requiring immediate admis-sion or referral; 3) main complaint not being an injury or trauma. As clinicians in Dar es Salaam (and in most places in Africa) tend to consider the diagnosis of malaria even in the absence of fever [2], fever/history of fever was not used as an inclusion criteria, in order to get the full range of situations in which malaria is diag-nosed or treated and thus to compare realistically the results of the cross-sectional surveys with the routine statistics. A standardized questionnaire in Swahili lan-guage was used by the observers while following the consultation process.
A first consent to participate was requested from the observed clinician after explaining him/her the aims of the study and the conditions of observation (confidenti-ality, anonymity and no interference). Informed consent was then requested by the observed clinician from each of his/her patients. The following were observed: com-plaints mentioned spontaneously by the patient, ques-tions asked by the clinician and the corresponding answers by the patient, signs looked for and laboratory tests ordered by the clinician, tests results, diagnoses, drugs and advice given by the clinician.
This cross-sectional information was analyzed using two designs: (1) comparing anti-malarial prescriptions between pre-intervention and 18 months post-interven-tion surveys in the nine intervenpost-interven-tion health facilities (thereafter called before-and-after analysis) and (2) com-paring anti-malarial prescriptions between six
interven-tion and their three matched controls
contemporaneously, during the post-intervention survey (cluster randomized analysis) (Figure 1).
Statistical analyses
For the cross-sectional studies (before-and-after and cluster randomized analyses), the unit of analysis was the patient. All patients observed were included in the study population analysis. Since the number of consulta-tions observed in each facility was almost the same, the weight given to each HF was almost identical and this allowed a direct comparison with the longitudinal study. Comparison of proportions was done by calculating odds ratios using a multilevel mixed-effects logistic regression model to account for clustering. Risk ratios (RR) were calculated from the fitted values for each cell of the 2 by 2 tables. P-values (2-sided) were calculated using Pearson 2א statistics. Data were entered in Epi Info version 3.5.1 and analyzed in STATA version 10.
The level of agreement between results given by the two different sources of data (the routine statistics and the repeated cross-sectional surveys) was measured by the Lin concordance-correlation coefficient [17].
Results
Routine statistics from ledger books - longitudinal study
Nearly all required data could be retrieved from the MTUHA books with a few exceptions: among a total of 3,960 monthly data points to be collected (10 variables measured in 12 HF during 33 months), only 36 were missing. For the monthly drug quantification, missing data were replaced by the mean of all data of the corre-sponding pre- or post-intervention period. Missing monthly numbers of consultations were replaced by the mean of the value from the month before and the month after.
Impact of mRDT implementation on anti-malarial consumption
The number of ALu blisters issued by the main store of the 9 intervention HF decreased from a total of 20’660 per month to 7’933 per month aftermRDT implementa-tion. It decreased in each of the 9 HF with PP ratios ranging from 0.04 to 0.63 (Table 1). When using HF as a unit, the overall PP ratio was 0.32 (95% CI 0.20-0.43) corresponding to an overall decrease of 68%. The impact of mRDT was stronger in dispensaries than in health centres or hospitals (PP ratio 0.26 versus 0.35 and 0.34). There was also a clear trend when analysing the data by municipality (PP ratios 0.32, 0.22 and 0.41 for Munici-pality 1, 2 and 3 respectively). When only looking at the last six months of the study to assess the sustainability of mRDT implementation the results were even better (PP ratio 0.25, 95% CI 0.13-0.37). In the three control HF, the overall PP ratio using the whole period was 0.68 (95% CI 0.46-0.91) (Table 1).
Figure 2 shows the monthly consumption of ALu over time, with the contribution of each HF. The four weight categories of ALu blisters were included, with one blis-ter counting as one anti-malarial treatment course.
There was a marked decrease in ALu consumption just after mRDT initiation and then a further decrease four months later. The initial four months of the intervention period was used to identify and rectify operational pro-blems (use of microscopy instead ofmRDT, lack of trust in laboratory technicians, conflict of interest with private laboratories, and reshuffle of staff) in the four HF where little impact was observed during the first four months.
A similar reduction of injectable quinine consumption was found in each of the nine intervention HF (average PP ratio 0.37, 95% CI 0.28-0.46) (Table 1). For quinine there was also a longer period of observation before
mRDT initiation (15 months) compared to ALu which was only introduced in the country in January 2007. In the three control HF, there was a marked increase in quinine use over the same period (PP ratio 2.49, 95% CI 1.62-3.35).
Table 1 shows that in some HF, the number of issued ALu blisters was much higher than the actual number of positive patients (median excess: 168%). These amounts represent the quantities‘consumed’ by the HF and not necessarily the numbers of blisters received by patients. When looking at data from dispensing books after mRDT implementation, this excess of quantities consumed over quantities dispensed was confirmed (median excess: 145%). “Mishandling” of drug stocks is likely to be the main reason for the over-consumption of anti-malarials after mRDT implementation (although at a much lower level than before).
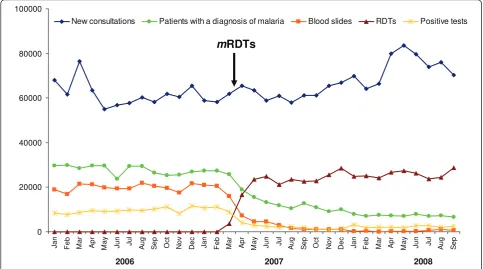
Impact of mRDT implementation on malaria testing In the nine intervention HF, from January 2006 to March 2007 (before mRDT initiation) a total of 20,143 blood slides were performed on average per month. AftermRDT initiation, 27,398mRDTs and 768 blood slides were per-formed on average per month (Figure 3). Although this was not formally recommended during training, micro-scopy was almost entirely replaced bymRDT as first-line malaria test, except for a few special cases (admitted patients, persisting fever in outpatients with malaria, dur-ing short periods ofmRDT stock out). The number of patients attending the nine intervention HF for a new con-sultation increased slightly over time (61’642 before and 68’065 after mRDT implementation on average per month). The proportion of patients tested for malaria increased in all health facilities except 2, from a median of 30% to 42% (PP ratio 1.21) whenmRDTs were introduced, and thereafter the proportion of patients tested was stable up to the end of the project (Figure 3).
Impact of mRDT implementation on diagnoses
respiratory infection, pneumonia, diarrhoeal diseases and urinary tract infections there was no change or even an increase after mRDT implementation (PP ratio 1.02, 1.29, 1.15, 1.46, respectively). The number of“ill defined syndrome” as well as of “other diagnoses” increased much more (PP ratios 2.14 and 2.36, respectively). In the three control HF, there was no change in the num-ber of patients with a diagnosis of malaria (PP ratio 1.03, 95% CI 0.82-1.24), while acute respiratory infec-tions, pneumonia, diarrhoeal diseases and urinary tract infections increased aftermRDT implementation (PP ratio 1.59, 1.30, 1.55 and 2.12, respectively).
Impact of mRDT implementation on malaria positivity rate At the time of microscopy, the positivity rate of the rou-tine malaria tests in the nine HF was very high: 49%
(range 13 - 88%) and it was similar in the three types of HF: 43% in hospitals, 60% in health centres and 57% in dispensaries. After intervention, the positivity rate of rou-tinemRDTs was only 8% (range 6 - 12%)(Figure 3), which is in line with what had been shown in previous studies using expert microscopy in Dar es Salaam [15]. The per-formance of routinemRDTs evaluated in one health cen-tre was excellent (97% sensitivity, 97% specificity) [18]. Impact of mRDT implementation on antibiotics consumption
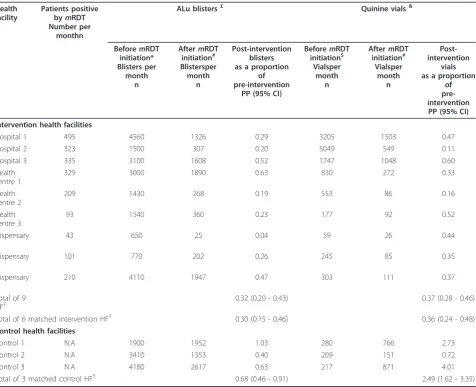
[image:7.595.62.539.120.507.2]The total consumption of oral antibiotics did not change after mRDT implementation (PP ratio 1.02, 95% CI 0.92-1.13). In control HF, the total consumption of all oral antibiotics increased a bit more (PP ratio 1.26, 95% CI 1.00-1.52) than in the intervention HF (PP ratio 1.14, Table 1 Routine statistics of ledger books: average monthly number of patients positive bymRDT, and ALu blisters & quinine vials issued by the main store, before and aftermRDT implementation, in intervention and control health facilities
Health facility
Patients positive
bymRDT
Number per monthn
ALu blisters£ Quinine vials&
BeforemRDT
initiation* Blisters per
month n
AftermRDT
initiation# Blistersper month
n
Post-intervention blisters as a proportion
of pre-intervention
PP (95% CI)
BeforemRDT
initiation$ Vialsper
month n
AftermRDT
initiation# Vialsper
month n
Post-intervention
vials as a proportion
of pre-intervention
PP (95% CI)
Intervention health facilities
Hospital 1 495 4560 1326 0.29 3205 1503 0.47
Hospital 2 323 1500 307 0.20 5049 549 0.11
Hospital 3 335 3100 1608 0.52 1747 1048 0.60
Health centre 1
329 3000 1890 0.63 830 272 0.33
Health centre 2
209 1430 268 0.19 553 86 0.16
Health centre 3
93 1540 360 0.23 177 92 0.52
Dispensary 1
43 650 25 0.04 59 26 0.44
Dispensary 2
101 770 202 0.26 245 85 0.35
Dispensary 3
210 4110 1947 0.47 303 111 0.37
Total of 9 HFŦ
0.32 (0.20 - 0.43) 0.37 (0.28 - 0.46)
Total of 6 matched intervention HFŦ 0.30 (0.15 - 0.46) 0.36 (0.24 - 0.48)
Control health facilities
Control 1 N.A 1900 1952 1.03 280 766 2.73
Control 2 N.A 3410 1353 0.40 209 151 0.72
Control 3 N.A 4180 2617 0.63 217 871 4.01
Total of 3 matched control HFŦ 0.68 (0.46 - 0.91) 2.49 (1.62 - 3.35)
£
One blister of ALU is needed for one anti-malarial course, whatever the age or weight of the patient,&
Between 2 and 6 vials are used per anti-malarial course,
* observation period of only 3 months because ALu only introduced in Tanzania in January 2007,#
observation period of 18 months,$
observation period of 15
95% CI 1.00-1.28). In general, the amounts of antibiotics consumed by HF were very high: about 38% of newly attending patients received an oral antibiotic after
mRDT implementation versus 40% before.
Impact of mRDT implementation on laboratory tests other than malaria
The number of urine analysis and direct stool examina-tion increased slightly after mRDT implementation (PP
ratios 1.18 and 1.23 respectively) in intervention HF. In control HF, both type of investigations increased more (PP ratios 1.66 and 1.74 respectively).
Cross-sectional surveys: before-and-after analysis
The before-and-after analysis was based on the repeated cross-sectional observation of consultations before and after intervention in nine intervention HF (Table 2). No 0 5000 10000 15000 20000 25000 Ja n Fe b Ma r Ap r Ma y J u n J u l A ug S e p Oc t No v D e c Ja n Fe b Ma r Ap r Ma y J u n J u l A ug S e p
dispensary 3 dispensary 2 dispensary 1
health centre 3 health centre 2 health centre1
hospital 3 hospital 2 hospital 1
0 2000 4000 6000 8000 10000 12000 14000 16000 18000 Ja n Ma r Ma y J u l S e p No v Ja n Ma r Ma y J u l S e p No v Ja n Ma r Ma y J u l S e p
dispensary 3
dispensary 2
dispensary 1 health centre 3
health centre 2
health centre1 hospital 3
hospital 2 hospital 1
mRDTs
ALu treatments
mRDTs
Quinine vials
2007 2008
[image:8.595.60.537.88.586.2]2006 2007 2008
patient refused to be observed. The proportions of chil-dren less than five years, chilchil-dren 5 to 15 years and adults were similar in the pre- and the post-intervention surveys (52%, 14% and 34% versus 53%, 16% and 32%, p = 0.3), while slightly more female patients were included in the pre-intervention survey (60% versus 54%, p = 0.02).
Impact of mRDT implementation on anti-malarials prescription
Consultation observations performed before and after
mRDT implementation revealed a decrease of 77% (from 75% to 20%) in the total number of patients receiving an anti-malarial treatment (Table 2). This decrease (RR 0.23, 95% CI 0.20-0.26) was slightly more pronounced in the subgroup of patients not complaining of fever (RR 0.16) than in the group complaining of fever (RR 0.25). This reduction was mainly due to a drastic change in the adherence of clinicians to test results. At the time of microscopy, 53% (95% CI 47-60) of negative patients were treated with anti-malarials while this proportion was only 7% (95% CI 4-11) after the introduction ofmRDTs.
Impact of mRDT implementation on malaria testing The overall proportion of patients tested for malaria increased by 26%, from 68% to 83%, RR 1.26 (95% CI 1.19-1.33) after mRDT initiation. This increase was mainly seen in patients complaining of fever (from 71%
to 91%). In patients without fever, a high proportion was tested aftermRDT implementation (49% before ver-sus 58% after, p = 0.06) despite training instructions to test only patients with fever.
Impact of mRDT implementation on antibiotics prescription The overall prescription of antibiotics increased after
mRDT initiation by 47%, from 49% to 72%, RR 1.47 (95% CI 1.37-1.59). This increase was slightly more important in patients complaining of fever (RR 1.50) than in those not complaining of fever (RR 1.38) and was seen in malaria negative patients but not in positive ones. As a result, the vast majority [78% (95% CI 75-81)] of negative patients were treated with an antibiotic after the introduction ofmRDTs.
Impact of mRDT implementation on laboratory tests other than malaria
mRDT implementation did not dramatically increase the request for alternative laboratory tests by clinicians, which remained generally low.
Convergence of results between the longitudinal and the before-and-after evaluations
Although the variability between HF was high, there was a strong intra-health facility convergence of the main outcome result (reduction of anti-malarial use) between the longitudinal routine data assessment and the repeated cross-sectional before-and-after assessment (Lin concordance-correlation coefficient: rc = 0.91)
0 20000 40000 60000 80000 100000 Ja n Fe b Ma r Ap r Ma y J u n J u l A ug S e p Oc t No v D e c Ja n Fe b Ma r Ap r Ma y J u n J u l A ug S e p Oc t No v D e c Ja n Fe b Ma r Ap r Ma y J u n J u l A ug S e p
New consultations Patients with a diagnosis of malaria Blood slides RDTs Positive tests
m
RDTs
[image:9.595.56.540.90.359.2]2006 2007 2008
(Figure 4). This is a strong confirmation of the robust-ness of the data.
Cross-sectional surveys: cluster randomized controlled analysis
The contemporaneous, post-intervention cluster rando-mized comparison of patient consultations was carried out in six intervention versus three control HF (Table 3). The proportions of children less than five years, children 5 to 15 years and adults were close in the intervention and control groups (39%, 17% and 45% versus 47%, 18% and 35%, p = 0.02), and so was the number of female patients (46% versus 40%, p = 0.1). Outcome results at baseline were similar in intervention and control HF (p > 0.05) (results not shown). The analysis presented below includes mainly data from the post-intervention survey. Impact of mRDT implementation on anti-malarials prescription
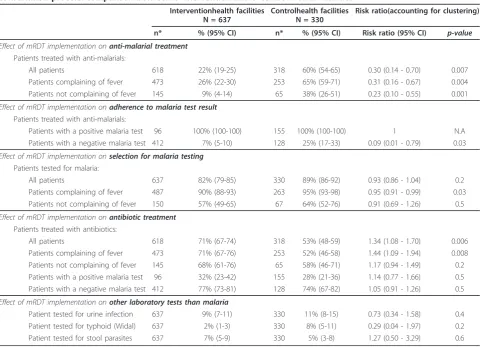
[image:10.595.305.541.539.676.2]There was a considerable difference between the two groups in the proportion of patients that were
Table 2 Before-and-after analysis based on repeated cross-sectional surveys investigating the consultation process: effect ofmRDT implementation on the main outcomes.
BeforemRDT
implementation
Total patients = 937
AftermRDT
implementation
Total patients = 954
Risk ratio(accounting for clustering)
n* % (95% CI) n* % (95% CI) Risk ratio (95% CI) p-value
Effect of mRDT implementation onanti-malarial treatment
Patients treated with anti-malarials
All patients 894 75% (72-78) 912 20% (17-22) 0.23 (0.20 - 0.26) < 0.001 Patients complaining of fever 755 81% (79-84) 682 24% (20-27) 0.25 (0.22 - 0.29) < 0.001 Patients not complaining of fever 139 42% (33-50) 230 7% (4-11) 0.16 (0.10 - 0.27) < 0.001
Effect of mRDT implementation onadherence to malaria test result
Patients treated with anti-malarials
Patients with a positive malaria test 370 99% (99-100) 126 99% (98-100) 1.00 (0.98 - 1.01) 0.8 Patients with a negative malaria test 215 53% (47-60) 628 7% (5-9) 0.09 (0.06 - 0.13) <0.001
Effect of mRDT implementation onselection for malaria testing
Patients tested for malaria
All patients 937 68% (65-71) 954 83% (81-85) 1.26 (1.19 - 1.33) <0.001 Patients complaining of fever 782 71% (68-74) 717 91% (89-93) 1.31 (1.25 - 1.36) <0.001 Patients not complaining of fever 155 49% (41-57) 237 58% (52-65) 1.21 (0.99 - 1.48) 0.06
Effect of mRDT implementation onantibiotic treatment
Patients treated with antibiotics
All patients 894 49% (46-53) 912 72% (69-75) 1.47 (1.37 - 1.59) <0.001 Patients complaining of fever 755 49% (45-52) 682 73% (69-76) 1.50 (1.38 - 1.63) <0.001 Patients not complaining of fever 139 52% (43-60) 230 71% (65-77) 1.38 (1.16 - 1.65) <0.001 Patients with a positive malaria test 370 37% (32-42) 126 35% (26-43) 0.91 (0.68 - 1.21) 0.5 Patients with a negative malaria test 215 54% (47-61) 628 78% (75-81) 1.45 (1.28 - 1.65) <0.001
Effect of mRDT implementation onother laboratory tests than malaria
Patient tested for urine infection 937 7% (6-9) 954 13% (11-15) 1.74 (1.31 - 2.31) <0.001 Patient tested for typhoid (Widal) 937 2% (1-2) 954 1% (1-2) 0.76 (0.36 - 1.63) 0.5 Patient tested for stool parasites 937 6% (5-8) 954 7% (6-9) 1.13 (0.81 - 1.59) 0.5
* numbers differ from total sample size because of the variables applying to different subpopulations of patients (and for drugs because a few patients who did not come back from laboratory to get treatment).
0.00 0.20 0.40 0.60 0.80
1.00
0.00 0.20 0.40 0.60 0.80 1.00
Longitudinal study
Post-intervention doses / pre-intervention doses
(PP)
HC 3 Hosp 3
HC 1
Disp 1
Disp 3 Disp 2
Hosp 1 Hosp 2 HC 2
Concordance correlation coefficient of Lin:
ȡc= 0.91
Before-and-after study
Risk Ratio (RR)
prescribed anti-malarials: 22% in intervention versus 60% in control HF (from a baseline in both of 79%) (RR 0.30, 0.14-0.70) (Table 3). The difference was more pro-nounced in non-febrile than in febrile patients since only 9% of non-febrile patients received an anti-malarial in intervention HF compared to 38% in control HF (RR 0.23, 95% CI 0.10-0.55). The reasons for the low anti-malarial prescription in intervention HF were multiple: better selection of patients for malaria testing, better specificity of mRDT compared to microscopy and better adherence to mRDT result. On the other hand, in con-trol HF the lower anti-malarial prescriptions in the post-versus pre-intervention survey was mainly due to a better trust in malaria test results (negative patients treated with anti-malarials decreased from 43% to 25%), even if it was still based on microscopy.
Differences between intervention and control HF regarding antibiotic prescriptions
The proportion of patients that were prescribed antibio-tics was higher in intervention HF than in controls: 71%
versus 53% respectively (RR = 1.34, 95% CI 1.081.70) -from a baseline of 50 and 51%. There was, however, no significant difference by category of patients (with/with-out fever; with positive/negative result), which con-firmed that the overall difference in antibiotic prescription was almost only due to the higher number of negative patients and not to a behavioural change of clinicians.
Impact of mRDT implementation on laboratory tests other than malaria
The proportions of patients tested for urine, stool or the Widal test did not increase aftermRDT implementation in both the intervention and control HF (p > 0.05).
Discussion
[image:11.595.58.539.107.454.2]The implementation of mRDTs for malaria in nine health facilities in Dar es Salaam in near-programme conditions led to a dramatic reduction in anti-malarials consumption. This was confirmed in all three methods of evaluation with two independent data sets: the Table 3 Cluster randomized controlled analysis based on the post-intervention cross-sectional survey investigating the consultation process: comparison between 6 intervention and 3 control health facilities
Interventionhealth facilities N = 637
Controlhealth facilities N = 330
Risk ratio(accounting for clustering)
n* % (95% CI) n* % (95% CI) Risk ratio (95% CI) p-value
Effect of mRDT implementation onanti-malarial treatment
Patients treated with anti-malarials:
All patients 618 22% (19-25) 318 60% (54-65) 0.30 (0.14 - 0.70) 0.007
Patients complaining of fever 473 26% (22-30) 253 65% (59-71) 0.31 (0.16 - 0.67) 0.004 Patients not complaining of fever 145 9% (4-14) 65 38% (26-51) 0.23 (0.10 - 0.55) 0.001
Effect of mRDT implementation onadherence to malaria test result
Patients treated with anti-malarials:
Patients with a positive malaria test 96 100% (100-100) 155 100% (100-100) 1 N.A Patients with a negative malaria test 412 7% (5-10) 128 25% (17-33) 0.09 (0.01 - 0.79) 0.03
Effect of mRDT implementation onselection for malaria testing
Patients tested for malaria:
All patients 637 82% (79-85) 330 89% (86-92) 0.93 (0.86 - 1.04) 0.2
Patients complaining of fever 487 90% (88-93) 263 95% (93-98) 0.95 (0.91 - 0.99) 0.03 Patients not complaining of fever 150 57% (49-65) 67 64% (52-76) 0.91 (0.69 - 1.26) 0.5
Effect of mRDT implementation onantibiotic treatment
Patients treated with antibiotics:
All patients 618 71% (67-74) 318 53% (48-59) 1.34 (1.08 - 1.70) 0.006
Patients complaining of fever 473 71% (67-76) 253 52% (46-58) 1.44 (1.09 - 1.94) 0.008 Patients not complaining of fever 145 68% (61-76) 65 58% (46-71) 1.17 (0.94 - 1.49) 0.2 Patients with a positive malaria test 96 32% (23-42) 155 28% (21-36) 1.14 (0.77 - 1.66) 0.5 Patients with a negative malaria test 412 77% (73-81) 128 74% (67-82) 1.05 (0.91 - 1.26) 0.5
Effect of mRDT implementation onother laboratory tests than malaria
Patient tested for urine infection 637 9% (7-11) 330 11% (8-15) 0.73 (0.34 - 1.58) 0.4 Patient tested for typhoid (Widal) 637 2% (1-3) 330 8% (5-11) 0.29 (0.04 - 1.97) 0.2 Patient tested for stool parasites 637 7% (5-9) 330 5% (3-8) 1.27 (0.50 - 3.29) 0.6
longitudinal analysis of routine statistics (Post-over Pre-intervention ratio of 0.32 for ALu and 0.37 for injectable quinine), the before-and-after study based on pre- and post-intervention surveys (Risk ratio 0.23 for the first-line treatment and 0.35 for injectable quinine) and the cluster randomized analysis comparing matched inter-vention and control health facilities (Risk ratio 0.26 for the first line treatment and 0.43 for injectable quinine) (see Figure 5).
The high level of convergence of the results confirms the robustness to the findings. The two main reasons for this decrease were illuminated by the observations of patient-provider interactions in the repeated cross sectional surveys. Firstly, the higher accuracy of rou-tine mRDTs compared to routine microscopy led to a dramatic reduction in the number of positive patients. Secondly, as health workers trusted mRDT results, the proportion of test-negative patients treated with anti-malarials dropped from 53% to 7%. The impact was maintained up to the end of the observation period (18 months) and even increased after the initial four months thanks to targeted programmatic actions in poor-performing HF. In the control HF there was a moderate decrease in ALu consumption (PP ratio 0.68), but a corresponding increase in quinine con-sumption and in the number of patients diagnosed with malaria.
The repeated cross sectional surveys showed that 1.49
mRDTs were needed to save one malaria treatment course. This was, however, at the cost of an additional 0.41 antibiotic treatment courses. If clinicians had been fully adherent to both patients selection formRDT test-ing and treatment uponmRDT result, only 1.22mRDTs would have been required. The post-intervention survey took place just after the rainy season, when 18% of patients complaining of fever were positive bymRDT. If the malaria prevalence had been 5% (the lowest monthly rate observed in Dar es Salaam), clinicians would have needed 1.05mRDTs per anti-malarial treatment saved. From the longitudinal study, in which wastage of drugs between the main store and the dispensing window was important, it was found that 2.15 mRDTs were neces-sary to save one ALu blister and half a vial of quinine. These observations show clearly how circumstances shape the effectiveness ofmRDT implementation.
An interesting observation was the“contamination” of the control HF with some of the key messages from the training activities. This was mainly due to health work-ers from intervention HF being transferred to control HF during the study period. The message that the inci-dence of malaria in Dar es Salaam was much lower than commonly thought was clearly passed on to control HF. This helped clinicians to withhold anti-malarials when the result of microscopy was negative and presumably
100%
80% 60% 40% 20% 0
Longitudinal study
(ledger books of health facility main stores)
Before-and-after analysis Cluster randomized
controlled analysis
68%
77%
74%
100%
80% 60% 40% 20% 0
%
of reduction
Cross-sectional surveys
[image:12.595.57.540.427.690.2](observed consultations)
also the microscopists to refrain from giving so many false positive results.
Routine statistics were useful in this case because of the reasonable quality of registers in Dar es Salaam. Besides giving a robust confirmation that clinicians’ behaviour changes took place, this gave for the first time a unique measure of the amount of anti-malarial drug that could be saved following mRDT implementa-tion: 12,727 ALu blisters and 6,061 quinine vials per month in nine HF, including the three district hospitals. The analysis of these routine statistics also identified another important source of drug wastage: the mishand-ling of drug stocks that were either lost, diverted or got expired between the main store and the patients. Initia-tives aimed at reducing drug wastage should thus not only target clinicians’ prescription behaviour but also drug management more generally.
There are currently nine studies that looked at the impact ofmRDT on anti-malarial prescription or clini-cians’ adherence to mRDT result. One Kenyan study was inconclusive because adherence to test result was already very high prior to any intervention [19]; two stu-dies from Tanzania and Burkina Faso showed no effect of mRDT at all [12,13]; three studies from Zanzibar [20], Uganda [21] and Tanzania mainland [22] showed a strong impact (RR 0.42 and 0.29 for anti-malarial pre-scription and RR 0.29 for over-prepre-scription respectively). A Zambian survey, conducted one year after deployment of mRDT at national scale, showed intermediate results (RR 0.62 for negative patients treated with anti-malar-ials), but was underpowered because of an unexpected low number of patients tested for malaria [23]. A study in Ghana found a moderate impact in facilities without microscopy (RR 0.75 for anti-malarial prescription) and no impact at all in facilities using microscopy previously [14]. A recent study from Uganda showed a moderate impact (RR 0.62 for anti-malarial prescription) due to a significant number of patients still treated while negative [24]. All these studies are very heterogeneous in terms of setting, design and type of training and there are probably several reasons for failure or success. These studies were all different from the present one in several ways: they took place in rather controlled conditions (except the Zambian study), used consultation observa-tions only, and were conducted shortly after the start of
mRDT implementation (with or without a baseline sur-vey). In Zambia, the very first experience ofmRDT use in Africa outside South-Africa, the main problem was probably the assumption that clinicians would act upon
mRDT result without problem [23]. By contrast, the successful Ugandan study put a strong emphasis on training and on giving straightforward messages [21]. The successful Zanzibar study used a weekly cross-over design where nurses received a financial incentive to
participate in the study and adhere to specific instruc-tions on mRDT [20]. The Tanzanian mainland study was also successful although no direct incentive was given, but a study staff member was physically on-site during the entire study period and facilities were visited frequently by the supervisory staff [22]. The reasons given by the authors of the Tanzanian study showing no impact was the insufficient training onmRDT given to clinicians [12]. Another possible explanation for the low impact ofmRDT implementation found in this study, as well as in the studies of Burkina Faso [13] and Ghana [14] might be related to the study methodology: they all used the patient as allocation/randomization unit and not the health facility. However, introducing mRDT requires an in-depth change of the provider’s diagnosis and treatment concepts. This can only be achieved with a supporting environment, which constantly and consis-tently re-enforces the new approach. Such a change can-not be expected when the same clinician is asked to apply two different strategies to the patients s/he sees during the same day. The only way to significantly improve the outcome of RDT implementation is when all professionals working in one health facility consis-tently implement one strategy.
Based on the observations made during the study and on the feed-back given by clinicians, it is postulated that the major determinants for the positive results of the present programme were the following: (1) the study was presented to clinicians as the pilot phase of a planned national deployment of mRDT; (2) one of the main investigator of the study was the City Medical Officer of Health, hence health workers did not consider this study as an isolated research project but rather as the new guidelines for malaria management in the city; (3) the training and the evidence it provided was appre-ciated by the target audience of health care profes-sionals. For them, the evidence on the low malaria prevalence in Dar es Salaam, on the bad quality of rou-tine microscopy and on the excellent performance of
mRDT (from meta-analyses and data acquired locally) was new and very relevant. They also had the possibility to link this knowledge to their own reality with cases studies. The health care workers also appreciated the possibility to discuss the mutual mistrust between laboratory staff and clinicians with regard to malaria testing, and that they were presented a tool (the
applicability of these results in other settings, we carried out a similar study in a rural area of Tanzania (Kilo-mbero/Ulanga Districts), although without a control group [26]. The endemicity there was higher than in Dar es Salaam. The impact on the overall consumption of anti-malarials was, therefore, less (a two-fold decrease) due to the much higher proportion of fever cases associated with parasitaemia (39% instead of 8% in Dar es Salaam). Interestingly, the adherence of clinicians to the recommendation of not treating negative patients was even higher in that remote setting (only 1% of nega-tive patients received an anti-malarial drug), similarly to what was observed recently with community health workers usingmRDT in Zambia [27].
Besides saving anti-malarial treatments, one important aspect of RDT implementation is the selection of patients for malaria testing. Patients presenting with a wide range of medical condition were deliberately included to explore clinicians’behavior towards malaria test requests. During the training, the necessity of test-ing only patients complaintest-ing of fever was emphasized. Unfortunately no impact was obtained on this outcome. During the feed-back meeting organized after the end of the study, clinicians stated that the pressure of patients for testing (much more than treating) was high, in parti-cular when coming for a check-up. Moreover, in con-trast to treatment, there is no risk for the patient to be tested.
The large-scale deployment of mRDT is of course going beyond behaviour change alone. There are major health system challenges, starting with the need to con-siderably strengthen the capacity to order/purchase and deliver goods (mRDT and drugs) in areas that have always had poor coverage of health interventions [28]. The respective role of mRDT and/or microscopy needs to be determined in different settings and different clini-cal situations. Also, an effective quality assurance system to supportmRDT introduction needs to be established. Some major improvements have been made to develop a monitoring process to evaluate the performance of dif-ferent brands and batches ofmRDT in recent years [29]. Considerable efforts need still to be invested to ensure appropriate use of mRDT in the field, with a focus on the integrated management of childhood illness in the community and the management of non-malaria fevers. An increased use of broad-spectrum antibiotics in most of mRDT negative cases has indeed been shown in the present study (in the cross-sectional surveys but not in the longitudinal study probably because the effect of RDT diluted itself in the overall very large consumption of antibiotics by HFs for all types of patients) as well as in recent studies in Tanzania and Zanzibar [20,30]. A significant increase in the indiscriminate use of antibio-tics in sub-Saharan Africa is likely to add to the global
problem of antibiotic resistance and should be prevented by all means [31].
Limitations of the study
The main limitation of the cluster randomized control study is the low number of clusters (three). When the study was designed, the priority was deliberately put on the before-and-after component. Indeed, the high het-erogeneity between HF makes them quite difficult to be compared, even after matching on several criteria. Con-tamination between intervention and control HF was also a risk that in fact occurred during this study. Also knowing the potential benefit of RDT, to convince more health facilities to be in the control arm would have been difficult. Knowing that the malaria transmission would not have time to change drastically in a 2 year period, the before-and-after analysis was thus considered to be potentially more robust than the cluster rando-mized control analysis.
Another limitation comes from the longitudinal study in which the impact ofmRDT on anti-malarials con-sumption on the long term might have been underesti-mated. Indeed the ALu decrease was less pronounced in the first 4 months post mRDT initiation than in the fol-lowing months. This was related to problems at the start of the implementation - which could be solved. Also the total number of attendances slightly increased over time, while the data for tests and drugs were not corrected by the total number of patients. The pre-inter-vention period was very short for ALu (3 months), which reduces the strength of the assessment. However, the impact measured on the consumption of quinine vials, which was based on a longer pre-intervention per-iod (15 months), was quite similar to that of ALu.
Conclusions
should therefore move hand in hand with strategies aimed at reducing irrational use of antibiotics at outpati-ent level, for example through updated IMCI decision charts promoted by innovative approaches for teaching and communication.
Conflict of interests
All authors have completed the Unified Competing Interest form at http://www.icmje.org/coi_disclosure.pdf (available on request from the corresponding author) and declare (1) No support received from any company for the submitted work; (2) No financial relationships with commercial entities that might have an interest in the submitted work; (3) No spouses, partners, or chil-dren with relationships with commercial entities that might have an interest in the submitted work; and (4) No non-financial interests that may be relevant to the submitted work.
Acknowledgements
We thank Tom Smith, head of the statistical unit at the Swiss Tropical and Public Health Institute, for his contribution to the statistical analyses. We are grateful to Pascal Mgaya, Edith Mboga, Bernadeta Mosha, Judith Salema, Cyrilo Mapunda, Noan Akyoo, Rehema Rashid, Chacha Mayengo and Adelaider Lazaro for data collection and Gerumana Mpamwa for the data entry. We also thank Thomas Mshana and Jabir Muhsin for performing the quality control ofmRDT. We would also like to thank the Municipal Medical Officer’s of Health for Ilala, Kinondoni and Temeke municipalities in Dar es Salaam, the doctors in charge of the health facilities, the health facility staff and all patients and caretakers who participated in the study.
Funding
All authors have permanent positions at their own institutions. The project, as well as the salary of VDA and JKM, was funded by a grant of the Swiss National Science Foundation (Grant # 3270B0-109696). Most of themRDTs were provided by the United States Agency for International Development (USAID), through the President’s Malaria Initiative. The funders had no role in study design, data collection and analysis, decision to publish, or preparation of the manuscript.
Ethic approval
The protocol and related documents were approved by the Ethikkommission beider Basel (EKBB) in Switzerland and the National Institute for Medical Research Review Board in Tanzania. The procedures followed were in accordance with the ethical standards of the responsible committee on human experimentation and with the Helsinki Declaration.
Data sharing
The database for this trial is available from the authors for research within the limits of the ethical approval for the trial.
Author details
1Swiss Tropical and Public Health Institute, Socinstrasse 57, 4002 Basel,
Switzerland.2University of Basel, Basel, Switzerland.3City Medical Office of Health, Dar es Salaam City Council, United Republic of Tanzania.4Ministry of Health and Social Welfare, United Republic of Tanzania.5Ifakara Health Institute, United Republic of Tanzania.
Authors’contributions
VDA, BG and CL designed the study. VDA and JKM led the project in the field. NS helped with the training and supervision of health workers. DM acted as facilitator to conduct the study in the field. VDA analysed the data and wrote the manuscript. BG, CL and JKM contributed to the manuscript. All authors commented on the paper and agreed on the content.
Received: 25 February 2011 Accepted: 29 April 2011 Published: 29 April 2011
References
1. World Health Organization:Guidelines for the Treatment of Malaria.
Geneva, Switzerland2006.
2. Zurovac D, Midia B, Ochola SA, English M, Snow RW:Microscopy and outpatient malaria case management among older children and adults in Kenya.Trop Med Int Health2006,11:432-440.
3. Masika PM, Semarundu WJ, Urassa R, Mosha J, Chandramohan D, Gosling RD:Over-diagnosis of malaria is not a lost cause.Malar J2006, 5:120.
4. D’Acremont V, Lengeler C, Genton B:Massive over-diagnosis of malaria in Sub-Saharan Africa: time to review blanket treatment of underfives.
Abstract book of the 56th Annual Meeting of the American Society of Tropical Medicine and Hygiene, Philadelphia, USA2007, 4-8.
5. Makani J, Matuja W, Liyombo E, Snow RW, Marsh K, Warrell DA:Admission diagnosis of cerebral malaria in adults in an endemic area of Tanzania: implications and clinical description.QJM2003,96:355-362.
6. Reyburn H, Mbatia R, Drakeley C, Carneiro I, Mwakasungula E, Mwerinde O, Saganda K, Shao J, Kitua A, Olomi R, Greenwood BM, Whitty CJ: Overdiagnosis of malaria in patients with severe febrile illness in Tanzania: a prospective study.BMJ2004,329:1212.
7. D’Acremont V, Lengeler C, Mshinda H, Mtasiwa D, Tanner M, Genton B: Time to move from presumptive malaria treatment to laboratory-confirmed diagnosis and treatment in African children with fever.PLoS Med2009,6:e252.
8. D’Acremont V, Lengeler C, Genton B:Reduction of the proportion of fevers associated withPlasmodium falciparumparasitemia in Africa: a systematic review.Malar J2010,9:240.
9. World Health Organization:Guidelines for the treatment of malaria, second edition.Geneva, Switzerland2010.
10. English M, Reyburn H, Goodman C, Snow RW:Abandoning presumptive antimalarial treatment for febrile children aged less than five years–a case of running before we can walk?PLoS Med2009,6:e1000015. 11. D’Acremont V, Aggrey M, Swai N, Tyllia R, Kahama-Maro J, Lengeler C,
Genton B:Withholding antimalarials in febrile children with a negative Rapid Diagnostic Test is safe in moderately and highly endemic areas of Tanzania: a prospective longitudinal study.Clin Infect Dis2010, 51:506-511.
12. Reyburn H, Mbakilwa H, Mwangi R, Mwerinde O, Olomi R, Drakeley C, Whitty CJ:Rapid diagnostic tests compared with malaria microscopy for guiding outpatient treatment of febrile illness in Tanzania: randomised trial.BMJ2007,334:403.
13. Bisoffi Z, Sirima BS, Angheben A, Lodesani C, Gobbi F, Tinto H, Van den Ende J:Rapid malaria diagnostic tests vs. clinical management of malaria in rural Burkina Faso: safety and effect on clinical decisions. A randomized trial.Trop Med Int Health2009,14:491-498.
14. Ansah EK, Narh-Bana S, Epokor M, Akanpigbiam S, Quartey AA, Gyapong J, Whitty CJ:Rapid testing for malaria in settings where microscopy is available and peripheral clinics where only presumptive treatment is available: a randomised controlled trial in Ghana.BMJ2010,340:c930. 15. Wang S, Lengeler C, Mtasiwa D, Mshana T, Manane L, Maro G, Tanner M:
Rapid Urban Malaria Appraisal (RUMA) II: epidemiology of urban malaria in Dar es Salaam (Tanzania).Malar J2006,5:28.
16. Geissbühler Y, Kannady K, Chaki PP, Emidi B, Govella NJ, Mayagaya V, Kiama M, Mtasiwa D, Mshinda H, Lindsay SW, Tanner M, Fillinger U, de Castro MC, Killeen GF:Microbial larvicide application by a large-scale, community-based program reduces malaria infection prevalence in urban Dar es Salaam, Tanzania.PLoS ONE2009,4:e5107.
17. Lin LI:A concordance correlation coefficient to evaluate reproducibility.
Biometrics1989,45:255-268.
18. Kahama-Maro J, D’Acremont V, Mtasiwa D, Genton B, Lengeler C:Low quality of routine microscopy for malaria at different health system levels in Dar es Salaam: Rapid Diagnostic Tests should also be implemented in hospitals and urban settings.Abstract book of the 57th Annual Meeting of the American Society of Tropical Medicine and Hygiene, New Orleans, USA2008, 7-11.
19. Skarbinski J, Ouma PO, Causer LM, Kariuki SK, Barnwell JW, Alaii JA, de Oliveira AM, Zurovac D, Larson BA, Snow RW, Rowe AK, Laserson KF, Akhwale WS, Slutsker L, Hamel MJ:Effect of malaria rapid diagnostic tests on the management of uncomplicated malaria with artemether-lumefantrine in Kenya: a cluster randomized trial.Am J Trop Med Hyg
20. Msellem MI, Mårtensson A, Rotllant G, Bhattarai A, Strömberg J, Kahigwa E, Garcia M, Petzold M, Olumese P, Ali A, Björkman A:Influence of rapid malaria diagnostic tests on treatment and health outcome in fever patients, Zanzibar: a crossover validation study.PLoS Med2009,6: e1000070.
21. Hopkins H, Ojaku A, Yeka A, Angutoko P, Ategeka J, Dorsey G:Effectiveness and safety of training in fever case management and RDT use at health centers in Uganda.Abstract book of the 57th Annual Meeting of the American Society of Tropical Medicine and Hygiene, New Orleans, USA2008, 7-11.
22. Williams HA, Causer L, Metta E, Malila A, O’Reilly T, Abdulla S, Kachur SP, Bloland PB:Dispensary level pilot implementation of rapid diagnostic tests: an evaluation of RDT acceptance and usage by providers and patients–Tanzania, 2005.Malar J2008,7:239.
23. Hamer DH, Ndhlovu M, Zurovac D, Fox M, Yeboah-Antwi K, Chanda P, Sipilinyambe N, Simon JL, Snow RW:Improved diagnostic testing and malaria treatment practices in Zambia.JAMA2007,297:2227-2231. 24. Kyabayinze DJ, Asiimwe C, Nakanjako D, Nabakooza J, Counihan H,
Tibenderana JK:Use of RDTs to improve malaria diagnosis and fever case management at primary health care facilities in Uganda.Malar J2010, 9:200.
25. D’Acremont V, Lengeler C, Genton B:Stop ambiguous messages on malaria diagnosis.BMJ2007,334:489.
26. Tyllia R, D’Acremont V, Swai N, Genton B, Lengeler CL:The management of febrile patients drastically improved after introduction of Rapid Diagnostic Tests for malaria in health facilities of rural Tanzania.Abstract in the abstract book of to the 5th MIM Pan-African Malaria Conference, Nairobi, Kenya2009, 2-6.
27. Yeboah-Antwi K, Pilingana P, Macleod WB, Semrau K, Siazeele K, Kalesha P, Hamainza B, Seidenberg P, Mazimba A, Sabin L, Kamholz K, Thea DM, Hamer DH:Community case management of fever due to malaria and pneumonia in children under five in Zambia: a cluster randomized controlled trial.PLoS Med2010,7:e1000340.
28. UNICEF and Roll Back Malaria:Malaria in children - Progress in intervention coverage.New York City, USA2007 [http://www.unicef.org/ health/files/Malaria_Oct6_for_web%281%29.pdf], (last accessed 04.02.2011). 29. WHO/FIND/CDC/TDR:Malaria Rapid Diagnostic Tests performance. Results of
WHO product testing of malaria RDTs: Rounds 1 and 2Geneva, Switzerland;
2008.
30. Mosha JF, Conteh L, Tediosi F, Gesase S, Bruce J, Chandramohan D, Gosling R:Cost implications of improving malaria diagnosis: findings from north-eastern Tanzania.PLoS ONE2010,5:e8707.
31. Baiden F, Webster J, Owusu-Agyei S, Chandramohan D:Would rational use of antibiotics be compromised in the era of test-based management of malaria?Trop Med Int Health2010.
32. ACTwatch:Evidence for malaria medicines policy.[http://www.actwatch. info], (last accessed 04.02.2011).
doi:10.1186/1475-2875-10-107
Cite this article as:D’Acremontet al.:Reduction of anti-malarial consumption after rapid diagnostic tests implementation in Dar es
Salaam: a before-after and cluster randomized controlled study.Malaria
Journal201110:107.
Submit your next manuscript to BioMed Central and take full advantage of:
• Convenient online submission
• Thorough peer review
• No space constraints or color figure charges
• Immediate publication on acceptance
• Inclusion in PubMed, CAS, Scopus and Google Scholar
• Research which is freely available for redistribution