Open Access
Research
Inter-rater reliability of malaria parasite counts and comparison of
methods
Katherine M Bowers*
1, David Bell
2, Peter L Chiodini
1,3, John Barnwell
4,
Sandra Incardona
5, Seiha Yen
5, Jennifer Luchavez
6and Hilary Watt
3Address: 1Hospital for Tropical Diseases, WC1E 6JB, UK, 2Foundation for Innovative Diagnostics (FIND), Geneva, Switzerland (formerly
WHO-Regional Office for the Western Pacific, Manila, Philippines), 3London School of Hygiene and Tropical Medicine, WC1E 7HT, UK, 4CDC, Buford
Highway, Atlanta, Georgia, USA, 5Laboratory of Molecular Epidemiology, Institut Pasteur of Cambodia, BP 983 Phnom Penh, Cambodia and
6Research Institute for Tropical Medicine, Department of Health Compound, FILINVEST Corporate City, Alabang, Muntinlupa City, 1781,
Philippines
Email: Katherine M Bowers* - [email protected]; David Bell - [email protected];
Peter L Chiodini - [email protected]; John Barnwell - [email protected]; Sandra Incardona - [email protected]; Seiha Yen - [email protected]; Jennifer Luchavez - [email protected]; Hilary Watt - [email protected]
* Corresponding author
Abstract
Background: The introduction of artemesinin-based treatment for falciparum malaria has led to a shift away from
symptom-based diagnosis. Diagnosis may be achieved by using rapid non-microscopic diagnostic tests (RDTs), of which there are many available. Light microscopy, however, has a central role in parasite identification and quantification and remains the main method of parasite-based diagnosis in clinic and hospital settings and is necessary for monitoring the accuracy of RDTs. The World Health Organization has prepared a proficiency testing panel containing a range of malaria-positive blood samples of known parasitaemia, to be used for the assessment of commercially available malaria RDTs. Different blood film and counting methods may be used for this purpose, which raises questions regarding accuracy and reproducibility. A comparison was made of the established methods for parasitaemia estimation to determine which would give the least inter-rater and inter-method variation
Methods: Experienced malaria microscopists counted asexual parasitaemia on different slides using three methods; the thin film method using the total erythrocyte count, the thick film method using the total white cell count and the Earle and Perez method. All the slides were stained using Giemsa pH 7.2. Analysis of variance (ANOVA) models were used to find the inter-rater reliability for the different methods. The paired t-test was used to assess any systematic bias between the two methods, and a regression analysis was used to see if there was a changing bias with parasite count level.
Results: The thin blood film gave parasite counts around 30% higher than those obtained by the thick film and Earle and Perez methods, but exhibited a loss of sensitivity with low parasitaemia. The thick film and Earle and Perez methods showed little or no bias in counts between the two methods, however, estimated inter-rater reliability was slightly better for the thick film method.
Conclusion: The thin film method gave results closer to the true parasite count but is not feasible at a parasitaemia below 500 parasites per microlitre. The thick film method was both reproducible and practical for this project. The determination of malarial parasitaemia must be applied by skilled operators using standardized techniques.
Published: 25 November 2009
Malaria Journal 2009, 8:267 doi:10.1186/1475-2875-8-267
Received: 2 June 2009 Accepted: 25 November 2009
This article is available from: http://www.malariajournal.com/content/8/1/267
© 2009 Bowers et al; licensee BioMed Central Ltd.
Background
With the introduction of artemisinin-based treatment for falciparum malaria there has been a shift away from symptom-based diagnosis to diagnosis based upon the detection of malaria parasites. Rapid non-microscopic diagnostic tests (RDTs) are one way in which this may be achieved, but light microscopy has a central role in para-site identification and quantitation, is necessary for mon-itoring the accuracy of RDTs, and remains the main method of parasite-based diagnosis in large clinic and hospital settings.
Although molecular diagnostic methods have made sub-stantial progress and are undoubtedly the most sensitive techniques for the diagnosis of malaria, for most clinical laboratories, blood film examination remains the final arbiter and allows determination of the parasite densities. There are however, both different blood film and different counting methods used for this purpose which raises questions regarding which gives the most accurate figure and which is the most reproducible.
The World Health Organization has prepared a profi-ciency testing panel containing a range of malaria-positive blood samples of known parasitaemia, to be used for the assessment of commercially available malaria RDTs. Before doing so, a comparison was made of the estab-lished methods for parasitaemia estimation to determine which would give the least inter-rater and inter-method variation.
Aims
To compare different methods of counting malaria para-sites, both in terms of inter-rater reliability of the different methods, and also to assess any relative bias between the methods.
Methods
The blood films were collected and prepared with the approval of the Research Ethics Committees of The Minis-try of Health, Cambodia, as part of the collection of sam-ples and development of methods for monitoring malaria rapid diagnostic test quality in a joint project with the World Health Organization.
The study sites were the Research Institute for Tropical Medicine, Alabang, the Philippines (RITM); Institut Pas-teur, Phnom Penh, Cambodia (IP); the Centers for Dis-ease Control and Prevention, Atlanta, Georgia, United States (CDC); and the Hospital for Tropical Diseases, Lon-don, UK (HTD).
Thirty-one blood samples containing Plasmodium
falci-parum were collected on a field trip to Cambodia in Sep-tember 2004.
Study participants were enrolled during a high transmis-sion season in two regions (Kampot and Pailin). The pur-pose and methods of the study were explained in the regional dialect orally and in written form. Informed con-sent was obtained from the study participant or the legal guardian. An independent witness also signed each con-sent form. Patients with a history of fever had a malaria RDT performed. Any patient, over the age of seven with a positive RDT, without serious malaria symptoms and without treatment with anti-malarial drugs within the past three weeks was interviewed and enrolled. Thick and thin smears [1] were made from fingerpick samples for analysis at Institut Pasteur of Cambodia (IP). Ten to fif-teen ml of blood was collected in EDTA tubes. The blood was kept on ice and transported to the laboratory at the end of the day in an air-conditioned vehicle. Earle and Perez [2] and thin blood films were made at IP from an EDTA tube on receipt of the samples and a total white cell count and red cell count was performed the next day using a Cell Counter (Cell-Dyn 3200 ABBOTT) on one of the refrigerated EDTA tubes. DNA was extracted from 0,2 ml EDTA blood, using the QIAamp DNA blood kit (QIA-GEN, Germany). A species-specific nested PCR method, based on 18S rRNA gene amplification, was used to deter-mine the infecting species, as previously described [3].
The Cambodian microscopists were prequalified by the WHO malaria accreditation course[4]. A microscopist from the Cambodia National Malaria Control Centre pre-pared the slides in collaboration with a reference micro-scopist from HTD; the latter also monitored the counting of parasites in the field laboratory and later repeated the parasite counts at HTD on a separate stained slide. Repeat counts were only performed if the results showed a >20% discrepancy between methods or readers. Extra slides were made and stained from the EDTA sample collected in the field. The extra slide sets were sent to CDC, HTD and RITM for separate evaluation. The slides were mounted in DPX and a coverslip was applied before the slides were sent to the different laboratories. Only the reference reader had access to all the counts for analysis of the results at the end of the study, and microscopists were oth-erwise blinded to each other's results.
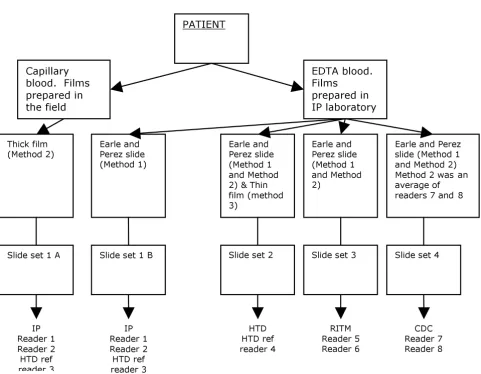
Counts were performed on Earle and Perez slides using the method described by Earle and Perez [2] and were analysed as Method 1. The number of parasites found in fields containing 500 white blood cells was performed on Earle and Perez slides or the thick film (see Figure 1). The total number of parasites per 500 white cells was adjusted for the true white cell count and was designated Method 2
Method 3 was performed on the thin film and the number of parasites per 5000 erythrocytes was adjusted for the
into 10 by 10 squares was used to perform the counts in Method 3.
[image:3.612.64.545.81.454.2]Seven raters at four different sites counted the parasites (Figure 1). Each rater counted separately each sample using two different methods, the Earle and Perez and the thick film count. Since one of the seven raters counted the parasites twice on each sample (once at each of IP and HTD, there were eight counts in total of the parasites, on each sample, for the Earle and Perez method. However, for the thick film count method, at CDC, the individual counts for the two raters were averaged and only this mean value was available for analysis, therefore only seven counts were available per sample (including two from the same rater at different sites, and another repre-senting an average of two raters). There was a slight varia-tion between sites in how the thick film count was undertaken - capillary blood was used in Cambodia, and
EDTA blood was used for the other sites. For a third method, the thin cell count method, a single rater counted the parasites once only, from separate slide preparations of the same blood samples.
Method 1 was that of Earle and Perez; method 2 counted parasites against the known white cell count on a thick blood film; and method 3 counted parasites against the known red blood cell count on a thin blood film.
Any samples found to contain more than one species of malaria parasite (ie mixed) by microscopy at any of the sites were removed from the analysis of the data. Samples that were found to be mixed infections by PCR but not by microscopy were still included in this study [3]. The para-site counts were analysed at The London School of Hygiene and Tropical Medicine Statistics Department for variation between readers and between methods at the
Diagram of slide sets and readers
Figure 1
Diagram of slide sets and readers.
EDTA blood. Films
prepared in IP laboratory
Thick film (Method 2)
Earle and Perez slide (Method 1)
Slide set 1 A
Earle and Perez slide (Method 1 and Method 2) & Thin film (method 3)
Earle and Perez slide (Method 1 and Method 2)
Earle and Perez slide (Method 1 and Method 2) Method 2 was an average of readers 7 and 8
Slide set 1 B Slide set 2 Slide set 3 Slide set 4
IP Reader 1 Reader 2 HTD ref reader 3
IP Reader 1 Reader 2 HTD ref reader 3
HTD HTD ref reader 4
RITM Reader 5 Reader 6
CDC Reader 7 Reader 8
PATIENT
different sites. IP, RITM and HTDL counted sexual stage parasites (gametocytes) as well as asexual stage parasites, whilst CDC counted only asexual stages. Sexual stages were found in only 16 samples and were present in low numbers, so statistical data was performed only on asex-ual stages.
Statistical analysis
Firstly, counts were plotted to assess their distribution and scatter, and to assess the necessity of the log transforma-tion. The log scale is used to analyse these counts, so that proportional differences, and not absolute differences, are assessed. Therefore, a halving represents the same size of difference as a doubling, but in the opposite direction. It also means that an increase from 500 to 1,500 in the par-asite count is treated as a tripling, in comparison to a base of 500, whereas it is treated as a 1% increase, in compari-son to a base of 100,000. The average reported is the geo-metric mean, which is calculated as exponential of the mean of the log counts. The geometric mean can also be
calculated as the nth root of the product of all the
observa-tions, where n is the sample size. Geometric standard
deviations are quoted, which can be calculated as the exponential of the standard deviation of the logs. These geometric standard deviations are multiplicative standard deviations, e.g. one standard deviation above the average = (geometric mean) × (geometric standard deviation), and two standard deviations below the average =
(geomet-ric mean) ÷ (geomet(geomet-ric standard deviation)2 [5].
For Earle and Perez, and the thick film methods, inter-rater reliability was assessed. Firstly, Bland and Altman plots were drawn [6]. Each individual value was expressed relative to the geometric mean of the counts for that sam-ple (the two separate counts that the one rater made were counted as separate counts at this stage). For the thick film count method, corresponding plots were also drawn, restricted to those sites where EDTA blood was used (5 raters at UK, Philippines and USA).
Analysis of variance (ANOVA) models, including each sample identifier as a fixed effect, were used to find the inter-rater reliability for the different methods. For each method of measurement, this was done in two stages. Firstly the within rater variance (W) was estimated from a model for the repeated counts from the one rater who esti-mated parasite counts twice on each sample. Secondly the between rater variance (B) was estimated via a model for the counts from different raters (using the average of the two counts for the one rater with two available, and using averages across raters where only these were available.).
For each method of measurement, the residual variance from the first model is an estimate of W. The residual var-iance from the second model is an estimate of a linear combination of B and W, with the linear combination
dif-fering between measures because different measures are aggregated in different ways. For Earle and Perez, the residual variance from this model is an estimate of (6.5 × W + 7 × B)/7 (because the mean of two measures is used for one of the seven raters). For the thick film method the analogous expression is (5 × W + 5.5 × B)/6 (because the mean of two measures is used for one of the raters and results from two more are averaged). For the thick film method, restricted to EDTA blood, the analogous expres-sion is (3.5/4) × (W+B). By substituting for W from the first model, B was estimated for each measure. The quoted results are based on both within and between rater vari-ance, (i.e. based on B+W), in order to reflect the reliability, when different raters count each sample only once. 95% reference ranges were found, relative to the geometric mean count for the specified sample, across all raters. 95% of counts are expected to lie within these reference ranges. The calculations are based on assuming a normal distribu-tion for differences between each raters' log counts and the mean log count [calculated by exp(+/-1.96 × v(B+W))]. These assumptions of normality were broadly satisfied.
After assessment of inter-rater reliability, average counts were compared between methods of measurement, to see if there were any biases in average parasite counts from one method relative to another method. Again, Bland and Altman plots were used. Firstly, the geometric mean across all raters was taken for Earle and Perez and the thick film method. The relative difference between these averages (across raters) was plotted against the geometric means (over both methods) of these averages. The paired t-test was used to assess any systematic bias between the two methods, and a regression analysis was used to see if there was a changing bias with parasite count level. Corre-sponding analyses were used, to compare Earle and Perez with the thin film method, and then to compare the thick with the thin film methods. Note that for the thin film method, only a single count by one rater was available for each sample, so this was used in place of the geometric mean across raters.
Results
these data. The corresponding geometric means and geo-metric standard deviations (which represent the transfor-mation of the results on log counts back onto the original scale) were, therefore, quoted.
Repeatability of Earle and Perez method
The estimated between rater geometric SD (i.e. multiplica-tive SD) of the counts, based on one count per rater, is
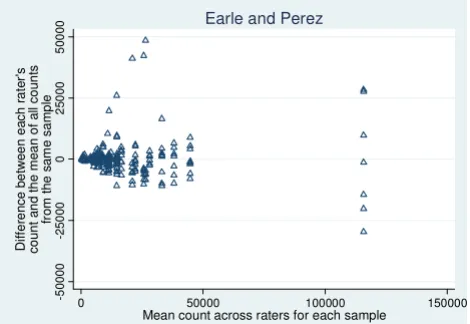
Inter-rater reliability for each method, on original (notlog) count scale
Figure 2
Inter-rater reliability for each method, on original (notlog) count scale. (a) Earle and Perez method. x axis: Mean count across raters for each sample. y axis: Difference between each raters count and the mean of all counts from the same sample. (b) Thick film method. X axis: Mean count across raters for each sample. Y axis: Difference between each raters count and the mean of all counts from the same sample. -5 0000 -250 00 0 25 00 0 50 00 0 D if fer en c e b e tw e e n e a c h rate r' s c o un t a n d th e m ea n o f a ll c o un ts fr om the s am e s a m p le
0 50000 100000 150000
Mean count across raters for each sample Earle and Perez
-7 50 00 -5 00 00 -2 50 00 0 25 00 0 50 0 0 0 75 00 0 Di ff e re nc e be twee n e ac h ra ter 's c o un t a n d th e m ea n o f al l c o un ts fr o m th e s a m e s a m p le
0 50000 100000 150000
Mean count across raters for each sample Thick Film Method
[image:5.612.57.292.89.251.2]Inter-rater reliability for each method, on log count scale, and therefore showing relative differences
Figure 3
Inter-rater reliability for each method, on log count
scale, and therefore showing relative differences. (a)
Earle and Perez graph. X axis: Mean (geometric) count across raters for each sample. Y axis: Relative difference between each raters count and the geometric mean of all counts from the same sample. (b) Thick film method. X axis: Mean (geometric) count across raters for each sample. Y axis: Relative difference between each raters count and the geometric mean of all counts from the same sample. (c) Thick film method restricted to EDTA Blood. X axis: Mean (geometric) count across raters for each sample. Y axis: Rel-ative difference between each raters count and the geomet-ric mean of all counts from the same sample.
third half equa l twic e tripl e quad rupl e Re lat iv e di ff e re n c e be tw ee n e ac h ra ter 's c o u n t a nd th e g e o m e tr ic m ean o f a ll c ou nt s fr o m the s a m e s a m p le
300 500 1000 2000 5000 1000 0 2000 0 5000 0 1000 00 2000 00
Mean (geometric) count across raters for each sample Earle and Perez
half equa l twic e tripl e Re lat iv e di ff er e n c e be tw ee n e ac h ra ter 's c o u n t a nd th e g e o m e tr ic me an of a ll c ou nt s fr o m the s a m e s a m p le
300 500 1000 2000 5000 1000
0
20000 5000 0
1000002000 00
Mean (geometric) count across raters for each sample Thick Film Method
half equa l twic e tripl e Re lat iv e di ff er e nc e be tw ee n eac h ra ter 's c o u n t a nd th e g e o m e tr ic me an of a ll c ou nt s fr o m the s a m e s a m p le
300 500 1000 2000 5000 1000
0
20000 5000 0
1000002000 00
1.46. This implies that 95% of raters will give individual
counts between 48% (= 100% × 1.46-1.96) of the geometric
mean count across all raters, for the specified sample, and
2.10 (= 100% × 1.461.96) times this count.
Repeatability of the thick film method
The estimated between rater geometric SD of the counts, based on one count per rater, is 1.36. This implies that 95% of raters will give individual counts between 54% of the geometric mean count across all raters, for the speci-fied sample, and 1.84 times this count. Restricting our analyses to sites 2 to 4 only (i.e. where EDTA bloods were used), makes little difference to our results. Then, the esti-mated between rater geometric SD of the counts is 1.39, which implies that 95% of raters will give individual counts between 53% of the geometric mean across all raters, and 1.90 times the geometric mean.
Intra-rater repeatability
The single rater, who counted all samples twice, gave very consistent counts for Earle and Perez (i.e. she agreed with herself very closely, far better, in general, than her agree-ment with the other raters, and their agreeagree-ment with each other). However, this rater did not give consistent results for the thick film method; her repeated counts were about as similar to her initial counts as they were to other raters' counts. Hence, this implies that Earle and Perez has much better intra-rater reliability than the thick film method. However, it is impossible to know whether other raters would give similarly consistent results for Earle and Perez, but not for the thick film method, had they rated the sam-ples twice. This difference may also be due to the fact that the exact same method was used twice by this rater, for Earle and Perez, whereas for the thick film method, she used capillary blood in Cambodia, and EDTA blood in the UK.
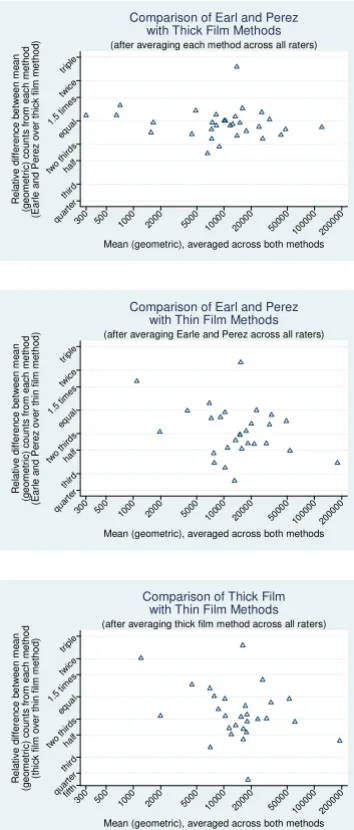
Agreement between counts from Earle and Perez and the thick film method (Figure 4a)
Most relative differences are between a 50% increase in counts and a one third reduction (which is a difference of the same size but in the opposite direction on a multipli-cative scale). Points appear to be scattered relatively evenly above and below the line of no relative difference. Earle and Perez gave counts an average of 4.7% lower than the thick film method, 95%CI 13.4% lower to 4.9% higher. Since the 95%CI includes both higher and lower values, we do not have any evidence that any such bias exists (p = 0.32). Nor is there any evidence of changing level of bias with parasite count (p = 0.45 from regression on count).
Agreement between counts from Earle and Perez and the thin film method (Figure 4b)
Here there is evidence of bias (p = 0.0002), as demon-strated by the fact that most points lie below the equal
line, and therefore demonstrate that Earle and Perez tends to give lower counts than the thin film method. On aver-age, Earle and Perez gives counts that are 31% lower than the thin film method (95%CI 18% to 42% lower). There is no evidence that the extent of this bias changes with par-asite count (p = 0.10).
Agreement between counts from the thick film and the thin film method (Figure 4c)
A similar result is found when the thick and the thin film methods are compared (Figure 4c). Again, there is evi-dence of a systematic bias (p = 0.003). The thick film method gives counts an average of 26% lower than the thin film method (95%CI 10% to 39%, p = 0.003). There is no evidence that the extent of this bias changes with par-asite count (p = 0.10).
Discussion
Comparison of methods
There is little or no bias in counts between Earle and Perez and the thick film method (p = 0.32). However, both these methods give counts that are around 30% lower on average than those obtained from the thin film method. Earle and Perez gives counts an average 31% lower than the thin film method (95%CI 18% to 42% lower, p = 0.0002), while the thick film method (based on white cell count) gives counts an average of 26% lower (95%CI 10% to 39%, p = 0.003). This was as expected from previous work on estimation of malarial parasitaemia. For exam-ple, Dowling and Shute [7] compared parasite counts obtained by examination of thin and thick blood films and concluded that parasite losses of 60 to 90% occurred with thick films, whereas since thin films are fixed after drying and before staining, they assumed no significant
loss of parasites during staining. Bejon et al [8] confirmed
detachment or lysis of parasites from thick films during
staining by detecting Plasmodium falciparum DNA in the
reagents used to stain the films. Using a series of parasite dilutions, they found that thick films tended to measure parasite densities around one log lower than the number calculated to be in the dilution and this did not vary by microscopist. Thus, although thick films are more sensi-tive for parasite detection than thin films (due to the fact that they examine a larger volume of blood) they consist-ently underestimate the level of parasitaemia. Compari-son of the thick film (wbc) method and the thin film (rbc)
method by O'Meara et al [9] showed that measurements
from the thin film averaged approximately 30% higher than the total mean, and parasitaemia from the thick film averaged 10% lower than the total mean (p = 0.0011). One defect in the wbc method is that it assumes that wbcs
are evenly distributed in the film, but O'Meara et al
staining. In this study, zero to 65% fewer parasites were counted in the thick compared to the thin film.
Interestingly, loss of white cells from thick films appears to be much lower than loss of parasites. Dowling and Shute [7]reported an average loss in routine staining of only 8%, whilst Earle and Perez [2]measured white cell counts by haemocytometer and by direct counting of cells in a given volume of blood on a thick film and found haemocytometer counts to be only 2.3% higher than the thick film counts.
The total white blood cell count for the samples examined in our study ranged from 2470 to 14,200 with a mean of
6,359/μL. If parasitaemia had been calculated with
refer-ence to a standard figure of 8,000/μL, significant
under-and overestimates of parasitaemia would have been made using method 2. Greenwood and Armstrong [10] found this to be a disadvantage when comparing diagnosis by thick versus thin films. They compared parasitaemia obtained from a knowledge of the red cell count and the level of infection in red blood cells in a thin blood film with two techniques based on thick films. In the first, par-asitaemia was calculated by counting the number of para-sites present per white cell in a thick film and multiplying it by 8,000, regarded as an average white blood cell count per microlitre. In the second, the number of parasites per high power microscope field was counted and the parasi-taemia calculated using this figure and the volume of blood assumed to be present in a high power field. They found the second method to be more accurate (compared to thin film examination) and felt that it was due to vari-ability in the volume of blood used to prepare thick films being less than the variability in white blood cell count in the population they studied. Once the lack of an accurate white blood cell count is overcome, as in our study, the reliability of the thick blood film method improves.
Comparison of raters
This study has shown differences between methods using the same microscopy staff, but reader technique itself clearly contributes to the accuracy of parasitaemia esti-mates.
The inter-rater reliability appears to be fairly similar for Earle and Perez and the thick film method, although the estimated reliability is slightly better for the thick film method. For Earle and Perez, 95% of counts from differ-ent raters will lie between 48% of the geometric mean count across all raters, for the specified sample, and 2.10 times this count. For the thick film method, 95% of counts from different raters will lie between 54% of the geometric mean count across all raters, for the specified sample, and 1.84 times this count. The intra-rater reliabil-ity appears to be much better using Earle and Perez, than
[image:7.612.86.263.89.504.2]Bland and Altman plots to demonstrate the presence of any bias between different methods of counting the parasite loads, on a log scale, to show relative differences
Figure 4
Bland and Altman plots to demonstrate the presence of any bias between different methods of counting the parasite loads, on a log scale, to show relative dif-ferences. (a) Comparison of Earle and Perez with thick film methods (after averaging each method across all raters). X axis: Mean (geometric) averaged across both methods. Y axis: Relative difference between mean (geometric) counts from each method (Earle and Perez over Thick film method). (b Comparison of Earle and Perez with Thick Film methods (after averaging Earle and Perez across all raters). X axis: Mean (geometric) averaged across both methods. Y axis: Rel-ative difference between mean (geometric) counts from each method (Earle and Perez over Thick film method). (c) Com-parison of Thick Film with Thin Film methods (after averaging thick Film method across all raters). X axis: Mean (geomet-ric) averaged across both methods. Y axis: Relative difference between mean (geometric) counts from each method (Thick film over thin film method).
quar ter third half two third s equ al 1.5 time s twic e tripl e R e la ti v e d if fer en c e b et w e en m e a n (g eo me tr ic ) c ou nt s fr o m e a c h m et h o d (E ar le an d P er ez ov er th ic k fi lm m e tho d )
300 500 1000 2000 5000 1000
0
20000 500001000002000 00
Mean (geometric), averaged across both methods (after averaging each method across all raters)
Comparison of Earl and Perez with Thick Film Methods
quar ter third half two third s equ al 1.5 time s twic e tripl e R e la ti ve d if fe re n ce b e tw e e n m e a n (g eo me tr ic ) c ou nt s fr o m e a c h m et h o d (E a rle a n d P er ez o v er th in film m e th od )
300 500 1000 2000 5000 1000
0
20000 500001000002000 00
Mean (geometric), averaged across both methods (after averaging Earle and Perez across all raters)
Comparison of Earl and Perez with Thin Film Methods
fifth quart er third half two third s equa l 1.5 times twic e tripl e R el a ti v e d if fer en c e b et w e en m e an (g eo me tr ic ) c ou nt s fr o m e a c h m et h o d (t hi c k fi lm ov e r th in fi lm m e th o d )
300 500 1000 2000 5000 10000
20000 500001000002000 00
Mean (geometric), averaged across both methods (after averaging thick film method across all raters)
using the thick film method. However, this is based on assessment of one rater alone, and may be because she used two different techniques to perform the thick film method. Another possible explanation is that the distribu-tion of white blood cells is much less uniform than that of the parasites [9], which would affect the white cell method but not the Earle and Perez method.
Killian et al [11] examined inter rater variability in the
results of malaria microscopy in epidemiological studies using 711 thick blood films re-read by four experienced microscopists. Parasite density was calculated by counting the number of trophozoites in 100 oil immersion fields and multiplying by 4 to give parasites per microlitre,
assuming a blood volume of approximately 0.25 μL per
100 microscope fields (as previously used by Dowling and Shute [7] and by Greenwood and Armstrong [10]). Varia-bility around the mean difference continuously decreased with increasing parasite density. When two parasite counts for the same slide were compared they found con-siderable variability, with one reading being 0.12 to 10 times the other. There was significantly less variability at
parasite densities above 5000/μL (0.2 to 3.6 times) but it
was still substantial.
O'Meara et al [12] examined sources of variation in
para-site density measurements using the same technique as our method two. Overall, for variation between readers, they stated that discrepancies in parasite densities reported by experienced clinic microscopists decreased with increasing mean density and trends were similar for
P. falciparum and for Plasmodium vivax when they were considered separately. They also commented that if each count had been multiplied by a uniform approximation of the white cell count instead of the actual figure, this relationship between density and discrepancy would have been obscured. These authors felt that when agreement between readers is required, identical technique, consist-ently applied, may be more important than increasing the number of microscope fields read. They cited other causes of errors in density measurements as slide quality and the random distribution of parasites and white cells within the blood film.
O'Meara et al [9] sent slides from 35 blood samples to 27
reference readers from 13 countries and asked them to record the density of asexual and sexual parasites of each species seen on the slide. They found a significant inverse correlation between discrepancy among microscopists and mean parasite density. Furthermore, they suggested that random chance in the selection of fields to examine may play a large part in reader discrepancy, especially with low parasitaemia. In their study, for the thick film (wbc) method the parasite counts were all derived using the
standard approximation of 8,000 wbcs per μL and the
group mean for a sample was scaled by the group mean, then plotted against the mean density for the sample. For all samples the deviation from the mean decreased as the number of reference wbcs increased. There was a signifi-cant negative correlation between the magnitude of the residuals and the number of wbcs counted for each meas-urement. In order to improve agreement among readers
O'Meara et al suggested that a uniform counting protocol
should be used and the number of white cells or red cells counted should be increased [9]. Both precision and accu-racy could be improved if the number of parasites per given volume could be counted, eg with the aid of a grid.
The laboratory personnel in this study were all experi-enced malaria microscopists and the results may be differ-ent with non-specialists. For example, in UK practice, diagnostic laboratory staff are less familiar with thick blood films than with thin films for malaria diagnosis (UK NEQAS, personal communication, 2008). However, the preparation of the standard panel is being undertaken by staff experienced in blood film examination, so the conclusions of this study remain applicable in that con-text. The thin film method, whilst closer to the true para-site count, is not feasible at parapara-site counts below 500 parasites per microlitre, so the thick film method (method two) has been selected as both reproducible and practical for the project because it gave slightly better inter-rater agreements, and was easier to perform, and is generally better known by malaria microscopists. In the long term, recombinant HRP2 could be used as a reproducible,
sta-ble and standardized substitute for P. falciparum infected
blood in some parts of an RDT product assessment pro-gramme and for lot testing of purchased RDT devices, though it cannot completely supplant the use of infected blood. Until rapid, reproducible, quantitative PCR for malaria is widely available, microscopy will remain the method of choice for the determination of malarial para-sitaemia, but it must be applied by skilled operators using standardized techniques, such as those assessed in this study.
Conclusion
The thin film method gave results closer to the true para-site count but is not feasible at a parasitaemia below 500 parasites per microlitre.
Publish with BioMed Central and every scientist can read your work free of charge
"BioMed Central will be the most significant development for disseminating the results of biomedical researc h in our lifetime."
Sir Paul Nurse, Cancer Research UK
Your research papers will be:
available free of charge to the entire biomedical community
peer reviewed and published immediately upon acceptance
cited in PubMed and archived on PubMed Central
yours — you keep the copyright
Submit your manuscript here:
http://www.biomedcentral.com/info/publishing_adv.asp
BioMedcentral
using standardized techniques, such as those assessed in this study.
Competing interests
The authors declare that they have no competing interests.
Authors' contributions
KB was the reference microscopist, participated in drafting the manuscript and supervised the collection of samples and pre-training of the microscopists in Cambodia and the Philippines, DB conceived the study and participated in its design and coordination, PC supervised all aspects of the study carried out in the United Kingdom and the drafting of the manuscript, JB supervised the micro-scopists in the United States and returned the results to the reference microscopist for analysis, SI organized the collection of samples in Cambodia and was the overall supervisor at this site, SY oversaw the microscopists and the correlation of the results in Cambodia, JL supervised the microscopists in the Philippines and correlated the data for the reference microscopist, HW performed all the statistical analysis for the study. All authors read and approved the final manuscript.
Acknowledgements
The authors are grateful for the assistance of the staff at the field collection sites at Pailin and Kampot, Cambodia, and Chris Frost (LSHTM) for Statis-tical advice and for comments on this manuscript. The project was funded by AudAID, USAID and DFID through the Special Programme for research and training in tropical diseases (TDR) and the WHO - Regional Office for the Western Pacific. Peter Chiodini is supported by the UCL Hospitals Comprehensive Biomedical Research Centre Infection Theme
References
1. Warhurst DC, Williams JE: Laboratory diagnosis of malaria. J Clin Pathol 1996, 49:533-538.
2. Earle WC, Perez M: Enumeration of parasites in the blood of
malarial patients. J Lab Clin Med 1932:1124-1130.
3. Singh B, Bobogare A, Cox-Singh J, Snounou G, Abdullah MS, Rahman
HA: A genus- and species-specific nested polymerase chain
reaction malaria detection assay for epidemiologic studies. Am J Trop Med Hyg 1999, 60:687-692.
4. World Health Organization: Malaria microscopy quality
assur-ance manual. 1999, Version 1:.
5. Bland JM, Altman DG: Measurement error proportional to the
mean. BMJ 1996, 313:106.
6. Bland JM, Altman DG: Statistical methods for assessing
agree-ment between two methods of clinical measureagree-ment. Lancet
1986, 1:307-310.
7. Dowling MAC, Shute GT: A comparative study of thick and thin blood films in the diagnosis of scanty malaria parasitaemia. Bull World Health Organ 1966, 34:249-267.
8. Bejon P, Andrews L, Hunt Cooke A, Sanderson F, Gilbert S, Hill AVS:
Thick blood film examination for Plasmodium falciparum
malaria has reduced sensitivity and underestimates parasite
density. Malar J 2006, 5:104.
9. O'Meara WP, Barcus M, Wongsrichanalai C, Muth S, Maguire JD, Jor-dan RG, Prescott WR, McKenzie FE: Reader technique as a source of variability in determining malaria parasite density
by microscopy. Malar J 2006, 5:118.
10. Greenwood BM, Armstrong JR: Comparison of two simple
methods for determining malaria parasite density. Trans R
Soc Trop Med Hyg 1991, 85:186-188.
11. Killian AHD, Metzger WG, Mutschelknauss EJ, Kabagambe G, Langi P, Korte R, von Sonnenburg F: Reliability of malaria microscopy in
epidemiological studies: results of quality control. Trop Med
Int Health 2000, 5:3-8.
12. O'Meara WP, McKenzie FE, Magill A, Forney JR, Permpanich B, Lucas C, Gasser RA Jr, Wongsrichanalai C: Sources of variability in
determining malaria parasite density by microscopy. Am J