R E S E A R C H A R T I C L E
Open Access
Identification of a set of endogenous reference
genes for miRNA expression studies in Parkinson
’
s
disease blood samples
Alice Serafin
1†, Luisa Foco
1†, Hagen Blankenburg
1, Anne Picard
1, Stefano Zanigni
1, Alessandra Zanon
1,
Peter P Pramstaller
1,2,3, Andrew A Hicks
1and Christine Schwienbacher
1*Abstract
Background:Research on microRNAs (miRNAs) is becoming an increasingly attractive field, as these small RNA molecules are involved in several physiological functions and diseases. To date, only few studies have assessed the expression of blood miRNAs related to Parkinson’s disease (PD) using microarray and quantitative real-time PCR (qRT-PCR). Measuring miRNA expression involves normalization of qRT-PCR data using endogenous reference genes for calibration, but their choice remains a delicate problem with serious impact on the resulting expression levels. The aim of the present study was to evaluate the suitability of a set of commonly used small RNAs as normalizers and to identify which of these miRNAs might be considered reliable reference genes in qRT-PCR expression analyses on PD blood samples.
Results:Commonly used reference genes snoRNA RNU24, snRNA RNU6B, snoRNA Z30 and miR-103a-3p were
selected from the literature. We then analyzed the effect of using these genes as reference, alone or in any possible combination, on the measured expression levels of the target genes miR-30b-5p and miR-29a-3p, which have been previously reported to be deregulated in PD blood samples.
Conclusions:We identified RNU24 and Z30 as a reliable and stable pair of reference genes in PD blood samples.
Keywords:qRT-PCR, snoRNA, snRNA, geNorm algorithm, Normfinder algorithm, Comparative delta-Ct
Background
MicroRNAs (miRNAs) are small non-coding RNAs of 20–22 nucleotides involved in transcriptional and post-transcriptional regulation of gene expression. MiRNAs function via base-pairing with complementary sequences within target mRNA molecules, usually resulting in gene silencing via translational repression or target degrad-ation [1]. MiRNAs are involved in several physiological functions, such as cell cycle, apoptosis, proliferation, dif-ferentiation and development [2]. In recent years the re-search on miRNAs has increased in intensity because of their involvement not only in physiological processes but also in different diseases. Several studies have shown
abnormal expression levels of miRNAs in different patholo-gies, including Parkinson’s disease [3]. The main clinical hallmarks of this neurodegenerative disorder are resting tremor, muscular rigidity, bradykinesia, impaired balance and coordination. Pathologically PD is characterized by the loss of the dopaminergic neurons in the motor control region substantia nigra and an accumulation of protein-filled structures called Lewy bodies [4]. Lewy bodies and other brain specific diagnostic signs cannot be observed until after death of the PD affected individuals. Biomarkers from easy accessible resources, such as peripheral blood, plasma, serum, urine, saliva, and eventually cerebrospinal fluid could be used to detect and monitor the disease much earlier, even before symptoms appear. Unfortunately to date no proven biomarkers are available for the diagno-sis of PD [5]. MiRNAs are strong and specific gene regula-tors and therefore promising candidates to be diagnostic markers and therapeutic targets. Peripheral blood can be * Correspondence:[email protected]
†Equal contributors
1Center for Biomedicine, European Academy Bozen/Bolzano (EURAC), 39100
Bolzano, Italy, Affiliated Institute of the University of Lübeck, Lübeck, Germany
Full list of author information is available at the end of the article
considered as a potential diagnostic tool because it is read-ily obtainable and reflects dynamically a system-wide biol-ogy [6].
To date, only few studies have assessed the expression of blood miRNAs related to Parkinson’s disease using microarray and quantitative real-time PCR [7,8]. Several methods have been developed to measure miRNA ex-pression [9]. Of these methods qRT-PCR is superior due to its sensitivity, specificity and linear dynamic range of quantification [10,11] and is therefore generally accepted as the gold standard for accurate gene quantification and small RNA profiling. To distinguish true biological changes from technical variations, several variables must be considered and controlled for gene-expression ana-lysis, such as the amount of the starting material and differences between tissues in overall transcriptional ac-tivity. The use of multiple stable reference genes is generally necessary as the method of choice for qRT-PCR data normalization. The normalization procedure is adapted to compare the expression levels of target genes with the expression of a reference gene to obtain a rela-tive quantification of the investigated target gene [12]. The expression of an ideal reference gene should not vary in the tissues or cells under investigation and in re-sponse to treatment or presence of a pathology [13]. Ac-curate expression profiling is critically dependent on technical variations due to the applied normalization strategies. A misleading estimation of the expression analysis data can arise if only a single or improper refer-ence genes are used [14]. These stable referrefer-ence genes can be identified from a set of candidate reference genes in a pilot experiment on a selection of samples that are representative for the experimental conditions under in-vestigation. Different algorithms, such as geNorm and Normfinder allow the ranking of candidate reference genes according to their stability and indicate the opti-mal number and combination of reference genes re-quired for accurate normalization of gene expression [10]. In the case of miRNA expression profiling, only few candidate reference miRNAs, including miRNA 103, have been identified [15,16]. Typically, other small en-dogenous noncoding RNAs such as small nuclear (snRNAs) and small nucleolar RNAs (snoRNAs) have been used [10] as they share similar properties, such as RNA stability and size and are expressed abundantly. Unfortunately their expression is not always stable [17]. As no universal reference gene has so far been identified, there is no substitute for empirical valid-ation of normalizvalid-ation that is appropriate to the par-ticular experimental design and goals [16]. Recently expression studies of circulating miRNAs in serum or plasma as potential biomarkers for PD are emerging [18,19]. In these studies synthetic, non-human spike-in miRNAs, used frequently to monitor RNA purification
and retrotranscription efficiencies, are almost exclu-sively used as well for normalization in expression ana-lyses, because of the lack of established reference genes [9]. Moreover, new emerging technologies including Droplet Digital PCR technology, which provides an abso-lute quantification of nucleic acids, are trying to overcome the problem of the normalization, but for now they are available only in few laboratories.
The aim of the present study was to evaluate the suit-ability of a set of commonly used small RNAs as nor-malizers and to identify which of these miRNAs might be considered reliable reference genes in qRT-PCR ex-pression analyses on PD blood samples. We compared the potential reference genes, snoRNA RNU24 (RNU24), snRNA RNU6B (RNU6B), snoRNA Z30 (Z30) and miR-103a-3p to find the best set of reference genes to use for normalization using (i) comparative delta-Ct [20], (ii) the NormFinder algorithm [21] and (iii) qbasePLUS, an improved version of the geNorm algorithm [14]. The ef-fect of different reference genes used on the relative quantification was shown using the target genes miR-30b-5p and miR-29a-3p, previously shown to be differ-entially expressed in PD blood samples [7,8].
Methods
Patient and control samples collection
38 patients affected by idiopathic Parkinson’s disease (PD) attending the Movement Disorders outpatient clinic of the Bolzano Hospital (Italy) were enrolled. Diagnosis of PD was made according to Gelb PD criteria [22]. All the patients were treated with Levodopa. The subjects with cognitive impairment or unable to sign informed consent or affected by atypical Parkinsonism were ex-cluded. 38 disease-free controls matched for sex and age (range ± 3 years), collected among spouses or unrelated companions of the patients, were also enrolled. The study was approved by the ethics committee of the Bol-zano Hospital and all of the enrolled subjects provided written informed consent to participate.
RNA isolation and quality control
Whole peripheral blood from patients and controls was collected per participant in a Na3-Citrate buffered Veno-safe® Plastic Tube (VF-054SBCS07, Terumo) and stored at room temperature. Within 6 hours of blood collection the peripheral blood mononuclear cells (PBMCs) were isolated after lysis of red blood cells by Red Blood Cell (RBC) Lysing Buffer. Total RNA, including small RNAs, was extracted from white blood cells using TRIzol® reagent (Invitrogen) according to the manufacturer’s instructions and stored at−80°C.
s.r.l., Milano, Italy), using Experion™ StdSens Analysis Kit (Bio-Rad Laboratories s.r.l., Milano, Italy). The RNA Qual-ity Indicator (RQI) feature of Experion software allows es-timating the level of the integrity of eukaryotic total RNA samples. All 76 collected samples showed an a RQI≥8.0 and were included in the expression analyses.
Reverse Transcription and gene specific quantitative real time PCR
Expression analyses were performed by single gene specific stem loop RT-PCR. Reverse transcription (RT) reactions were performed on 7 ng of total RNA using the TaqMan miRNA Reverse Transcription Kit (Applied Biosystem; Part.No 4366597) and miRNA-specific stem-loop primers (Table 1) in a scaled down volume of 10μl RT reaction, according to the manufacturer’s instructions.
The thermal cycling parameters of reverse transcrip-tion were 30 min at 16°C, 30 min at 42°C, and 5 min at 85°C. The cDNA samples were diluted in nuclease-free water and stored at−20°C.
All quantitative real-time PCR reactions were performed in triplicate on Bio-Rad 96CFX instrument (Bio-Rad Laboratories s.r.l., Milano, Italy), in scaled down 10μl reac-tion volumes using 0.7μl of RT product per reaction using Universal MasterMixII, no UNG and gene specific TaqMan® small RNA Assays (Applied Biosystem®; Table 1) according to the manufacturer’s instructions. All reactions were performed on hard shell PCR plates (Bio-Rad Labora-tories Inc. Part.No HSP9645), sealed using adhesive Micro-seal ‘B’ Films (Bio-Rad Laboratories Inc. Part.No RSN 102595). One reference sample and one NTC (blank) were included in triplicate on each plate. The thermal cycling parameters were 10 min at 95°C followed by 40 cycles of 15 sec at 95°C and 1 min at 60°C.
PCR amplification efficiencies for all target and reference genes were determined from the slope of the log-linear portion of calibration curves, generated from a two-fold dilution series of one reference sample at five dilution points for three technical replicates for each gene assay (Table 1). PCR reactions were performed as described
previously for the quantitative real-time PCR reactions. The relative expression of miR-30b-5p and miR-29a-3p were assessed using the Bio-Rad CFX Manager v1.6 (Bio-Rad Laboratories s.r.l., Milano, Italy) software. For normalization, different combinations of reference genes among RNU24, RNU6B, Z30 and miR-103a-3p were used.
Statistical analysis
In order to determine the expression stability of the four candidate reference genes, statistical analyses of their ex-pression across all samples were performed using three different algorithms: NormFinder [21], GeNorm [14], and comparative delta-Ct method [20]. NormFinder computes a stability measure and the lowest value indi-cates the most stable gene expression. Samples are grouped to allow direct estimation of expression vari-ation, ranking genes according to the similarity of their expression profiles by using a model-based approach. NormFinder takes into account inter- and intragroup variation for normalization factor calculations avoiding misinterpretation caused by artificial selection of co-regulated genes. GeNorm computes an M value describing the variation of a gene compared to all other candidate genes. Similarly to the NormFinder stability value, lower M values indicate stable gene expression. Specifically, stable reference genes are supposed to have an M value smaller than 1.5.
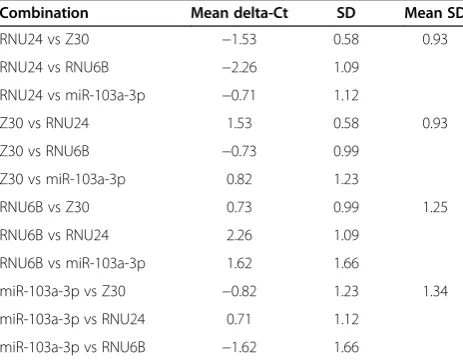
Comparative delta-Ct compares relative expression of pairs of genes within each sample set and ranks stability of reference genes according to the repeatability of the gene expression difference.
[image:3.595.57.539.590.724.2]Scatter plots and box plots were used to visualize the presence of outliers in the expression Ct values; outlier values, as evidenced by the box plot, were labelled for possible subsequent removal. Medians and interquartile ranges were produced to summarize data. The medians were calculated on the differences of the expression be-tween each case and its matched control.
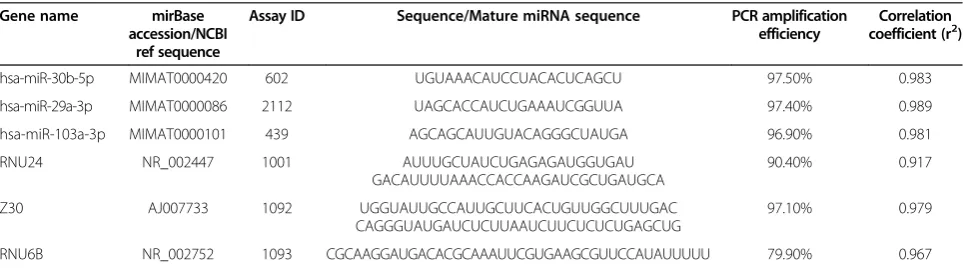
Table 1 TaqMan® MicroRNA Assays and relative amplification efficiencies
Gene name mirBase
accession/NCBI ref sequence
Assay ID Sequence/Mature miRNA sequence PCR amplification
efficiency
Correlation coefficient (r2)
hsa-miR-30b-5p MIMAT0000420 602 UGUAAACAUCCUACACUCAGCU 97.50% 0.983
hsa-miR-29a-3p MIMAT0000086 2112 UAGCACCAUCUGAAAUCGGUUA 97.40% 0.989
hsa-miR-103a-3p MIMAT0000101 439 AGCAGCAUUGUACAGGGCUAUGA 96.90% 0.981
RNU24 NR_002447 1001 AUUUGCUAUCUGAGAGAUGGUGAU
GACAUUUUAAACCACCAAGAUCGCUGAUGCA
90.40% 0.917
Z30 AJ007733 1092 UGGUAUUGCCAUUGCUUCACUGUUGGCUUUGAC
CAGGGUAUGAUCUCUUAAUCUUCUCUCUGAGCUG
97.10% 0.979
RNU6B NR_002752 1093 CGCAAGGAUGACACGCAAAUUCGUGAAGCGUUCCAUAUUUUU 79.90% 0.967
For miR-29a-3p and miR-30b-5p, the distribution of the difference of the expression levels between cases and controls, within each matched pair and normalized with different combinations of reference genes, was checked using a Skewness-Kurtosis test for normality. A subset of the ladder of powers for variable trans-formation in case of departure from normality was evaluated [23].
Relative expression of miR-29a-3p and miR-30b-5p was analysed using a Wilcoxon matched-pairs signed-ranks test. Although 15 tests for each microRNA were performed, no adjustment for multiple comparisons was done. This is because in practice the only test that would have been performed is the one based on dataa priori normalized for the best reference gene combination. Spearman’s rank correlation coefficients were com-puted on Ct reference gene data and on normalized miR-29a-3p and miR-30b-5p data. GeNorm analysis was per-formed using Biogazelle’s qbasePLUS software (Bio-Rad Laboratories Inc.) and NormFinder analysis was per-formed using “NormFinder.xla”, a Microsoft Excel-based Visual Basic application. All other analyses were performed using Stata 12 [24].
Results
The selection of the best set of endogenous reference genes for gene expression studies in Parkinson’s disease blood samples was based on the efficiency of the TaqMan® MicroRNA Assays, the quality of the related expression data, and on the expression stability analysis.
Evaluation of the amplification efficiencies of the TaqMan® MicroRNA Assays
The hallmarks for an accurate and optimized qRT-PCR assay are a linear correlation coefficient (r2) equal or greater than 0.98 and a PCR amplification efficiency from 90% to 110% [11]. The r2 value indicates the
quality of the fit of the standard curve to the plotted data points. Primer efficiency indicates the amplicon doubling rate of a specific primer pair during a PCR. An efficiency of 100% indicates that the cDNA target is duplicated at every PCR cycle during the exponential phase. The efficiencies of the TaqMan® MicroRNA As-says of the four candidate reference genes (RNU24, RNU6B, Z30 and miR-103a-3p), and the two target genes (miR-30b-5p and miR-29a-3p) were calculated from the slope of the log-linear portion of calibration curves as described (Materials and Methods; Reverse Transcription and quantitative real time PCR) and are reported in Table 1. RNU24, Z30, 103a-3p, miR-30b-5p, and miR-29a-3p showed amplification efficien-cies and r2values ranging respectively between 90.4% and 97.5% and between 0.92 and 0.99 demonstrating a high performance. In contrast, RNU6B showed a low amplification efficiency of 79.9% with a correlation coefficient of 0.967.
Data quality control
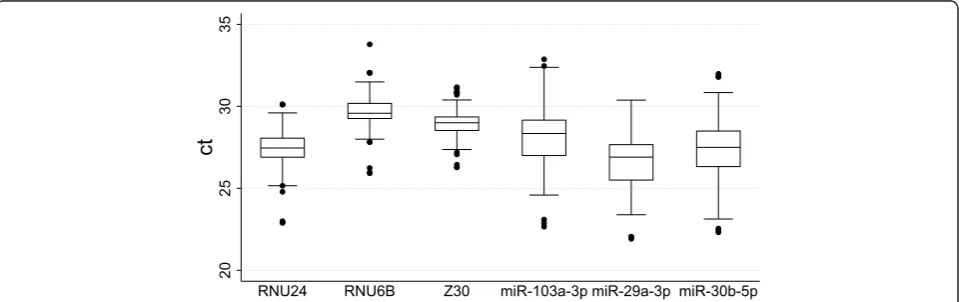
The analysis of the generated Ct data revealed the pres-ence of a few outliers, as evidpres-enced in Figure 1. Because no evident technical reason could be found to exclude them, given the high quality of the extracted RNA as evaluated by Experion RNA chip electrophoresis, and the overall high performance of the qRT-PCR reactions, they were not removed from the analyses, but they were rather considered an expression of normal biological variability. The differences of the relative gene expres-sion in cases and in controls, within each matched pair, did not always follow a normal distribution. Since no unique transformation was able to restore deviations from normality, a non-parametric Wilcoxon matched-pairs signed-ranks test was subsequently used to analyse data.
20
25
30
35
ct
[image:4.595.59.540.554.705.2]RNU24 RNU6B Z30 miR-103a-3p miR-29a-3p miR-30b-5p
Expression stability analysis
The results of the expression stability assessment of Z30, RNU24, RNU6B and miR-103a-3p genes among all ana-lysed samples are reported in Tables 2 and 3, showing the results of the comparative delta-Ct method, and the comparison with the NormFinder and geNorm results. Independently from the method used, the gene ranking remained unchanged, indicating Z30 and RNU24 as the best reference genes. In particular, the combination of Z30 and RNU24 was selected as the best among all the others, as underlined by the stability value of 0.011 cal-culated by NormFinder, the M value of 0.489 calcal-culated by geNorm (see Additional file 1: Figure S1), and the delta-Ct values (Table 2). This combination showed the smallest and therefore best stability values among all the other combinations of reference genes (see Additional file 1: Figure S1) whereas the worst combination was at-tributed to RNU6B and miR-103a-3p.
Unexpectedly, miR-103a-3p, previously indicated as a suitable reference gene for quantification of microRNAs in peripheral blood of PD patients through qRT-PCR [8], was consistently found to be the worst reference gene in the analysed sample (Tables 2 and 3).
Furthermore, since the expression of reference genes is supposed to remain constant among different samples, we would expect that the relationship between the expres-sion of two reference genes is linear.
To estimate the inter-gene relations of the four puta-tive reference genes, correlation analysis was performed. Results indicate that the strength of the linear relation-ship is good for Z30 and RNU24 expression (r = 0.8004, p < 0.0001), which are those candidates ranked as the best reference genes. The correlation of the expression
of RNU6B and miR-103a-3p with Z30 and RNU24 is smaller, with the lowest correlations observed between the expression levels of miR-103a-3p and the remaining reference genes (see Additional file 1: Table S1).
The same trend is also indicated by the scatter plot matrix (see Additional file 1: Figure S2), where the most linear relationship could be observed between Z30 and RNU24.
All the analyses were also repeated excluding outlier samples (sensitivity analyses), but no difference in the rank of the reference genes was observed (data not shown).
Consequence of normalizing expression of miR-29a-3p and miR-30b-5p in PD cases and matched controls with different combinations of reference genes
We tested the effect of using different combinations of reference genes on the relative expression values using miR-29a-3p and miR-30b-5p as targets, which were found to be deregulated in PD in previous studies [7,8].
The results of the Wilcoxon matched-pairs signed-ranks test (Table 4) show that there is an increased relative expression of miR-29a-3p and miR-30b-5p in patients with PD in comparison to controls.
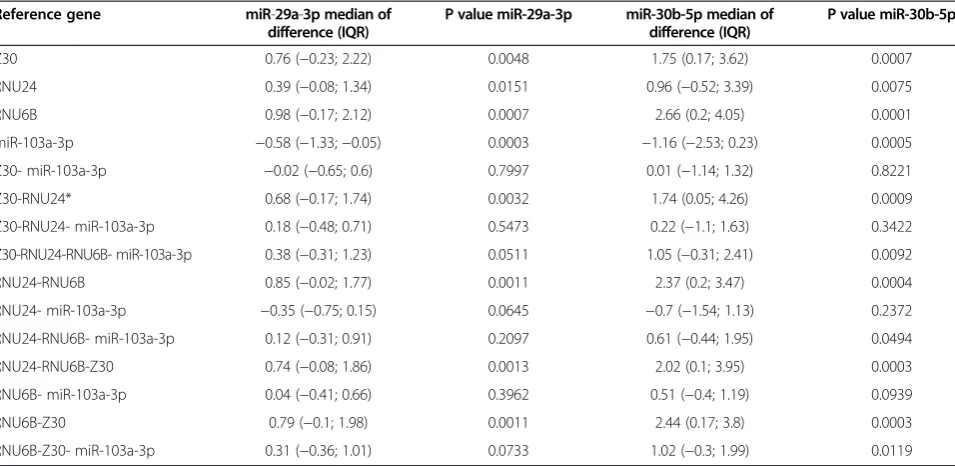
Normalizing the expression values of miR-29a-3p and miR-30b-5p for the best reference gene combination of Z30 and RNU24 results in a median difference of the relative expression of 0.68 (IQR =−0.17; 1.74) for miR-29a-3p (p value = 0.0032), and equal to 1.74 (IQR = 0.05; 4.26) for miR-30b-5p (p value =0.0009). This trend was consistently observed using Z30, RNU24 and RNU6B as reference genes, either alone or in different combinations (Table 4).
[image:5.595.305.540.123.192.2]However, the normalization of the microRNA expres-sion using miR-103a-3p as reference gene results in an opposite effect, with a lower expression of miR-29a-3p and miR-30b-5p in cases, in comparison with controls. The usage of miR-103a-3p alone as a reference gene was sufficient to completely reverse the direction of the expression difference between cases and controls of the investigated miRNAs (miR-29a-3p median difference =−0.58, Table 3 Comparison of the stability values estimated using the comparative delta-Ct, NormFinder and GeNorm algoritms
Gene Comparative delta-Ct NormFinder GeNorm
RNU24 0.93 0.007 0.839
Z30 0.93 0.016 0.841
RNU6B 1.25 0.033 1.112
miR-103a-3p 1.34 0.018 1.310
[image:5.595.57.289.535.715.2]Comparative delta-Ct= mean of the standard deviations (SD), as shown in Table2; NormFinder = stability values computed with NormFinder and GeNorm: M stability values, calculated assuming the specific efficiency for each gene assay. NormFinder = stability values computed with NormFinder and GeNorm: M stability values, calculated assuming the specific efficiency for each gene assay.
Table 2 Comparison of candidate reference genes expression stability using the comparative delta-Ct method
Combination Mean delta-Ct SD Mean SD
RNU24 vs Z30 −1.53 0.58 0.93
RNU24 vs RNU6B −2.26 1.09
RNU24 vs miR-103a-3p −0.71 1.12
Z30 vs RNU24 1.53 0.58 0.93
Z30 vs RNU6B −0.73 0.99
Z30 vs miR-103a-3p 0.82 1.23
RNU6B vs Z30 0.73 0.99 1.25
RNU6B vs RNU24 2.26 1.09
RNU6B vs miR-103a-3p 1.62 1.66
miR-103a-3p vs Z30 −0.82 1.23 1.34
miR-103a-3p vs RNU24 0.71 1.12
miR-103a-3p vs RNU6B −1.62 1.66
IQR =−1.33; −0.05, p = 0.0003 and miR-30b-5p median difference =−1.16, IQR =−2.53; 0.23, p = 0.0005).
The inclusion of miR-103a-3p in any other combination of reference genes systematically worsened the observed p values. This effect was clearly visible with the addition of miR-103a-3p to the combination of Z30 and RNU24, which had a strong impact on the results observed for both miR-29a-3p and miR-30b-5p, with the p value of miR-29a-3p changing from p = 0.0032 to p = 0.5473 and the p value of miR-30b-5p changing from p = 0.0009 to p = 0.3422. Indeed, the relative expression levels of miR-29a-3p/miR-30b-5p were not always well correlated with each other. But some differences could be observed, de-pending on the reference gene set used for normalization, as shown in Additional file 1: Tables S2 and S3. Smaller correlation coefficients could be observed when miR-103a-3p alone was used as a reference gene, while cor-relations were improved when it was present in other combinations.
Sensitivity analyses were finally repeated excluding out-lier samples, but no difference in the results was observed (data not shown).
Discussion
Quantitative real-time PCR is the most commonly avail-able and reliavail-able method used in expression profile studies aimed at detecting changes in gene expression, because alternative approaches do not yet match the sensitivity
and specificity of PCR-based approach. The choice of housekeeping genes in a qRT-PCR study is a critical step before starting any experiment, in order to avoid inaccurate interpretation of the data that may lead to biased results. Indeed, it has been shown in several publications that traditional reference genes used in qRT-PCR studies do not always show a stable expression pattern. The same gene revealed as almost invariant for certain tissues or cell types, could present highly variable expression levels in other tissues or experimental condi-tions [20,25,26]. Thus, suitable control genes are extremely specific for particular sample sets and experimental models, being a crucial component in assessing gene expression patterns with confidence. Striking examples are provided by the glyceraldehyde-3-phosphate dehydro-genase (GAPDH) and beta-actin genes, which have been extensively used for normalization of gene expression data in a broad range of different tissues and pathologies, in-cluding the nervous system [25-28]. It has been shown however, that GAPDH and beta-actin genes are indeed direct targets of miR-644a in prostate cancer cell lines, demonstrating the unsuitability ofGAPDHand beta-actin as internal controls in miR-644a functional studies and emphasizing the need to carefully consider the choice of a reference gene according to the specific study design [29].
[image:6.595.60.538.100.333.2]Small nuclear RNAs as well as miRNAs and snoRNAs are widely used as reference genes for miRNA studies in tissue samples and blood. To date, in the field of the Table 4 Changes in the results of the analyses depending on the choice of the reference genes
Reference gene miR-29a-3p median of
difference (IQR)
P value miR-29a-3p miR-30b-5p median of difference (IQR)
P value miR-30b-5p
Z30 0.76 (−0.23; 2.22) 0.0048 1.75 (0.17; 3.62) 0.0007
RNU24 0.39 (−0.08; 1.34) 0.0151 0.96 (−0.52; 3.39) 0.0075
RNU6B 0.98 (−0.17; 2.12) 0.0007 2.66 (0.2; 4.05) 0.0001
miR-103a-3p −0.58 (−1.33;−0.05) 0.0003 −1.16 (−2.53; 0.23) 0.0005
Z30- miR-103a-3p −0.02 (−0.65; 0.6) 0.7997 0.01 (−1.14; 1.32) 0.8221
Z30-RNU24* 0.68 (−0.17; 1.74) 0.0032 1.74 (0.05; 4.26) 0.0009
Z30-RNU24- miR-103a-3p 0.18 (−0.48; 0.71) 0.5473 0.22 (−1.1; 1.63) 0.3422
Z30-RNU24-RNU6B- miR-103a-3p 0.38 (−0.31; 1.23) 0.0511 1.05 (−0.31; 2.41) 0.0092
RNU24-RNU6B 0.85 (−0.02; 1.77) 0.0011 2.37 (0.2; 3.47) 0.0004
RNU24- miR-103a-3p −0.35 (−0.75; 0.15) 0.0645 −0.7 (−1.54; 1.13) 0.2372
RNU24-RNU6B- miR-103a-3p 0.12 (−0.31; 0.91) 0.2097 0.61 (−0.44; 1.95) 0.0494
RNU24-RNU6B-Z30 0.74 (−0.08; 1.86) 0.0013 2.02 (0.1; 3.95) 0.0003
RNU6B- miR-103a-3p 0.04 (−0.41; 0.66) 0.3962 0.51 (−0.4; 1.19) 0.0939
RNU6B-Z30 0.79 (−0.1; 1.98) 0.0011 2.44 (0.17; 3.8) 0.0003
RNU6B-Z30- miR-103a-3p 0.31 (−0.36; 1.01) 0.0733 1.02 (−0.3; 1.99) 0.0119
Different combinations of reference genes lead to different relative expression values of miR-29a-3p and miR-30b-5 in the matched PD pairs, therefore affecting the results of the statistical analyses and leading to discordant evidence. *Best set of reference genes.
Parkinson's disease there is no work reporting the valid-ation of a set of reliable reference genes for a miRNA pro-filing study in blood PD samples.
For that reason, the present study aims not only to identify and to validate specific endogenous reference genes as reported in the literature, but also to evaluate the impact of the use of different combinations of these reference genes on the interpretation of expression pro-file differences between cases and controls of certain tar-get miRNAs.
We selected from the literature the most commonly used reference genes in qRT-PCR blood studies or in neurological diseases studies. We then assessed their suitability as normalizers, and their effect, alone or in combination, on the target genes 30b-5p and miR-29a-3p in PD blood samples, previously shown to have altered expression profiles in PD [7,8]. The selection of the best set of endogenous reference genes for gene ex-pression studies in Parkinson’s disease blood samples from those tested was based on the efficiency of the TaqMan® MicroRNA Assays, the quality of the related expression data, on the expression stability analysis, and biological data available in the literature.
Using these metrics of efficiency, quality and stability, RNU24 ranks top of the list, followed by Z30 as the best reference genes in our study. Moreover, neither RNU24 nor Z30 have been related so far to neurodegeneration and/or Parkinson’s disease. On the contrary, miR-103a-3p is ranked as the worst reference gene, so much so that in combination with other reference genes it is able to bias results.
It is important to underline that miR-103a-3p alone or in combination with the other reference genes reverses the direction of the expression of 29a-3p and miR-30b-5p. Our results are consistent with the available literature evidence, which support the unsuitability of miR-103a-3p as a reference gene in PD studies for a num-ber of reasons. MiR-103a-3p and miR-107 have been re-cently shown to target human CDK5R1 [30], coding for the regulatory subunit 1 of cyclin-dependent kinase 5, a protein found to be hyperactivated in different neurode-generative diseases, including Parkinson’s and Alzheimer's diseases [31,32]. The same two miRNAs have also been shown to regulate insulin sensitivity by targeting caveolin-1 [33]. The connection between miR-caveolin-103a-3p and insulin is relevant, since insulin is known to regulate dopamine release. Moreover, in a recent study a correlation between PD and a hyperglycaemic status was shown in rats [34]. Last, but not of minor importance when studying neuro-degenerative disease, is the evidence that the expression of miR-103a-3p varies depending on the age of the patients [35]. In our study, the paired case–control experimental design allows correction for the confounding effect of age, but adjustment for age would be required for unmatched
designs. This may be unfeasible for small qRT-PCR studies, therefore the confounding effect would not be controlled and the results would be biased.
Contrary to miR-103a-3p, the insertion of RNU6B in combinations with other reference genes has a lower im-pact on the stability values, but we hypothesize that this effect can be attributed to the high stability of RNU24 and Z30. RNU6B was not considered to be a reliable refer-ence gene for PD blood samples in our study, because the efficiency, the r2and the stability values were too low. Fur-thermore, in support of this conclusion, RNU6B has been shown to be stable under some but not all conditions of neuronal differentiation [36].
Conclusion
In conclusion, the results of this study indicate that rela-tive expression differences of the selected microRNAs between Parkinson’s cases and controls were profoundly affected by the choice of the reference gene set, thus demonstrating the complexity of the choice of reference gene set. A real endogenous reference gene should be stably expressed, regardless of physiological conditions, including age and disease. In our hands, using miR-103a-3p as a reference gene, alone or in combination with other suitable genes, produced contrasting results within our dataset. Our data suggest that RNU24 and Z30 constitute a reference gene set that will lead to reliable data for normalization of miRNA expression profiles in blood of PD patients versus controls, at least until new technolo-gies for direct PCR quantification such as droplet-digital PCR become more widespread and affordable. The results confirm the importance of a careful choice of the refer-ence genes, which should be evaluated depending on the specific on-going study, not relying solely on evidence already published.
Additional file
Additional file 1:The file contains the additional tables S1-S3 and the additional figures S1-S2.
Abbreviations
miRNAs:microRNAs; PD: Parkinson’s disease; RT-qPCR: Reverse transcription and quantitative real time polymerase chain reaction; RT: Reverse
Transcription; PBMCs: Peripheral blood mononucleated cells; RQI: RNA quality indicator; Ct: Threshold cycle.
Competing interests
The authors declare that they have no competing interests.
Authors’contribution
characterization of the patients. AAH critically revised the manuscript and contributed to the design of the sample collection. CS designed and supervised the study, contributed to the design of the sample collection, and wrote the manuscript. All authors read and approved the final manuscript.
Acknowledgments
The authors are grateful to the study participants for their participation and collaboration in this research project. We thank Diana Riekschnitz and Clemens Egger for technical support. The authors acknowledge the help of Giulia Giannini, Agatha Eisendle, Edith Kompatscher, and Monika Mair in recruiting the study participants. The authors are grateful to Deborah Mascalzoni, Fabiola del Greco, Pietro Cortelli and Marika Falla for their support in ethical, statistical and medical issues. This work was supported by the Department for Promotion of Educational Policies, Universities and Research of the Autonomous Province of Bolzano, South Tyrol and the South Tyrolean Sparkasse Foundation.
Author details
1Center for Biomedicine, European Academy Bozen/Bolzano (EURAC), 39100
Bolzano, Italy, Affiliated Institute of the University of Lübeck, Lübeck, Germany.2Department of Neurology, General Central Hospital, 39100 Bolzano, Italy.3Department of Neurology, University of Lübeck, 23538 Lübeck, Germany.
Received: 17 June 2014 Accepted: 2 October 2014 Published: 10 October 2014
References
1. Saini HK, Griffiths-Jones S, Enright AJ:Genomic analysis of human microRNA transcripts.Proc Natl Acad Sci U S A2007,104(45):17719–17724.
2. Bartel DP:MicroRNAs: genomics, biogenesis, mechanism, and function.
Cell2004,116(2):281–297.
3. Heyer MP, Pani AK, Smeyne RJ, Kenny PJ, Feng G:Normal midbrain dopaminergic neuron development and function in miR-133b mutant mice.J Neurosci2012,32(32):10887–10894.
4. Bras J, Singleton A, Cookson MR, Hardy J:Emerging pathways in genetic Parkinson’s disease: Potential role of ceramide metabolism in Lewy body disease.FEBS J2008,275(23):5767–5773.
5. Shtilbans A, Henchcliffe C:Biomarkers in Parkinson’s disease: an update.
Curr Opin Neurol2012,25(4):460–465.
6. Liew CC, Ma J, Tang HC, Zheng R, Dempsey AA:The peripheral blood transcriptome dynamically reflects system wide biology: a potential diagnostic tool.J Lab Clin Med2006,147(3):126–132.
7. Margis R, Margis R, Rieder CR:Identification of blood microRNAs associated to Parkinsonis disease.J Biotechnol2011,152(3):96–101. 8. Martins M, Rosa A, Guedes LC, Fonseca BV, Gotovac K, Violante S, Mestre T,
Coelho M, Rosa MM, Martin ER, Vance JM, Outeiro TF, Wang L, Borovecki F, Ferreira JJ, Oliveira SA:Convergence of miRNA expression profiling, alpha-synuclein interacton and GWAS in Parkinson’s disease.PLoS One 2011,6(10):e25443.
9. Kang K, Peng X, Luo J, Gou D:Identification of circulating miRNA biomarkers based on global quantitative real-time PCR profiling.J Anim Sci Biotechnol2012,3(1):1–9.
10. D’haene B, Mestdagh P, Hellemans J, Vandesompele J:miRNA expression profiling: from reference genes to global mean normalization.Methods Mol Biol2012,822:261–272.
11. Hellemans J, Vandesompele J:qPCR data analysis - unlocking the secret to successful results.InPCR Troubleshooting and Optimization: The Essential Guide.Edited by Suzanne K, Nick O. Poole (UK): MO BIO Laboratories. Caister Academic Press; 2011:1–13.
12. Wotschofsky Z, Meyer HA, Jung M, Fendler A, Wagner I, Stephan C, Busch J, Erbersdobler A, Disch AC, Mollenkopf HJ, Jung K:Reference genes for the relative quantification of microRNAs in renal cell carcinomas and their metastases.Anal Biochem2011,417(2):233–241.
13. Sanders I, Holdenrieder S, Walgenbach-Brunagel G, von Ruecker A, Kristiansen G, Muller SC, Ellinger J:Evaluation of reference genes for the analysis of serum miRNA in patients with prostate cancer, bladder cancer and renal cell carcinoma.Int J Urol2012,
19(11):1017–1025.
14. Vandesompele J, De Preter K, Pattyn F, Poppe B, Van Roy N, De Paepe A, Speleman F:Accurate normalization of real-time quantitative RT-PCR data by geometric averaging of multiple internal control genes.Genome Biol 2002,3(7):1–12.
15. Peltier HJ, Latham GJ:Normalization of microRNA expression levels in quantitative RT-PCR assays: identification of suitable reference RNA targets in normal and cancerous human solid tissues.RNA2008,
14(5):844–852.
16. Latham G:Normalization of MicroRNA Quantitative RT-PCR Data in Reduced Scale Experimental Designs.InMicroRNAs and the Immune System: Methods and Protocols, Methods in Molecular Biology. Volume 667.Edited by Monticelli S, Springer Science+Business Media. New York: Humana Press; 2010:19–31.
17. Gee HE, Buffa FM, Camps C, Ramachandran A, Leek R, Taylor M, Patil M, Sheldon H, Betts G, Homer J, West C, Ragoussis J, Harris AL:The small-nucleolar RNAs commonly used for microRNA normalisation correlate with tumour pathology and prognosis.Br J Cancer2011,
104(7):1168–1177.
18. Khoo SK, Petillo D, Kang UJ, Resau JH, Berryhill B, Linder J, Forsgren L, Neuman LA, Tan AC:Plasma-Based Circulating MicroRNA Biomarkers for Parkinson’s Disease.J Parkinson’s Dis2012,2:321–331.
19. Cardo LF, Coto E, de Mena L, Ribacoba R, Moris G, Menendez M, Alvarez V:
Profile of microRNAs in the plasma of Parkinson’s disease patients and healthy controls.J Neurol2013,260(5):1420–1422.
20. Silver N, Best S, Jiang J, Thein SL:Selection of housekeeping genes for gene expression studies in human reticulocytes using real-time PCR.
BMC Mol Biol2006,7:33.
21. Andersen CL, Jensen JL, Orntoft TF:Normalization of real-time quantitative reverse transcription-PCR data: a model-based variance estimation approach to identify genes suited for normalization, applied to bladder and colon cancer data sets.Cancer Res2004,
64(15):5245–5250.
22. Gelb DJ, Oliver E, Gilman S:Diagnostic criteria for Parkinson disease.Arch Neurol1999,56(1):33–39.
23. Tukey JW:Exploratory Data Analysis.Boston: Anonymous Addison-Wesley Publishing Company, Reading, MA; 1977.
24. StataCorp:Stata Statistical Software: Release 12.College Station, TX: StataCorp LP; 2011.
25. Dheda K, Huggett JF, Bustin SA, Johnson MA, Rook G, Zumla A:Validation of housekeeping genes for normalizing RNA expression in real-time PCR.
Biotechniques2004,37(1):112.–4, 116, 118–9.
26. Valente V, Teixeira SA, Neder L, Okamoto OK, Oba-Shinjo SM, Marie SK, Scrideli CA, Paco-Larson ML, Carlotti CG Jr:Selection of suitable housekeeping genes for expression analysis in glioblastoma using quantitative RT-PCR.BMC Mol Biol2009,10:17–2199. 10-17.
27. Benn CL, Fox H, Bates GP:Optimisation of region-specific reference gene selection and relative gene expression analysis methods for pre-clinical trials of Huntington’s disease.Mol Neurodegener2008,3:1–17.
28. Glare EM, Divjak M, Bailey MJ, Walters EH:beta-Actin and GAPDH housekeeping gene expression in asthmatic airways is variable and not suitable for normalising mRNA levels.Thorax2002,
57(9):765–770.
29. Sikand K, Singh J, Ebron JS, Shukla GC:Housekeeping gene selection advisory: glyceraldehyde-3-phosphate dehydrogenase (GAPDH) and beta-actin are targets of miR-644a.PLoS One2012,7(10):e47510. 30. Moncini S, Salvi A, Zuccotti P, Viero G, Quattrone A, Barlati S, De Petro G,
Venturin M, Riva P:The role of miR-103 and miR-107 in regulation of CDK5R1 expression and in cellular migration.PLoS One2011,6(5):e20038. 31. Smith PD, Crocker SJ, Jackson-Lewis V, Jordan-Sciutto KL, Hayley S,
Mount MP, O’Hare MJ, Callaghan S, Slack RS, Przedborski S, Anisman H, Park DS:Cyclin-dependent kinase 5 is a mediator of dopaminergic neuron loss in a mouse model of Parkinson’s disease.Proc Natl Acad Sci U S A2003,100(23):13650–13655.
32. Wang WX, Rajeev BW, Stromberg AJ, Ren N, Tang G, Huang Q, Rigoutsos I, Nelson PT:The expression of microRNA miR-107 decreases early in Alzheimer’s disease and may accelerate disease progression through regulation of beta-site amyloid precursor protein-cleaving enzyme 1.
J Neurosci2008,28(5):1213–1223.
34. Herrera BM, Lockstone HE, Taylor JM, Ria M, Barrett A, Collins S, Kaisaki P, Argoud K, Fernandez C, Travers ME, Grew JP, Randall JC, Gloyn AL, Gauguier D, McCarthy MI, Lindgren CM:Global microRNA expression profiles in insulin target tissues in a spontaneous rat model of type 2 diabetes.Diabetologia 2010,53(6):1099–1109.
35. Noren Hooten N, Abdelmohsen K, Gorospe M, Ejiogu N, Zonderman AB, Evans MK:microRNA expression patterns reveal differential expression of target genes with age.PLoS One2010,5(5):e10724.
36. Lim QE, Zhou L, Ho YK, Wan G, Too HP:snoU6 and 5S RNAs are not reliable miRNA reference genes in neuronal differentiation.Neuroscience 2011,199:32–43.
doi:10.1186/1756-0500-7-715
Cite this article as:Serafinet al.:Identification of a set of endogenous reference genes for miRNA expression studies in Parkinson’s disease blood samples.BMC Research Notes20147:715.
Submit your next manuscript to BioMed Central and take full advantage of:
• Convenient online submission
• Thorough peer review
• No space constraints or color figure charges
• Immediate publication on acceptance
• Inclusion in PubMed, CAS, Scopus and Google Scholar
• Research which is freely available for redistribution