COMPARISON OF TWO METHODS IN ESTIMATING THE RELATION
BETWEEN DENTAL AGE AND CHRONOLOGICAL AGE
A Dissertation submitted in
partial fulfillment of the requirements
for the degree of
MASTER OF DENTAL SURGERY
BRANCH – IX
ORAL MEDICINE AND RADIOLOGY
THE TAMILNADU Dr.M.G.R.MEDICAL UNIVERSITY
DECLARATION
TITLE OF DISSERTATION
COMPARISON OF TWO METHODS
IN ESTIMATING THE RELATION
BETWEEN DENTAL AGE AND
CHRONOLOGICAL AGE
PLACE OF STUDY
K.S.R .Institute of Dental Science and
Research
DURATIONOF COURSE
3 Years
NAME OF THE GUIDE
Dr.Nazargi Mahabob
HEAD OF THE DEPARTMENT
Dr.(Capt) S.Elangovan
I hereby declare that no part of the dissertation will be utilized for gaining
financial assistance for research or other promotions without obtaining prior
permission of the Principal, K.S.R. Institute of Dental Science and Research,
Tiruchengode. In addition, I declare that no part of this work will be published
either in print or electric without the guide who has been actively involved in the
dissertation. The author has the right to reserve publishing of work solely with
prior permission of the Principal, K.S.R. Institute of Dental Science and Research,
Tiruchengode.
CERTIFICATE BY THE GUIDE
This is to certify that dissertation titled
“COMPARISON OF TWO
METHODS IN ESTIMATING THE RELATION BETWEEN DENTAL AGE
AND CHRONOLOGICAL AGE”
is a bonafide research workdone by
Dr.G.SURYA
in partial fulfillment of the requirements for the degree of
MASTER OF DENTAL SURGERY
in the speciality of
ORAL MEDICINE
AND RADIOLOGY.
Date :
Place :
Signature of H.O.D Signature of Guide
DR.(CAPT).S.ELANGOVAN.,M.D.S. DR.NAZARGI MAHABOB.,M.D.S.
ENDORSEMENT BY THE H.O.D,PRINCIPAL/HEAD OF THE
INSTITUTION
This is to certify that
Dr.G.SURYA
, Post Graduate student (2015-2018) in the
Department of Oral Medicine and Radiology, K.S.R Institute of Dental Science
and Research, has done this dissertation titled
“COMPARISON OF TWO
METHODS IN ESTIMATING THE RELATION BETWEEN DENTAL AGE
AND CHRONOLOGICAL AGE”
under our guidance and supervision in partial
fulfillment of the regulations laid down by the
Tamilnadu Dr.M.G.R.Medical
University
,Chennai-600032 for
M.D.S.,
(Branch-IX)
Oral Medicine and
Radiology
degree examination.
Seal & Signature of H.O.D Seal & Signature of Principal
DR.(CAPT).S.ELANGOVAN.,M.D.S Dr.G.S.KUMAR.,M.D.S.
ACKNOWLEDGEMENT
I am extremely grateful to my guide, Dr. Nazargi Mehabob M.D.S, Reader ,
Department of Oral Medicine and Radiology , KSR Institute of Dental Sciences and
Research, Tiruchengode for inspiring me to choose this topic. His meticulous guidance,
encouragement and eye for perfection, made my work easier and complete. His unending
belief in me was the key element which helped me to bring out the best in me.
I would most humbly like to thank my Head of the Department, Dr. (Capt)
S.Elangovan M.D.S., Professor , Department of Oral Medicine and Radiology , KSR
Institute of Dental Sciences and Research, Tiruchengode whose invaluable guidance have
instilled the confidence and determination in me to strive for my perfection.
I take this opportunity to express my humble gratitude to Dr.G.S.Kumar,
Principal, K.S.R. Institute of Dental Science and Research for his permission and
encouragement.
I want to express my deepest thanks to Dr.Suman M.D.S., Professor , Department
of Oral Medicine and Radiology , KSR Institute of Dental Sciences and Research, for her
tremendous help and guidance. Her constant supervision, motivation and support enabled me
to successfully complete my dissertation and realizing my goal in time. Her words can always
inspire me and bring me to a higher level of thinking.
It is my pleasure to express my deep thankfulness to Dr. Senthil Kumar M.D.S.,
Reader, Department of Department of Oral Medicine and Radiology , KSR Institute of
Dental Sciences and Research, for his motivation, encouragement and valuable advice at
times in need during the course of my work.
I thank Dr. Deepika Rajendran M.D.S., Senior Lecturer and Dr. Gomathi
M.D.S., Senior Lecturer,Department of Oral Medicine and Radiology , KSR Institute of
Dental Sciences and Research, for her support and encouragement.
Words are nothing but a medium to express my profound thanks to Dr.Sharmila
Shanmuganathan for their untiring stint of moral support, encouragement , and help.
My heartfelt appreciation to all my dear seniors, my juniors and colleagues for
their support during the period of my work.
I am thankful to Dr.Prakash M.D.S., Department of Community Dentistry,K.S.R.
Institute of Dental Science and Research,for the Biostatistics work.
I feel so blessed to have such a wonderful family and who make it a point to
remind me that I’m special to them. I owe a lot to my parents, my sister who encouraged
and helped me at every stage of my personal and academic life, and longed to see this
CONTENTS
S.NO
TITLE
PAGE NO.
1
INTRODUCTION
1
2
AIMS AND OBJECTIVES
7
3
REVIEW OF LITERATURE
9
4
MATERIALS AND METHODS
31
5
STATISTICAL ANALYSIS
45
6
RESULTS
47
7
DISCUSSION
73
8
SUMMARY AND CONCLUSION
80
9
BIBLIOGRAPHY
83
LIST OF FIGURES
S.NO
TITLE
PAGE NO
1
Digital Panoramic System :
SIRONA-ORTHOPHOS X G
39
2
Dental Radiograph Machine – Carestream Dental
40
3
Dental Intra Oral Xray Film
41
4
Dentsply Rinn Holder
41
5
Automatic Processor
42
6
Armamentarium for Tracing Radiograph
42
7
Tooth Length
43
8
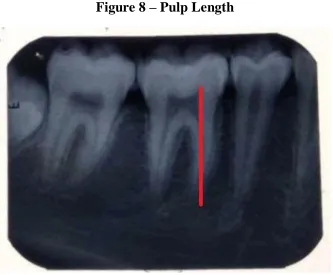
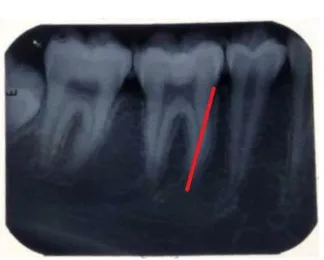
Pulp Length
43
9
Root Length
44
LIST OF TABLES
S.NO TITLE PAGE NO
1 DESCRIPTIONS OF STAGES OF TOOTH DEVELOPMENT OF
DEMIRJIAN ET AL., METHOD
36
2 DEVELOPMENTAL STATUS OF A PARTICULAR TOOTH BY
WILLEMS ET AL.,METHOD
38
3 DISTRIBUTION OF THE SUBJECTS BY THEIR AGE AND
GENDER
48
4 ILLUSTRATING THE RESULTS OBTAINED FROM KVAAL’S
METHOD (GROUP 1)
49
5 ILLUSTRATING THE RESULTS OBTAINED FROM KVAAL’S
METHOD (GROUP 2)
50
6 ILLUSTRATING THE RESULTS OBTAINED FROM KVAAL’S
METHOD (GROUP 3)
51
7 ILLUSTRATING THE RESULTS OBTAINED FROM KVAAL’S
METHOD (GROUP 4)
8 ILLUSTRATING THE RESULTS OBTAINED FROM KVAAL’S
METHOD (GROUP 5)
53
9
DEVELOPMENTAL STAGES OF EACH OF THE RIGHT
MANDIBULAR TEETH FOR GROUP I
54
10
DEVELOPMENTAL STAGES OF EACH OF THE
RIGHT MANDIBULAR TEETH FOR GROUP II
55
11
DEVELOPMENTAL STAGES OF EACH OF THE RIGHT
MANDIBULAR TEETH FOR GROUP III
56
12
DEVELOPMENTAL STAGES OF EACH OF THE RIGHT
MANDIBULAR TEETH FOR GROUP IV
57
13
DEVELOPMENTAL STAGES OF EACH OF THE RIGHT
MANDIBULAR TEETH FOR GROUP V
58
14
ILLUSTRATING THE RESULTS OBTAINED FROM WILLEM’S METHOD (GROUP 1)
59
15 ILLUSTRATING THE RESULTS OBTAINED FROM WILLEM’S METHOD (GROUP 2)
16
ILLUSTRATING THE RESULTS OBTAINED FROM WILLEM’S METHOD (GROUP 3)
61
17
ILLUSTRATING THE RESULTS OBTAINED FROM WILLEM’S METHOD (GROUP 4)
62
18
ILLUSTRATING THE RESULTS OBTAINED FROM WILLEM’S METHOD (GROUP 5)
63
19
MEAN AND SD OF DIFFERENT AGE ESTIMATION
METHODS OF DIFFERENT AGE GROUPS
64
20
DESCRIPTIVE STATISTICS OF TWO AGE ESTIMATION
METHODS
65
21
CONFIDENCE INTERVAL FOR DIFFERENT AGE
ESTIMATION METHODS
66
22
MEAN AGE OF DIFFERENT AGE ESTIMATION METHODS
BY GENDER
67
23
MEAN DIFFERENCES AND STANDARD ERROR
DIFFERENCES OF DIFFERENT AGE ESTIMATION METHODS
CHARTS
S.NO
TITLE
PAGE NO.
1
Distribution of the subjects by their age and
gender
69
2
Mean chronological age of different age groups
69
3
Mean estimated dental age of different age
groups by Willem’s method
70
4
Mean estimated dental age of different age
groups by Kvaal’s method
70
5
Mean estimated dental age of different age
groups by different age estimation methods
71
6
Mean age of males by different age estimation
methods
72
7
Mean age of males by different age estimation
methods
INTRODUCTION
Page 1
Personal identification is becoming increasingly important not only in legal medicine
but also in criminal investigation, identification and Genetic Research.1It is an important
basis for differentiating guilty from innocent in legal issues, for ethical issues and for
declaration of death reports and the basis for probing into criminal cases, mass disaster or
war victims.2
The mouth has been identified as the organ system “where it all begins.” Forensic
odontology, or forensic dentistry, was defined by Keiser- Neilson in 1970 as “a branch of
forensic medicine which in the interest of justice deals with the proper handling and
examination of dental evidence and with the proper evaluation and presentation of the dental
findings.”3
Dr. Oscar Amoedo was considered as the father of the forensic odontologist. The thesis
done by him entitled ‘L’ Art Dentaire en Medicine Leagale’ to the faculty of medicine earned
him a doctorate. This book is the first comprehensive text on forensic odontologist.4
The traditional methods of personal identification include anthropometry, finger prints,
sex determination, estimation of age, measurement of height, identification of a specific
individual, and differentiation by blood groups.5 The accurate estimation of age at the time of
death with the help of dental remains is an important parameter for identification. 2
Age plays an important role in various fields such as forensic science, various social
and legal settings and treatment planning in clinical dentistry.6 The age of a person can be
INTRODUCTION
Page 2
In 1889, Laccasagne was the first to use changes in the teeth of adults to estimate
age.8 Later, Bodecker, in 1925, pointed out that some morphological changes in teeth could
be related to increasing age.9
Literature reports different morphological and radiological techniques for age
assessment. Dental age estimation has gained acceptance because it is less variable when
compared to other skeletal and sexual maturity indicators.10 Examination of teeth in many
ways form a unique part of human body, as they are the most durable and resilient part of the
skeleton.11At times teeth are the only means of identification when the dead bodies have
under gone changes so extensive, that external characteristics yield little information.12
Adult teeth consists of enamel as the outermost covering of tooth crown and dentin
underneath, both of which are hard tissues resistant to decomposition, followed by pulp as
the innermost soft tissue core. Likewise cementum is the outermost covering for the surface
of root which is also resistant to decomposition. 2
Dental age (DA) determination is important because it is a useful tool to estimate the
CA of a child with an unknown birth date. Teeth are among the most reliable tools in the
process of identification of age, especially in the first and second decades. The stages of
development can be considered as one of the most dependable indicators in assessing the age
INTRODUCTION
Page 3
Dental Age Estimation Methods 14
Various methods are utilized for determination of age from dentition. Dental age assessment
methods may be classified as:
A. According to the state of development of the dentition:
Methods applied to the forming dentition
Methods for the adult fully formed dentition.
B. According to the technique of investigation:
Clinical or visual
Radiographic
Histological
Physical and chemical analysis
i. Clinical or visual method: Visual observation of the stage of eruption of the teeth and
evidence of changes due to function such as attrition can give an approximate estimate of
age.
ii. Radiographic method: Radiography can provide the gross stage of dental development of
INTRODUCTION
Page 4
iii. Histological method: Histological methods require the preparation of the tissues for
detailed microscopic examination, which can determine more accurately the stage of
development of the dentition. This technique is more appropriate for postmortem situations.
It is also significant in estimation of age of early development of dentition.
iv. Physical and chemical analysis: The physical and chemical analysis of dental hard
tissues to determine alterations in ion levels with age have been proposed. While these
techniques, as yet, are not of great value to the forensic odontologist, future developments
might provide an adjunctive means of collecting evidence of value in the dental context.
Age estimation using the dentition can be grouped into 3 phases(15-21)
1. Age estimation in prenatal, neonatal and early postnatal child
2. Age estimation in children and adolescents
INTRODUCTION
Page 5
1. Age estimation in prenatal, neonatal and early postnatal child
- Age assessment from the neonatal line
- Age assessment based on thickness of enamel and dentin from the neonatal line
-Age assessment from the incremental lines
-Age assessment from the weight of the development dentition
2. Age estimation of children and adolescents
-Age estimation using charts prepared from population surveys
-Age assessment by examination of the incremental pattern of tooth formation
-Third molars in age estimation
3. Estimation of age in adults
-Gustafson’s method
-Age estimation using color of the teeth
-Age estimation using fluorescence from dentine and cementum
-Age estimation in dental pulp DNA based on human telomere shortening
AIMS AND OBJECTIVES
Page 7
To determine dental age by radiographic methods in Digital Orthopantamograph using Willem’s method and in Intra oral periapical radiograph using Kwaal’s method
REVIEW OF LITERATURE
Page 9
Sigrid I.Kvaal et al (1995) 22 conducted study using 100 periapical radiographs which were
taken using paralleling technique and the samples were collected from clinics of dental
faculty in Oslo. The age ranging from 20-87 years were included in the study. Tooth / root
length, the pulp /root length, as well as the pulp/root width at three levels were calculated
from the radiographs of maxillary central and lateral incisors and second premolars, and
mandibular lateral incisors, canines and from first premolars by using Vernier calipers. All
five ratios had significant influence on age except the ratio between length of tooth and root.
The coefficient of determination (r2) for the regression was strongest when the ratios from all
six types of teeth from both jaws were employed.
Andrea G.Drusini et al (1997) 23 examined panoramic radiographs of 425 premolars and
421 molars to measure the coronal height and the height of coronal pulp cavity and 100 teeth
from 100 year old skeletons. For panoramic study,213 males and 220 females of known age
ranging from 9-76 years were included. Correlations were slightly higher in males than
females with an error of +5 years in 81.4% of cases. In historical sample, error of +5 years in
70.37% of cases of molars. It was found that this method can be applied to estimate the age
in both living individuals and skeletal material of unknown age.
Kolltveit and Solheim et al.(1998) 24 had conducted a study to compare the reliability of
manual measurements (vernier calipers using a stereomicroscope) with that of
REVIEW OF LITERATURE
Page 10
dental radiographs. Ratios calculated from the linear measurements of “tooth” by “pulp”
showed a weaker correlation with age when the image analysis program was employed than
did ratios based on conventional measurements (without image analysis) of the same. The
main source of errors in measurement seemed to be difficulties in recognition of the
reference points on the radiographs when viewed on the monitor, and therefore in defining
the line to be measured.
Sema Kedici P et al (2000) 25 obtained 20 measurements of different variables in incisor
teeth using a SEM micrometric scaler and the results were statistically correlated with age by
the multiple regression method. A formula was then derived from the calculations for age
estimation which gave statistically acceptable results. Gender differences were also
investigated and when separated delivered even stronger correlation.
Willems et al (2001)26 conducted a study was to evaluate the accuracy of Demirjian’s
dental age estimation in children in a Belgian Caucasian population and to adapt the scoring
system in case of a significant overestimation as frequently reported.2523
orthopantomograms of 1265 boys and 1258 girls, of which 2116 (1029 boys and 1087 girls)
were used for estimating the dental age with the Demirjian’s technique. The 407 other
orthopantomogram were beyond the original age limit. A second sample of 355
orthopantomograms was used to evaluate the accuracy of the original method and the
REVIEW OF LITERATURE
Page 11
between the obtained dental age and the chronological age. A weighted ANOVA was
performed in order to adapt the scoring system for this Belgian population. The
overestimation of the chronological age was confirmed. The adapted scoring system resulted
in new age scores expressed in years and in a higher accuracy compared to the original
method in Belgian Caucasians.
Martin-de las Heras et al (2002) 27 and coworkers, who have proposed the use of
spectroradiometry as an objective method for dentine color measurements for estimation of
age. Dentine color in 250 teeth from patients ranging in age from 10 to 89 years was
determined by spectroradiometry. Color measurements were performed as suggested in the
CIE 1931 (International Commission on Illumination). Chromaticity coordinates (x, y, z),
luminance (Y), whiteness index (WIC, Z%, WIC) and yellowness index (YI) were obtained.
Correlations between these colorimetric variables and aging were established by linear
regression analyses. All the variables fit the mathematical model with correlation coefficients
ranging from 0.53 to 0.75. This method of color measurement produced an expected
associated error of calibration averaging 13.7 years about the mean estimated values, at a
70% level of confidence. Two different multiple regression models for dental age estimation
were tested and variables that made the greatest contributions to age calculation were
REVIEW OF LITERATURE
Page 12
Tomoya Takasaki et al (2003) 28 conducted a study for the estimation of age based on
evidence found in teeth has received considerable attention within the field of forensic
science. They determined the terminal restriction fragment (TRF) length, as telomere length,
to estimate age. Using dental pulp DNA they found that the average TRF length showed a
tendency to shortening with aging. Their findings show that telomere shortening, based on
dental pulp DNA is a new and useful approach to estimate age of the subject at the time of
death.
Vandevoort F.M et al (2004) 29correlated the dental age with an individual’s chronological
age based on the calculated volume ratio of pulp versus tooth volume measured. An X-ray
micro focus computed tomography unit (μCT) with 25μm spatial resolution was used to
non-destructively scan 43 extracted single root teeth of 25 individuals with well-known
chronological age. Custom-made analysis software was used by two examiners to obtain
numerical values for pulpal and tooth volume. The ratio of both was calculated and
statistically processed. No significant intra- or inter-examiner differences were found.
Wittwer-Backofen et al (2004) 30 conducted a study using tooth cementum annulations
(TCA) technique for estimating a subject’s age from cementum annulations. Indicators like
sex differences, intra individual correlations, and the effects of periodontal disease did not
have a quantitative effect on the number of TCA bands. A major disadvantage of the above
methods of estimating age in adults is the necessity to extract and/or section the teeth. While
REVIEW OF LITERATURE
Page 13
Paewinsky et al (2005) 31 analysed panoramic radiographs of 168 patients aged between 14
to 81 years. Pulp/root length, pulp/tooth length and pulp/root width at three different root
levels were calculated in one of mandibular lateral incisors, canines and first premolars and
maxillary central and lateral incisors and second premolars. The width ratios of the pulp
cavity showed significant correlation to the chronological age and the coefficient of
determination(r2) was highest in the upper lateral incisors
Nathalie Bosmans et al (2005) 32 applied Kvaal’s dental age calculation technique on one
hundred and ninety panoramic dental radiographs with the age group ranged from 19 to 75
years. There was no significant difference between long cone periapical technique and
orthopantomographs when all six teeth were selected to predict the age.
Roberto Cameriere et al (2006) 33 in a study to estimate the age from 33 skeletal remains by
using radiograph of canines. This method showed great reliability to estimate the age of old
subjects who died over 50 years.
Balwant Rai et al (2006)34 examined panoramic radiographs of 75 healthy children (40 boys
and 35 girls) aged between 5-14 years. Demirjian, Nolla, Haavikko, Williams and Cameriere
methods were applied for estimation of age. The result of our study have shown that
Williams method is more accurate followed by Haavikko, Cameriere, Nolla and lastly
REVIEW OF LITERATURE
Page 14
Kagerer et al (2000)35 suggested the possibility of age estimation from acellular cementum
incremental lines.This made use of mineralized, unstained cross-sections of teeth, preferably
mandibular central incisors and third molars. The authors claimed an accuracy of within two
to three years of the actual chronologic age. However, the pathologic state of the
periodontium and/or desmodontium may compromise the precision of ageing.
Sasidhar Singaraju et al (2009)36 conducted a retrospective study using two hundred
panoramic radiographs which were collected from V.S Dental College. Maximum tooth
length, root length and pulp length, root and pulp width at three levels were calculated on
right maxillary canine. The entire samples were divided into three groups and multiple
regression models were calculated. There was no significant difference between
chronological and estimated age. The observed correlation coefficients were 0.89,0.97 and
0.96.All three groups results were closely related to each other and it was found to be fairly
accurate.
Olze et al (2010) 37 determined determined the stages of third molar eruption in 347 female
and 258 male First Nations people of Canada aged 11 to 29 years based on radiological
evidence from 605 conventional orthopantomograms. The results presented here provide data
on the age of alveolar, gingival, and complete eruption of the third molars in the occlusal
plane that can be used for forensic estimation of the minimum and most probable ages of
REVIEW OF LITERATURE
Page 15
Medha Babshet et al (2010) 38 used Italian formula to estimate the age of Indian population
aged between 20-70years by using intraoral periapical digital radiographs of mandibular
canines which were taken by using paralleling technique. Mean absolute error was 11.58
years and 10.76 years for Italian and Indian formula respectively. No apparent difference was
observed between these two formulas.
Jayaraman et al (2011) 39 validated the applicability of Demirjian’s dataset on a southern
Chinese population. A total of 182 dental panoramic tomographs comprising an equal
number of boys and girls with an age range from 3 to 16 years were scored. Dental maturity
scores were obtained from the Demirjian’s dataset and dental age was calculated. The
difference in chronological and estimated dental ages was calculated using the paired t-test.
There was a mean overestimation of dental age of 0.62 years for boys (p<0.01) and 0.36
years for girls (p<0.01). He concluded that Demirjian’s dataset is not suitable for estimating
the age of 3-16 years old southern Chinese children.
Sudhanshu Saxena et al (2011) 40 developed a method for estimating the chronological age
of Indian adults based on morphologic variables of canine teeth from 120
orthopantomographs. Pulp/tooth area ratio, pulp/root length ratio, pulp/root width at the
cement-enamel junction level, pulp/root width ratio at mid root level, and pulp/root width
ratio at the midpoint between the cement-enamel junction and the mid root of the canine
were calculated. The estimated age in the total sample ranged from -2.2 to 1.5 years. No
REVIEW OF LITERATURE
Page 16
Jagannathan et al (2011)41 evaluated the suitability of pulp/tooth volume ratio of
mandibular canines for age prediction in an Indian population using Volumetric
reconstruction of scanned images of mandibular canines of 140 individuals, age groups
ranging between 10 – 70 years. While using the Belgian formula for Indian population, the
mean absolute errors of 15.34 years, and 8.54 years error was obtained by regression
equation which was lower than those derived from former. Hence, they stated that specific
formula has to be applied to estimate the age of each population.
Jayanth Kumar et al (2011)42 evaluated the reliability of age estimation using Demirjian's
8 teeth method following the French maturity scores and India specific formula.The study
was conducted on 121 archived digital orthopantamographs which were predominantly
pre-treatment orthodontic radiographs from patients without any obvious developmental
anomalies The radiographs were evaluated as per Demirjian's criteria and age was calculated
using the formula developed for the Indian population.The results showed that the mean
absolute error for the study sample was 1.18 years; in 57.9% of cases the error rate was
within ±1 year. The age estimation using this method narrows down the error rate to just over
one year making this method reliable. However the inclusion of third molar increases the
error rates in the older individuals within the sample.
Chandramala et al (2012)43 concluded a study included 100 subjects of either sex between
age group of 20 and 80 years for assessment of age out of which 56 were males and 44 were
REVIEW OF LITERATURE
Page 17
years for females. Correlation and regression analysis were carried out. From the results of
regression analysis, it was observed that the coefficient of determination R2 is highest
(0.385) for “Upper second premolar” indicating that age can be estimated better with this
particular tooth when “M” and “W-L” are considered as predictors of age. Both “M” and
“W-L” were found to be significant predictors.
Nithin Agarwal et al (2012)44 conducted a study to assess the chronological age based on
morphological variance of maxillary central incisors. Intra oral periapical radiographs were
taken using paralleling technique from fifty subjects aged between 20-70 years. Length of
tooth,pulp,root and width of root and pulp at three different points were measured.
Regression formulas were used to predict the age and it was found to be fairly accurate.
Bilge Nur et al (2012) 45 evaluated the applicability of Demirjian and Nolla methods for
northeastern Turkish population which was performed on panoramic radiographs of 673
subjects aged 5–15.9 years. The mean dental age (DA) according to the Demirjian and Nolla
methods were compared to the mean chronological age (CA). The mean CA of the study
sample was 10.37±2.90 and 10.03±2.81 years for females and males, respectively. Using the
Demirjian method, the mean estimated DA was 11.26±3.02 years for females and 10.87±2.96
years for males. For Nolla method, the mean estimated DA was 9.80±3.41 and 9.53±3.14
years for females and males, respectively. The mean differences between the CA and DA
REVIEW OF LITERATURE
Page 18
sample. Nolla method was found to be a more accurate method for estimating DA in
northeastern Turkish population.
Erbudak et al (2012) 46 examined the correlation between chronological and estimated ages
and evaluated the feasibility of length and width measurements of pulp cavity for age
estimation. The study population consisted of 123 patients with ages ranging from 14 to 57
years. The measurements of the length and width of six types of teeth on digitized panoramic
radiographs were performed, and the ratios between tooth and pulp cavity measurements
were calculated. Age was estimated using the linear regression models presented by Kvaal et
al. and Paewinsky et al. High differences were observed between chronological and
estimated ages. In conclusion, a difference of more than 12 years in the chronological and
estimated ages derived using regression models in literature was found on panoramic
radiographs in Turkish individuals.
Deepu George Mathew et al (2013)47 conducted a study to develop an independent method
to estimate the age of Indian individuals using mandibular posterior teeth in
orthopantomographs. Eighty eight subjects were included in the study and test subsets.
Adobe photoshop CS5 was used to measure the distance between central fossa to the highest
point on the root furcation and another point was the distance between the roof and floor of
the pulp chamber. The ratio derived between these two measurements was used to estimate
the age.R2 value was fairly good and this procedure was found to be fairly accurate to predict
REVIEW OF LITERATURE
Page 19
Djukic K et al (2013) 48 conducted a study that evaluated the accuracy of Demirjian's and
Willems' methods for dental age estimation in Serbian children population using panoramic
radiographs of 686 children (322 boys and 364 girls) with age range from 4 to 15 years. Both
methods showed discrepancy between obtained and chronological age. The Demirjian's
method overestimated age with a mean accuracy of 0.45 in boys and 0.42 in girls, while
Willems' method showed lower discrepancy (0.12 and 0.16 in boys and girls, respectively).
They suggested that Willem's method was more accurate for estimating dental age in
contemporary Serbian children population.
Sarkar S et al (2013) 49evaluated age in children, adolescents and young adults using
Demirjian's 8-Teeth Method in an Indian population and compared the effectiveness of
existing Demirjian's formula with that of the Indian formula. Among the 100 samples the
mean chronological age in 50 males was 13.44 years and mean chronological age in 50
females was 13.12 years. It was evaluated that the Demirjian's formula underestimated the
mean dental age by 1.63 years in males and by 1.54 years in females, whereas a variation of
0.10 years in male and 0.94 years in female was found with the Indian formula. The mean
dental age obtained using Indian formula was approximating with the chronological age in
the male and female by a margin of 0.94 years. They concluded that Acharya's Indian
formula was more effective in evaluating the dental age closer to the chronological age of an
REVIEW OF LITERATURE
Page 20
Ambarkova et al (2013)50 analyzed panoramic radiographs of 966 children (485 female and
481 male, aged 6–13 years) treated at the University and Community Dental Clinics in
Skopje using four Demirjian methods and a Willems method for determining dental ages.
Intra-rater and interrater agreement of mineralization stages were 0.86 and 0.82, respectively.
All methods significantly overestimated dental age when compared to the chronological age
(p < 0.001).
Limdiwala et al (2013)51 conducted a study using one hundred orthopantomographs with
Kvaal's criteria (Group A) and 50 orthopantomographs without Kvaal's criteria (Group B)
were included. On the basis of Kvaal's criteria, the difference between chronological age and
real age was 8.3 years. This suggests that the accuracy of this method depends on the
precision of measurements and quality and number of the orthopantomographs.
Mahkameh Moshfeghi et al (2014)52 conducted a study using 112 panoramic radiographs of
Iranian patients, to measure the amount of secondary dentin deposition o find out the age of
individuals. Patients aged between 20-70 years were included in the study. Then the
population was divided into two groups, study and test group respectively. Ratios of
pulp/root length, pulp/tooth length and pulp width /root width at three levels in lateral incisor,
canine and first premolar of mandible were calculated using Photoshop 2007.They conducted
REVIEW OF LITERATURE
Page 21
Caroline Edward Ayad (2014)53 examined 99 Orthopantomgraphs (OPG) to determine its
usefulness of Orthopantomgraphs (OPGs) in the assessment of the Sudanese adult age
compared to chronological age. The pulp root length ,root length, pulp/root ratio , total tooth
length ,crown length of the mandibular canine were measured in mm and the estimated age
was recorded using the mandibular canine measurements .Patients were classified into three
groups ,A was of age <20 years old ,B was of 20 to 27 and C was of age >27. The estimated
age in A and C groups were well correlated with the chronological age in both genders and
no significant difference was detected, but in B group there is a significant difference
between the estimated and chronological age and between males and females measurements.
Mostafa M Afify et al (2014) 54assessed the applicability of pulp tooth ratio of mandibular
canine, first and second premolars in orthopantomographs to estimate the age of an
individual. Total of 500 radiographs were included in the study, aged between 18 to 71 years.
Regression equation was closely correlated with age and standard errors of estimate was
ranged between 4.10 to 5.66 years. So, pulp-tooth ratio method was useful to estimate the age
of individuals.
Aída C. Medina et al (2014) 55 examined panoramic radiographs of 238 Venezuelan
children aged 5-13 years for assessment of dental age using the methods described by
Demirjian and Willem. For the Demirjian method, the mean difference between dental age
and chronological age was 0.62 ± 0.93 years, statistically significant. The mean overestimation was lower for females than for males (females 0.56 ± 0.96 years, males 0.67
REVIEW OF LITERATURE
Page 22
chronological age was 0.15 ± 0.97 years, not statistically significant. Accuracy was significantly different between genders, performing best for females (females 0.01± 0.96 years, males 0.29± 0.96 years). The Willems method for age estimation was found to be more accurate than the Demirjian method in this sample of Venezuelan children.
Ioannis N.Tsatsoulis et al (2014)56 investigated the effects of age and external irritating
stimuli on the thickness and morphology of pulp chamber floor and ceiling in mandibular
molars. A total of 234 panoramic radiographs were obtained from School of Dentistry,
University of Athens. They calculated pulp chambers ceiling /crown height and pulp
chamber floor/crown height in relation to age and angle of pulp chamber ceiling and floor in
relation to age. There was significant difference in the location of secondary dentin formation
between the two pulp chamber walls. They concluded that increase in the rate of the pulp
chamber ceiling thickness is similar to that of the pulp chamber floor thickness. Age is
related to diminished pulp chamber size. They stated that the external stimuli also have an
effect on the pulp chamber dimensional changes.
Manjushree Juneja et al (2014) 57 conducted a study using panoramic radiographs to
estimate the age of 200 population with the age group of 18-72 years. Radiographic images
of maxillary canines (RIC) were processed using a computer –aided drafting program.
Following variables were recorded namely, pulp/root length, pulp/tooth length, pulp/root
width at enamel-cementum junction level, pulp/root width at mid-root level, pulp/root width
REVIEW OF LITERATURE
Page 23
these variables, the mid-root level and pulp/tooth area ratio showed strong correlation
coefficient and the estimated error was 3.012 years. They concluded that there was
significant correlation between age and morphological variables of canine.
Rezwana Begum Mohammed et al (2014)58 assessed the developmental stages of left
seven mandibular teeth for estimation of dental age (DA) in different age groups and to
evaluate the possible correlation between DA and chronological age (CA) in South Indian
population using Willems method. Digital Orthopantomogram of 332 subjects (166 males,
166 females) who fit the study and the criteria were obtained. Assessment of mandibular
teeth (from central incisor to the second molar on left quadrant) development was undertaken
and DA was assessed using Willems method. The present study showed a significant
correlation between DA and CA in both males (r = 0.71 and females (r = 0.88). The overall
mean difference between the estimated DA and CA for males was 0.69 ± 2.14 years (P <
0.001) while for females, it was 0.08 ± 1.34 years (P > 0.05). Willems method
underestimated the mean age of males by 0.69 years and females by 0.08 years and showed
that females mature earlier than males in selected population. The mean difference between
DA and CA according to Willems method was 0.39 years and is statistically significant (P <
REVIEW OF LITERATURE
Page 24
Jurca et al (2014) 59 conducted on X-rays of 285 children aged between 6-13 years. Dental
age was determined based on the degree of mineralisation of the seven left mandibular teeth,
and t-tests were used to assess the difference between dental age and chronological age
within each age category. Dental age was more advanced in girls in almost all age groups,
whereas in boys just the 6-7 and 8-9 age groups presented a more advanced dental age. The
results of the study showed that Demirjian’s method has some limitations for a Romanian
population, and that these standards are applicable only in certain age groups.
Patil et al (2014) 60conducted a study which evaluating the accuracy of age estimation
formula of Kvaal and coauthors developed for Norwegian population. 100 subjects between
the age group 20 and 50 years digitized intraoral periapical (IOPA) radiograph of maxillary
central incisors was taken and length and width of the teeth were measured and their ratios
were calculated and applied to Kvaal and coauthors formula. The estimated age and
chronological age were compared, less accurate results were found in sample Indian
population. Modified Kvaal’s formula was then developed by using regression analysis of the
ratios and to evaluate the accuracy of this formula, the study was repeated using same criteria
and methodology on another subjects (101-200).Using Kvaal’s formula standard error of
estimated age was more in sample Indian population when compared with Norwegian
population. Then modified Kvaal’s formula was developed and applied to sample Indian
population, which showed accurate results. This study concluded that formula which was
REVIEW OF LITERATURE
Page 25
Javadinejad et al (2015)61 conducted a study to compare the accuracy of four radiographic
age estimation methods. Orthopantomographic images of 537 healthy children (age: 3.9-14.5
years old) were evaluated. Dental age of the subjects was determined through Demirjian’s,
Willem’s, Cameriere’s, and Smith’s methods. The mean chronological age of the subjects
was 8.93 ± 2.04 years. Overestimations of age were observed follow-ing the use of
Demirjian’s method (0.87 ± 1.00 years), Willem’s method (0.36 ± 0.87 years), and Smith’s
method (0.06 ± 0.63 years). However, Cameriere’s method underestimated age by 0.19 ±
0.86 years. While paired t-tests revealed significant differences between the mean
chronological age and ages determined by Demirjian’s, Willem’s, and Cameriere’s methods
(P < 0.001), such a significant difference was absent between chronological age and dental
age based on Smith’s method (P = 0.079). Pearson’s correlation analysis suggested linear
correlations between chronological age and dental age determined by all four methods.
Kiran et al (2015)62 conducted a study to evaluate the applicability of Demirjian method and
its comparison with Indian formulas for estimation of dental age in subjects attending a
dental school in South India. A total of 250 individuals (130 males and 120 females) between
7 and 18 years, with orthopantamographs were included in the study. Dental age was
estimated using Demirjian’s and Indian formulas. The mean chronological age of the study
sample was 12.39 ± 3.32 years; while the mean age obtained from Demirjian’s method and
REVIEW OF LITERATURE
Page 26
years in males and 0.83 years in females (P < 0.05). Indian‑specific regression formulas overestimated dental age by 1.72 years in males and 1.91 years in females (P < 0.05).
Ekta Priya et al (2015) 63 conducted a pilot study to test the applicability of Willem’s
method of dental age assessment at the threshold of 14 years considering prohibition of
employment of children. The sample consisted of 30 males and 30 females. The dental age
estimation was performed by two blinded examiners using Willem’s method. It was seen that
there was underestimation of age in both males and females. The difference in females and
males were -0.29 years and -0.23 years respectively. The scores of dental maturation
described by Willems may be suitable for South Indian children.
Gupta S et al (2015)64 assessed the applicability and compared the methods of dental age
estimation by Demirjian's method and the same method as modified by Willems in Indian
children of the National Capital Region (NCR).The study was conducted using dental
radiographs of 70 orthodontic patients (37 males, 33 females) in the age range 9-16 years
selected by simple random sampling. Orthopantomogram were used to estimate dental age by
Demirjian's method and the Willems method using their scoring tables. Lateral cephalograms
were used to estimate skeletal maturity using CVMI. The latter was compared with
Demirjian's stage for mandibular left second molar.and concluded that Willems method have
proved to be more accurate for age estimation among Indian males, and Demirjian's method
for Indian females. A statistically significant association appeared between Demirjian's
REVIEW OF LITERATURE
Page 27
Lee SS et al (2011) 65 evaluated validity of Demirjian's and the modified methods in Korean
juveniles and adolescents using 1483 digital orthopantomograms which consist of 754 males
and 729 females in the age range of 3-16 years were collected. New age estimation method
based on Korean population data was calculated. Willems' method was found to be most
accurate followed by new Korean method with slight difference for Korean population for
both sexes and concluded that both Willems' method and new Korean method conducted by
present study were proven to be suitable for Korean population.
Uday Ginjupally et al (2015)66 designed a study to estimate the age of 200 intra oral
periapical radiographs of maxillary incisors. Pulp cavity width is measured at cervical and
middle third of maxillary incisors using digital Vernier caliper. Regression formulas were
derived for males and 0.21 years in females. Hence, there was difference between male and
female regarding age prediction.
El Morsi DA et al (2015)67 conducted a study to estimate the age from tooth coronal index
of mandibular premolars and molars of both sides using panoramic radiographs of known
age. Study included 234 Egyptian subjects of known age. The length of tooth crown and that
of coronal pulp cavity were measured in 845 mandibular premolars and 835 mandibular
molars.TCI for premolars was larger than those of molars and it was higher in males than
females. It was concluded that there was highest significant correlation of the second right
REVIEW OF LITERATURE
Page 28
Indira AP et al (2015)68 conducted a study using 100 intra oral periapical radiographs of
both genders aged between 16 and 50 years. The tooth selected for the study was left
maxillary central incisor. The ratio between total pulp length and cervical pulp width was
calculated. There was negative correlation between the age and the variable. Hence, this
study estimated the nearest chronological age of an individual.
Ranjdar M.Talabani et al(2015)69 analysed permanent mandibular first molar on digital
panoramic radiographs of sulaimani population. This study included 96 individuals who were
divided into four groups. The height of coronal pulp cavity and the height of crown of first
molars from all subjects were measured and a regression equation was calculated. There was
a strong negative linear relationship between morphology of mandibular first molars with
chronological age. So, they concluded that study showed a good degree of accuracy in
predicting age.
Smrithi D Veera et al (2015)70 conducted a study using 100panoramic radiographs and the
subjects aged between 20-60 years. Mandibular permanent second premolar and first molar
tooth coronal index was measured. Regression equation was created. There was no difference
REVIEW OF LITERATURE
Page 29
Nerella Narendra Kumar et al (2016)71 estimated the age of Davangere population by
measuring the pulp tooth area ratio using digitized intaoral periapical radiographs of
permanent mandibular second molar. Study subjects aged between 14-60 years of both
MATERIALS AND METHODS
Page 31
SOURCE OF DATA
The present study was conducted in K.S.R Institute of Dental Science and Research,
Tiruchengode. Those who referred to the oral medicine and radiology department for the
purpose to undergo orthodontic treatment, will be selected randomly for the study were taken
up for the study. Orthopantmographs taken for orthodontic treatment purpose were retrived
from the data and One Intra oral periapical radiograph were taken for the same patient for
this study purpose.
INCLUSION CRITERIA
Above the age of 8 years
Only fully erupted mandibular first molar in normal functional occlusion
Those who give voluntary consent for the study procedure
Absence of systemic diseases, dental anomalies, nutritional and endocrine problems,
premature birth, and birth defect
EXCLUSION CRITERIA
Teeth with radio-opaque fillings
Crowns/prosthesis
Any associated pathologies
Malalignment, rotation
MATERIALS AND METHODS
Page 32 Teeth with developmental anomalies
Attrited teeth
MATERIALS USED:
WILLEMS METHOD:
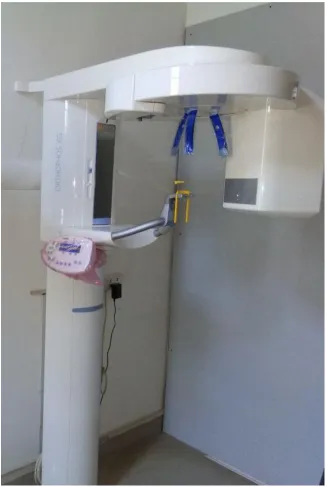
Digital Panoramic System:SIRONA-ORTHOPHOS XG
Computer : Acer 15.6”HD LED LCD
Image Editing Software ; Adobe Photoshop CS-6
KVAAL’S METHOD:
Dental Radiograph Machine : Confident Dental Equipments
Dental Intra Oral Xray film : Carestream Dental E-speed size 2
Fim holder : Dentsply Rinn holder
Automated processor unit : Velprex Extra-X
Dryer
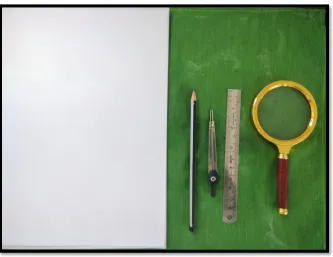
Tracing sheet
Apsara plantinum pencil
Magnifying glass
Divider
MATERIALS AND METHODS
Page 33
METHODOLOGY
Patients who referred to the oral medicine and radiology department for the purpose
to undergo orthodontic treatment were selected randomly for the study. Informed consent
was obtained prior to the investigatory procedure. Orthopantmographs was taken for
orthodontic treatment purpose and One Intra oral periapical radiograph in relation to right
mandibular first molar by using paralleling cone technique were taken for the same patient
for this study purpose. The study sample consisted of 75 randomly selected subjects ( males
and females) of age ranging from 8 to years divided into five groups according to age.
Clinical examination of all 75 individuals was performed and name, sex, and date of birth of
each individual and date of radiography were recorded. CA of an individual was calculated
by subtracting the birth date from the date on which the radiographs were exposed for that
particular individual. The dental age was determined using orthopantamographs by Willem’s
method and using Intra oral periapical radiograph by Kvaal’s method.
Willem’s method :
The panoramic images were obtained in the Digital Imaging and Communication in
Medicine (DICOM) format, were saved as DICOM files on a computer and were analysed by
using the Adobe Photoshop CS6 image editing program. With the help of Photoshop
generator, the images were enlarged and adjusted with the brightness/contrast, if needed. The
obtained panoramic images were used to assess the status of maturation on the basis of
calcification of the permanent teeth in mandibular right side, from central incisor to the
second molar, using Demirjian et al., method(Table 1).After noting all stages of teeth from
MATERIALS AND METHODS
Page 34
calculated in years on the basis of tables given by Willems et al,.(Table 2). All the values
from central incisor to the second molar thus obtained were summed to obtain an overall
maturity score, which will indicate the DA of that particular patient.
Kvaal’s method :
Intra-oral periapical radiographs of right mandibular first molar were taken by using
paralleling cone technique. The exposed films were developed in automatic processor in
fresh solutions. The developed X-ray films were dried and subsequently coded. Intra oral
periapical radiographs are traced on tracing sheet. On the radiographs obtained, 15
standardized points were marked, on the basis of the original method for dental age
calculation published by Kvaal et al., and measurements were taken using divider and scale
with millimeter calibrations.
• Tooth length (T)
• Pulp length (P)
• Root length (R)
• Ratio of Pulp width to Root width
• A: Cemento-Enamel Junction
• B: Midpoint between A and C
• C: Midroot level
The ratios calculated were:
P - Pulp length/root length
R - Pulp length/tooth length.
Ratios of the pulp/root width at three different levels:
MATERIALS AND METHODS
Page 35
At the midpoint between ECJ and mid root level (B)
At the mid root level (C)
The obtained values were applied to the formula developed to estimate the age from right
mandibular first molar given by Kvaal and coauthors.
Age = 33.5 – 18.6 (M) – 3.49 (W − L)
M = 𝑃+𝑅+𝐴+𝐵+𝐶
5
W =𝐵+𝐶
2
L= 𝑃+𝑅
2
W = Mean value of width ratios from level B and C
L = Mean value of length ratios P and R
W − L = Differences between W and L
The estimated age was compared with the chronological age recorded and the efficacy of the
MATERIALS AND METHODS
[image:50.612.63.532.97.704.2]Page 36
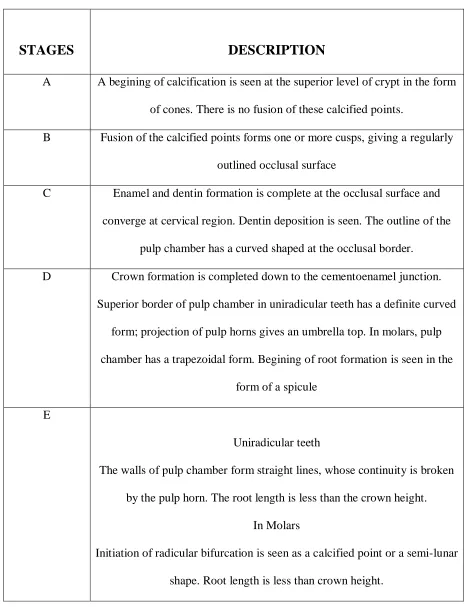
Table I :Description for developmental stages of tooth
STAGES
DESCRIPTION
A A begining of calcification is seen at the superior level of crypt in the form
of cones. There is no fusion of these calcified points.
B Fusion of the calcified points forms one or more cusps, giving a regularly
outlined occlusal surface
C Enamel and dentin formation is complete at the occlusal surface and
converge at cervical region. Dentin deposition is seen. The outline of the
pulp chamber has a curved shaped at the occlusal border.
D Crown formation is completed down to the cementoenamel junction.
Superior border of pulp chamber in uniradicular teeth has a definite curved
form; projection of pulp horns gives an umbrella top. In molars, pulp
chamber has a trapezoidal form. Begining of root formation is seen in the
form of a spicule
E
Uniradicular teeth
The walls of pulp chamber form straight lines, whose continuity is broken
by the pulp horn. The root length is less than the crown height.
In Molars
Initiation of radicular bifurcation is seen as a calcified point or a semi-lunar
MATERIALS AND METHODS
Page 37
F Uniradicular teeth
The walls of pulp chamber form isosceles triangle. Apex ends in a funnel
shaped. The root length is equal to or greater than the crown height.
In molars
The bifurcation has developed down to give the roots a distant outline with
funnel shaped endings. Root length is equal to or greater than crown
height.
G The walls of root canal are now parallel and its apical end is partially
open(distal root in molars)
H The apical end of the root canal is completely closed. Periodontal
MATERIALS AND METHODS
[image:52.612.61.541.97.659.2]Page 38
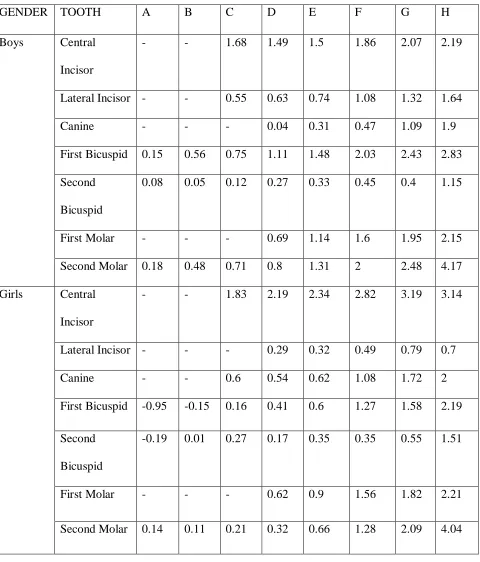
Table 2 : Developmental status of a particular tooth by Willems et al.,
GENDER TOOTH A B C D E F G H
Boys Central
Incisor
- - 1.68 1.49 1.5 1.86 2.07 2.19
Lateral Incisor - - 0.55 0.63 0.74 1.08 1.32 1.64
Canine - - - 0.04 0.31 0.47 1.09 1.9
First Bicuspid 0.15 0.56 0.75 1.11 1.48 2.03 2.43 2.83
Second
Bicuspid
0.08 0.05 0.12 0.27 0.33 0.45 0.4 1.15
First Molar - - - 0.69 1.14 1.6 1.95 2.15
Second Molar 0.18 0.48 0.71 0.8 1.31 2 2.48 4.17
Girls Central
Incisor
- - 1.83 2.19 2.34 2.82 3.19 3.14
Lateral Incisor - - - 0.29 0.32 0.49 0.79 0.7
Canine - - 0.6 0.54 0.62 1.08 1.72 2
First Bicuspid -0.95 -0.15 0.16 0.41 0.6 1.27 1.58 2.19
Second
Bicuspid
-0.19 0.01 0.27 0.17 0.35 0.35 0.55 1.51
First Molar - - - 0.62 0.9 1.56 1.82 2.21
MATERIALS AND METHODS
[image:53.612.153.480.127.614.2]MATERIALS AND METHODS
[image:54.612.131.467.156.645.2]MATERIALS AND METHODS
[image:55.612.199.428.159.384.2]Page 41
Figure 3 – Dental Intra Oral Xray Film
MATERIALS AND METHODS
[image:56.612.131.462.100.344.2]Page 42
Figure 5 – Automatic Processor
[image:56.612.130.463.413.670.2]MATERIALS AND METHODS
[image:57.612.152.480.128.387.2]Page 43
Figure 7-Tooth Length
[image:57.612.150.483.427.702.2]MATERIALS AND METHODS
Page 44
[image:58.612.138.462.111.371.2]Figure 9 – Root Length
STATISTICAL ANALYSIS
Page 45
STATISTICAL ANALYSIS
The data obtained from the study was entered in Microsoft Excel and was given
for statistical analysis. The data was analysed using Statistical Package for Social
Sciences(SPSS) software version 16.0(Windows version 17.0 SPSS
Inc.,Chicago,IL,USA).The level of significance (α) was fixed at 5% (p≤0.05).
PAIRED t TEST :
Student’s t test was used to analyze the significance between the two different age
estimation methods. Paired t test is applied when there is a pair of data from single element in
an observation .Data are collected by two different methods for a same person, so that the
same group participated in both the methods. Then the mean of both the groups are compared
RESULTS
Page 47
Descriptive analysis
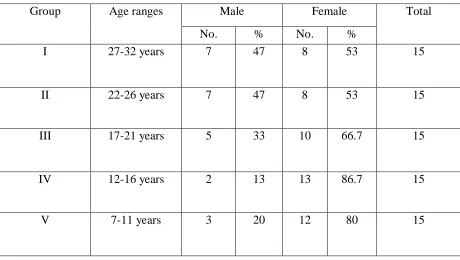
The study comprises of 24 males and 51 females of age ranging from 7-32 years. The
subjects were divided into five groups ,where 7 males and 8 females of age ranging from
27-32 years were in group I, 7 males and 8 females of age ranging from 22-26 years were in
group II, 5 males and 10 females of age ranging from 17-21 years were in group III, 2 males
and 13 females of age ranging from 12-16 years were in group IV ,3 males and 12 females of
RESULTS
[image:63.612.67.527.122.382.2]Page 48
Table III : Distribution of the subjects by their age and gender
Group Age ranges Male Female Total
No. % No. %
I 27-32 years 7 47 8 53 15
II 22-26 years 7 47 8 53 15
III 17-21 years 5 33 10 66.7 15
IV 12-16 years 2 13 13 86.7 15
RESULTS
[image:64.612.87.588.113.657.2]Page 49
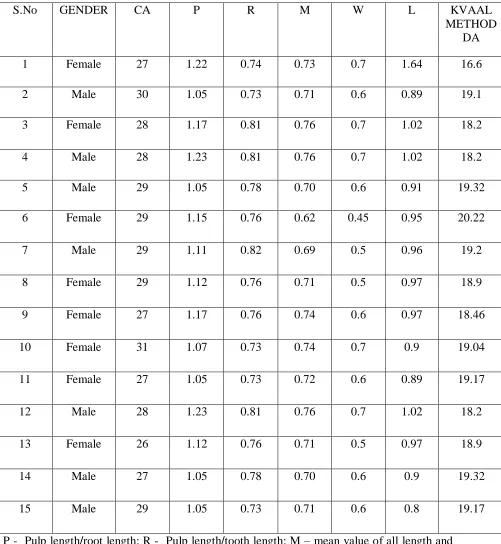
Table IV : ILLUSTRATING THE RESULTS OBTAINED FROM KVAAL’S METHOD (GROUP 1)
S.No GENDER CA P R M W L KVAAL METHOD
DA
1 Female 27 1.22 0.74 0.73 0.7 1.64 16.6
2 Male 30 1.05 0.73 0.71 0.6 0.89 19.1
3 Female 28 1.17 0.81 0.76 0.7 1.02 18.2
4 Male 28 1.23 0.81 0.76 0.7 1.02 18.2
5 Male 29 1.05 0.78 0.70 0.6 0.91 19.32
6 Female 29 1.15 0.76 0.62 0.45 0.95 20.22
7 Male 29 1.11 0.82 0.69 0.5 0.96 19.2
8 Female 29 1.12 0.76 0.71 0.5 0.97 18.9
9 Female 27 1.17 0.76 0.74 0.6 0.97 18.46
10 Female 31 1.07 0.73 0.74 0.7 0.9 19.04
11 Female 27 1.05 0.73 0.72 0.6 0.89 19.17
12 Male 28 1.23 0.81 0.76 0.7 1.02 18.2
13 Female 26 1.12 0.76 0.71 0.5 0.97 18.9
14 Male 27 1.05 0.78 0.70 0.6 0.9 19.32
15 Male 29 1.05 0.73 0.71 0.6 0.8 19.17
P - Pulp length/root length; R - Pulp length/tooth length; M – mean value of all length and width; W - Mean value of width ratios from level B and C;L -Mean value of length ratios P
RESULTS
Page 50
Table V: ILLUSTRATING THE RESULTS OBTAINED FROM KVAAL’S METHOD
(GROUP 2)
S.No GENDER CA P/L R/L M W L KVAAL METHOD DA
1 Female 20 1.4 0.76 0.77 0.6 1.08 20.85
2 Female 20 1.13 0.68 1.45 0.4 1.95 11.08
3 Female 20 1.14 0.64 1.32 0.55 1.9 13.71
4 Female 20 1.07 0.65 0.64 0.5 0.86 22.9
5 Male 20 1.12 0.69 0.7 0.61 0.91 21.5
6 Female 19 0.88 0.66 0.6 0.55 0.77 22.7
7 Female 21 1.21 0.63 0.71 0.65 0.92 21.24
8 Female 23 1.15 0.75 0.73 0.61 0.95 21.11
9 Male 21 1.13 0.77 0.69 0.55 0.95 22.09
10 Male 22 1.18 0.8 0.7 0.5 0.99 22.2
11 Male 22 1.14 0.77 0.7 0.77 0.95 18.37
12 Male 22 1.28 0.09 0.63 0.7 0.69 21.79
13 Male 22 1.14 0.8 0.66 0.5 0.97 19.6
14 Female 22 1.16 0.82 0.72 0.5 0.99 18.47
15 Male 21 1.16 0.77 0.71 0.6 0.97 19.09
P - Pulp length/root length; R - Pulp length/tooth length; M – mean value of all length and width; W - Mean value of width ratios from level B and C;L -Mean value of length ratios P
RESULTS
Page 51
Table VI : ILLUSTRATING THE RESULTS OBTAINED FROM KVAAL’S METHOD
(GROUP 3)
S.No GENDER CA P/L R/L M W L KVAAL METHOD DA
1 Male 18 1.125 0.66 0.75 0.68 0.9 20.31
2 Female 18 1.14 0.63 0.66 0.62 0.88 22
3 Female 20 1.13 0.652 0.68 0.62 0.9 21.63
4 Male 20 1.14 0.8 0.66 0.5 0.97 19.6
5 Female 19 1.13 0.68 0.7 0.6 0.91 21.52
6 Female 20 1.15 0.75 0.56 0.35 0.95 25.17
7 Female 20 1.13 0.77 1.22 0.6 1.65 14.47
8 Female 21 1.125 0.66 0.75 0.68 0.9 20.31
9 Female 21 1.23 0.89 0.78 0.65 1.06 17.5
10 Female 21 1.33 0.8 0.84 0.75 1.06 16.79
11 Male 19 1.26 0.78 0.71 0.5 1.02 18.5
12 Female 17 1.23 0.89 0.78 0.65 1.06 17.5
13 Female 18 1.24 0.66 0.8 0.75 0.95 17.92
14 Male 17 1.09 0.75 0.72 0.65 0.92 19.16
15 Male 16 0.11 0.09 0.32 0.5 0.1 26.15
P - Pulp length/root length; R - Pulp length/tooth length; M – mean value of all length and width; W - Mean value of width ratios from level B and C;L -Mean value of length ratios P
RESULTS
Page 52
Table VII: ILLUSTRATING THE RESULTS OBTAINED FROM KVAAL’S METHOD
(GROUP 4)
S.No GENDER CA P/L R/L M W L KVAAL METHOD DA
1 Female 14 1.23 0.76 1.34 0.65 1 9.82
2 Female 14 1.06 0.65 1.48 0.7 1.95 10.36
3 Female 15 1.14 0.63 0.77 0.74 0.8 9.76
4 Female 14 1.07 0.74 0.74 0.65 0.9 18.86
5 Female 13 1.07 0.74 0.74 0.65 0.9 18.86
6 Male 16 0.63 0.44 0.57 0.65 0.53 22.48
7 Female 13 1.07 0.74 0.74 0.65 0.9 18.86
8 Female 16 1.21 0.77 0.7 0.6 0.99 19.6
9 Female 16 1.13 0.82 0.69 0.5 0.98 18.9
10 Female 14 1.18 0.75 0.76 0.7 0.97 18.42
11 Female 16 1.21 0.77 0.7 0.6 0.99 19.6
12 Female 16 1.13 0.82 0