This is a repository copy of Predicting the role of geotechnical parameters on the output from shallow buried explosives.
White Rose Research Online URL for this paper: http://eprints.whiterose.ac.uk/111847/
Version: Accepted Version
Article:
Clarke, S.D., Fay, S.D., Warren, J.A. et al. (5 more authors) (2016) Predicting the role of geotechnical parameters on the output from shallow buried explosives. International Journal of Impact Engineering, 102. pp. 117-128. ISSN 0734-743X
https://doi.org/10.1016/j.ijimpeng.2016.12.006
[email protected] https://eprints.whiterose.ac.uk/
Reuse
This article is distributed under the terms of the Creative Commons Attribution-NonCommercial-NoDerivs (CC BY-NC-ND) licence. This licence only allows you to download this work and share it with others as long as you credit the authors, but you can’t change the article in any way or use it commercially. More
information and the full terms of the licence here: https://creativecommons.org/licenses/
Takedown
If you consider content in White Rose Research Online to be in breach of UK law, please notify us by
Predicting the role of geotechnical parameters on the output from
1shallow buried explosives
2S.D. Clarkea,∗, S.D. Faya,b, J.A. Warrena,b, A. Tyasa,b, S.E. Rigbya, J.J. Reayb, R. Liveseyc, I. 3
Elgyc 4
aDepartment of Civil&Structural Engineering, University of Sheffield, Mappin Street, Sheffield, S1 3JD, UK
5
bBlastech Ltd, The Sheffeld Bioincubator, 40 Leavy Greave Road, Sheffeld, UK, S3 7RD
6
cPhysical Sciences Group, DSTL Porton Down, Salisbury, SP4 0JQ, UK
7
Abstract
8
Experiments have been conducted to quantify the effect the geotechnical conditions surrounding 9
a buried charge have on the resulting output. From the results obtained the critical importance 10
of moisture content in governing the magnitude of impulse delivered is highlighted. This has 11
led to the development of a first-order predictive model for the impulse delivered from a buried 12
charge, based on bulk density and moisture content, allowing rapid assessment of the effect of 13
varying the geotechnical conditions. 14
The work utilised a half-scale impulse measurement apparatus which incorporated a de-15
formable target plate. Impulse, peak and residual target deflections were recorded for each test. 16
No variations the charge geometry, mass of explosive, burial depth or stand-off were consid-17
ered, with the focus solely being on the effect of the geotechnical conditions on the magnitude 18
of loading and structural response. Five differenttypes or grades ofsoilswereused in the work, 19
with both cohesive and cohesionless soils represented. Novel tests with natural beds of clay soil 20
have provided evidence for a fundamental change in loading mechanism between cohesionless 21
and cohesive soils. The effect of air voids on the impulse generated was also investigated which 22
showed that while strongly correlated, air voids alone is a poorer predictor of impulse than 23
moisture content. 24
Keywords: Buried charges, Impulse, Geotechnics, Soil, Plate deformation, IEDs
25
∗Tel.:+44 (0) 114 222 5703
Email address:[email protected](S.D. Clarke)
1. Introduction
26
The accurate quantification of the loading and structural deformation occurring when a 27
shallow buried charge is detonated has received considerable attention in recent times. The 28
conducted research has equal applicability in both civilian (de-mining) and military (protection 29
from improvised explosive devices (IEDs)) arenas. The role geotechnical conditions play in 30
our understanding of the mechanisms of load transfer from buried mines and IEDs is critical 31
to our ability to protect against such events. In the first instance knowledge of which measur-32
able geotechnical parameters can indicate an increased output from a mine or IED can play 33
an important role in route planning for military and civilian endeavours. These same data also 34
allow validation of numerical models to allow a more accurate assessment of the blast loading 35
produced by the detonation of shallow-buried explosives, to aid in future predictive work. 36
A large effort has been made to investigate the effects of soil on the output of buried charges. 37
Many previous studies have concentrated on assessing the deformation of a target [1, 2, 3]. 38
These deformation data are useful for protective system design and platform validation pur-39
poses, but fail to directly assess the effect the soil has on the distribution of the loading applied. 40
Most direct load measurement studies have concentrated on quantifying the impulse imparted to 41
a target, which is typically spatially integrated over the entire target face [4, 5, 6, 7, 8, 9, 10], and 42
hence these studies only provide a single data point for the validation of numerical modelling 43
approaches. 44
This research effort has identified that the geotechnical properties of the soil surrounding 45
a buried charge are of key importance in determining the magnitude of the impulse generated, 46
and the form of the structural response. Significant parameters have been shown to include in 47
rank order; moisture content/saturation/air voids, bulk density, and particle size distribution. 48
Burial depth is also known to have a significant role on the impulse generated with an initial 49
increase in delivered impulse and plate deflection at shallow depths [2] giving rise to a reduction 50
in the deflection and energy imparted [5] as the depth increases further. 51
Much attention has also been given to the generation of numerical modelling techniques 52
models [11] to fully 3D high-fidelity numerical modelling of the explosive, soil and air domains 54
[12, 13]. 55
With knowledge of the principal variables, control of the geotechnical conditions is still key 56
to understanding the relationship between the impulse generated and the structural response.It
57
has been shown previously that by carefully controlling the burial conditions in uniform soils 58
very repeatable impulse data can be obtained (relative standard deviation=1.22% for nominally 59
identical tests [14]). The work reported herein expands on the previous data set providing both 60
the absolute magnitude of the impulse generated from each test and the resulting peak and 61
residual plate deformations to allow for the validation of numerical models. As in previous 62
work the measured outputs were also benchmarked against tests conducted using a surrogate 63
mine in a steel pot (Minepot) described in the Allied Engineering Publication on procedures for 64
evaluating the protection level of armoured vehicles (AEP-55) [15]. The use of the Minepot 65
removes any influence of the soil overburden giving near perfect confinement to the explosives, 66
channelling the blast directly at the centre of the target plate. 67
The test series comprises 74 tests in total, with the results used to generate a first-order
68
impulse predictive method as a function of moisture content and bulk density.
69
2. Geotechnical conditions
70
In the current research programme fivedifferent types or grades ofsoils have been tested at 71
a range of moisture contents (w=mass of water/dry mass of solids) and bulk and dry densities
72
(ρ,total mass of soil and water per unit volume, andρd,dry mass of soil per unit volume). This 73
leads to a natural variation in the air voids (Av,ratio of volume of air to total volume) present in 74
each of the soils as moisture content and initial dry density are varied. 75
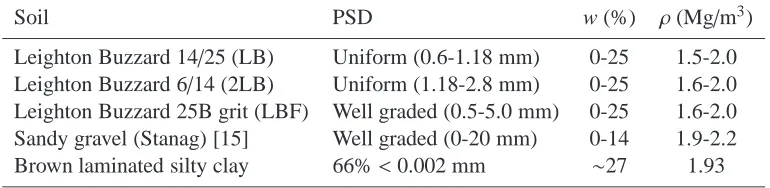
Table 1: Soil types used in the current research
Soil PSD w (%) ρ(Mg/m3)
Leighton Buzzard 14/25 (LB) Uniform (0.6-1.18 mm) 0-25 1.5-2.0 Leighton Buzzard 6/14 (2LB) Uniform (1.18-2.8 mm) 0-25 1.6-2.0 Leighton Buzzard 25B grit (LBF) Well graded (0.5-5.0 mm) 0-25 1.6-2.0 Sandy gravel (Stanag) [15] Well graded (0-20 mm) 0-14 1.9-2.2 Brown laminated silty clay 66%<0.002 mm ∼27 1.93
LB LBF 2LB Stanag Clay
0.01 0.1 1 10
0 10 20 30 40 50 60 70 80 90 100
Mass passing (%)
0.001
Clay Silt Sand
Fine Medium Coarse Fine Medium Coarse
Particle size (mm)
Gravel
Fine Medium Coarse Cobbles
[image:5.595.102.495.69.298.2]100
Figure 1: Particle size distributions for the soils utilised
The soil types tested are given in Table 1 with information on the particle size distribution 76
for each soil type being shown in Fig. 1. Here, the results of a sieve analysis are plotted, with
77
‘mass passing’ referring to the percentage mass passing through each sieve size. Uniform soils 78
have a small range of particle sizes and hence plot as steep lines in Fig. 1, e.g. Leighton Buzzard 79
14/25 (LB) and 6/14 (2LB) sands. Well graded soils have a large range of particle sizes and plot 80
as shallow lines e.g. ‘Stanag’. The ’Stanag’ soil is similar to the sandy gravel recommended 81
for use in buried charge tests given in AEP-55 [15], which falls within the basic parameters 82
prescribed for NATO standardisation agreement, STANAG 4569 [16]. Three test series were 83
conducted, series a, b and c, where the bulk density, dry density, and air void ratio were kept 84
constant respectively. Further details on the soils tested and geotechnical preparation of the 85
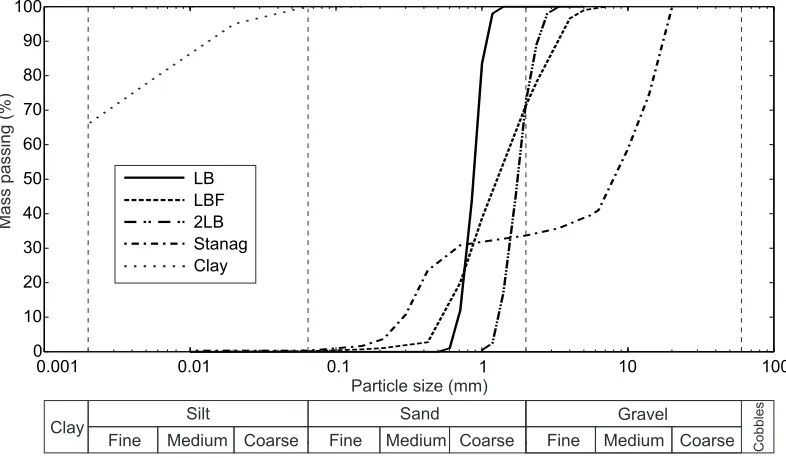
soils can be found in Ref. [14]. The target geotechnical conditions are given in Table 2. The 86
achieved conditions are shown graphically in Fig. 2 as bulk density plotted against moisture 87
content. This figure clearly shows that the Stanag soil has a much higher dry density (1.93 88
Mg/m3) due to a lower natural porosity as the soil is well graded. This naturally leads to a 89
high saturated bulk density (2.2 Mg/m3) at a comparatively low moisture content. Both the LB 90
and Clay soils achieve higher moisture contents at lower bulk densities due to the soils’ higher 91
0 5 10 15 20 25 30 Moisture content (%)
1.4 1.5 1.6 1.7 1.8 1.9 2 2.1 2.2 2.3
Bulk density (Mg/m
3 )
2LB Clay LBa LBb LBc LBFa LBFb Stanag Series b
Series a
[image:6.595.101.501.64.319.2]Series c
Figure 2: Moisture contents and bulk densities achieved in the testing. The dashed line series indicators are only valid for the Leighton Buzzard soils
3. Experimental setup
93
3.1. Test frame
94
The experimental work was conducted by Blastech Ltd at the University of Sheffield Blast & 95
Impact laboratory, Buxton, UK as part of a research project funded by the UK Defence Science 96
and Technology Laboratory (Dstl). The large test frame fabricated is shown in Fig. 3a. The 97
deformable target plate is made from a 12.5 mm thick, 675 mm square mild steel sheet which 98
has been modelled previously using the Johnson-Cook material model parameters given in [17]. 99
The target plate was attached to a 675 mm square stiffinterface plate, fabricated from 100 mm 100
thick mild steel, with a 500 mm diameter circular free span for the target plate. As contact 101
between the target plate and the internal profile of the interface plate was inevitable, the exact 102
dimensions of the plate are given in Fig. 3b & c. The interface plate was in turn connected 103
to a 3 m long, 500 mm diameter steel circular hollow section. The resulting system had an 104
overall reaction mass of 1574 kg. The entire assembly was allowed to translate freely in the 105
vertical direction after picking up load from the detonation of a buried explosive charge, with 106
up to approx. 800 mm of vertical travel allowed. The target plates were attached to the interface 107
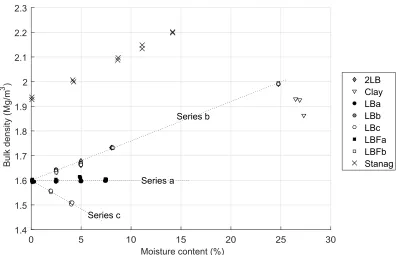
Table 2: Test plan and target geotechnical conditions
Test nos. Soil type Series w ρ ρd Av
(%) (Mg/m3) (Mg/m3) (%)
1–3 LB a, b, c 0.100 1.600 1.598 39.5
4–6 LB a 2.500 1.600 1.561 37.2
7–9 LB a 5.000 1.600 1.524 34.9
10–12 LB a 7.500 1.600 1.488 32.7
13–15 LB b 2.500 1.640 1.600 35.6
16–18 LB b 5.000 1.680 1.600 31.6
19–21 LB b 8.100 1.730 1.600 26.7
22–24 LB b 24.77 1.996 1.600 0.00
25–27 LB c 2.000 1.553 1.523 39.5
28–30 LB c 4.000 1.508 1.450 39.5
31–33 LBF a, b 0.100 1.600 1.598 39.5 34–36 LBF a 2.500 1.600 1.561 37.2 37–39 LBF a 5.000 1.600 1.524 34.9 40–42 LBF a 7.500 1.600 1.488 32.7 43–44 LBF b 2.500 1.640 1.600 35.6 45–46 LBF b 5.000 1.680 1.600 31.6 47–48 LBF b 8.100 1.730 1.600 26.7 49–50 LBF b 24.77 1.996 1.600 0.00 51–52 2LB b 2.500 1.640 1.600 35.6 53–54 2LB b 5.000 1.680 1.600 31.6 55–56 2LB b 8.100 1.730 1.600 26.7 57–58 2LB b 24.77 1.996 1.600 0.00 59–60 Stanag b 0.100 1.929 1.927 27.1 61–62 Stanag b 4.200 2.008 1.927 19.2 63–64 Stanag b 8.700 2.095 1.927 10.5 65–66 Stanag b 11.10 2.141 1.927 5.89 67–68 Stanag b 14.15 2.200 1.927 0.00 69–71 Clay - 27.00 1.961 1.544 0.00
72–74 Minepot - - - -
-plate using 4 timber pegs designed to resist minimal loading, thus simplifying the boundary 108
conditions of the plate to nominally unrestrained, with the target plate simply bearing directly 109
onto the inner profile of the interface plate. The detached target plate was free to fall into the 110
soil container once the event was over reducing any further deformation from the landing. Peak 111
and residual deflections of the deformable target plate were measured post test (§3.4). 112
3.2. Test configuration
113
The present work used a half-geometry scale version of STANAG threat level M2 as given in 114
AEP-55 [15], with the exception of the use of PE4 for all tests as recommended in the UK MoD 115
Technical Authority Instructions [18]. The size of the soil container has also been scaled down 116
to emulate the boundary conditions stipulated in AEP-55 with the exception of the boundary 117
being cylindrical rather than rectangular. Due to the physically smaller charges being used (1/2 118
scale by geometry, 1/8 scale by mass and energy [19]), the Minepot was also scaled down to 119
half scale. In each test a 625 gram charge of PE4 was buried at 50 mm, measured from the 120
A
Soil container Target plate
Rigid reaction frame
Arrestor plate Reaction mass
Object target marker
Reference target marker
100 mm
100 mm 50 mm
12.5 mm thickness
A Ø 500 mm
Ø 600 mm
Ø 300 mm (b)
(a)
(c)
675 mm
~800 mm
Stand-off
Interface plate
Aluminium crush block
Rigid reaction plate
Mounting hole
Figure 3: (a) Free-flying mass impulse capture apparatus, (b) Section through A-A showing the internal construc-tion of the interface plate, (c) View from underneath the interface plate (with the target plate removed)
between the soil/Minepot charge surface and the target plate was 137.5 mm in all tests as shown 122
in Fig. 4,which has been reduced from the 250 mm (500 mm full-scale stand-off) specified in
123
AEP-55. 124
137.5
50 115
38
1000 750
625 g PE4 charge encased in 3 mm thick PVC container 30 mm
thick steel plate
Detonator Vertically translating target mass
675
350 150
Vertically translating target mass
675 (b)
(a)
137.5
Tempered steel Minepot
[image:8.595.39.558.71.389.2]28 mm low density foam spacer
Figure 4: Details of the charge arrangement for tests utilising (a) buried charge, (b) steel Minepot
[image:8.595.88.498.510.709.2]3.3. Impulse measurement
125
Displacement-time data of the reaction mass was measured using two target markers
at-126
tached to the apparatus(Fig. 3), one to the rigid reaction frame (‘reference’ target marker), and 127
the other to the rising reaction mass (‘object’ target marker). Both target markers are raised up 128
on masts to delay possible obstruction by soil throw during the test. A high-speed camera (Dan-129
tec Dynamics NanoSense Mk.2, framing at 4,000 fps) was used to film the target markers. The 130
camera was situated in protective housing on a raised structure at approximately the same height 131
as the target markers, which made it prone to vibration from the air shock, potentially introduc-132
ing an error into the marker tracking. However, since the excitation is common to both target 133
markers, the error can beremovedby subtracting the motion of the reference target marker from 134
that of the object target marker. Using theresultant, camera-vibration correctedrelative motion 135
of the rising mass, the displacement-time history for the target can be calculated. If required
136
(e.g. if the late-time sand throw obscures the camera), a 4th order polynomial can be fitted to
137
the relative displacement-time curve. Whilst the displacement of the rising mass would follow
138
a parabola under truly impulsive loading conditions, a 4th order fit was found to better represent
139
the data, particularly in the early stages of displacement where some flexure of the frame was
140
observed.
141
Fig. 5a shows the displacement-time history from Test 16, whereclear oscillations are seen
142
from image tracking of both the reference and object target markers, which can be seen to
143
effectively cancel out when the relative displacement is taken. Here, the peak displacement of
144
the rising mass is accurately recorded. Fig. 5b shows the displacement-time history from Test 145
23. Here, the displacement can only be tracked up to the point the interface plate impacts the 146
arrestor plate, from this point onwards the polynomial provides the remaining data required to 147
obtain the peak rise. Once the peak rise is obtained the equivalent initial velocity required to 148
cause such a rise can then be calculated [14]. The velocity calculation assumes the velocity is 149
0 0.1 0.2 0.3 0.4 0.5 0.6 0.7 0.8
Time (s)
-100 0 100 200 300 400 500 600 700 800 900
Displacement (mm)
0 0.1 0.2 0.3 0.4
Time (s)
-20 0 20 40 60 80 100 120 140 160 180 200
Displacement (mm)
Object marker Reference marker Relative displacement Projection
[image:10.595.40.567.71.256.2](b) (a)
Figure 5: Example displacement-time histories (a) Test 16, LB w=4.932% ρ=1.670 I=3.00, (b) Test 23, LB
w=24.77%ρ=1.990 I=6.20
3.4. Deflection measurement
151
For each test the peak and residual plate deflections were also recorded. The peak dynamic 152
deformation of the target plate (relative to the interface plate) was accurately measured using a 153
deformable aluminium honeycomb crush block, mounted on a rigid support spanning the 500 154
mm circular hollow section shown in Fig. 3b, c. The residual deflections were recorded post test 155
once the plate was recovered (Fig. 6). The residual deflection was measured from the imprint 156
of the interface plate to give readings comparable with the peak deflection. These data give an 157
indication of the degree of focussing provided by the differing confining conditions. 158
(b) (a)
Figure 6: a) Pre-test target plate attachment detail, showing the timber dowels used, b) Post-test showing the target plate having dropped onto the remainder of the soil bed
[image:10.595.99.497.510.660.2]4. Results
159
The results from each of the 74 tests are given in Table 3, where the achieved geotechni-160
cal conditions are reported alongside the measured impulse and deflections. The relationships 161
between moisture content, air voids, bulk density, impulse and deflection are explored in the 162
following subsections. 163
4.1. Factors affecting impulse
164
4.1.1. Entire test series
165
Fig. 7 shows the compiled data for all tests, where impulse is plotted against each of the
166
geotechnical variables studied. At this stage, it is important to note that each sub-chart does not
167
necessarily represent the isolated effect of each abscissa, as in certain test series an increase in
168
moisture content also increased the bulk/dry density.
169
The Pearson product-moment correlation coefficient (r) for each investigated parameter is 170
also given in Table 4. All the results in Table 4 are statistically significant (p < 0.05 unless 171
indicated otherwise), with the probability of the null hypothesis being true being less than 1E−5 172
in each case. Impulse and moisture content (Fig. 7a) are shown to have a very strong positive 173
correlation (r = 0.94) demonstrating the high influence moisture content has on impulse. This
174
correlation was evaluated as a first order indicator across the entire moisture content range with
175
non-constant densities and air voids. The influence of moisture content in the low moisture
176
content regime is systematically studied in the next section through separate consideration of
177
series a–c tests.
178
Importantly, the moisture content of the confining soil has the ability to more than double 179
the impulse being delivered to the target. When considering the two methods available in AEP-180
55: the use of the Minepot or fully-saturated Stanag it is clear from the results that in terms 181
of impulse delivered the two are not equivalent. The Minepot delivers an average of 2.63 kNs 182
compared with the 5.27 kNs from the soil. 183
Impulse and air voids are also shown to have a strong negative correlation (r = −0.80), 184
which is in agreement withthe work done by Fox [10]. However, there seems to be a limit in 185
Table 3: Achieved geotechnical conditions and experimental results,where∗denotes tests where the rising mass
impacted the arrestor plate and+denotes the test where late-time displacement data was obscured fully by the sand
throw. For these tests, the peak displacement was extrapolated from the polynomial fit
Test no. Soil type w ρ ρd Av Impulse Peak Residual
(%) (Mg/m3) (Mg/m3) (%) (kNs) deflection deflection
(mm) (mm)
1 LB 0.100 1.594 1.592 39.8 2.63 90.5 92.5
2 LB 0.100 1.593 1.591 39.8 2.73 88.5 96.0
3 LB 0.281 1.594 1.589 39.6 2.79 84.5 94.5
4 LB 2.459 1.596 1.558 37.4 2.85 86.5 93.5
5 LB 2.470 1.596 1.558 37.4 2.80 92.5 96.5
6 LB 2.480 1.595 1.556 37.4 3.14 87.5 97.0
7 LB 4.932 1.595 1.520 35.1 2.83 90.5 98.5
8 LB 4.998 1.600 1.524 34.9 2.78 95.5 100.0
9 LB 5.020 1.595 1.519 35.1 2.92 91.5 95.5
10 LB 7.388 1.598 1.488 32.9 2.83 94.5 100.0
11 LB 7.446 1.599 1.488 32.7 2.87 93.5 102.5
12 LB 7.481 1.598 1.486 32.8 3.00 89.5 98.0
13 LB 2.491 1.643 1.603 35.5 2.96 92.0 85.5
14 LB 2.491 1.641 1.601 35.6 3.03 107.0 98.0
15 LB 2.543 1.642 1.601 35.5 2.96 95.5 95.0
16 LB 4.932 1.670 1.592 32.1 3.00 113.5 103.5
17 LB 4.943 1.664 1.586 32.3 3.01 105.0 99.0
18 LB 4.998 1.670 1.591 32.0 3.08 104.0 96.5
19 LB 8.108 1.733 1.603 26.5 3.07 107.0 96.5
20 LB 8.108 1.730 1.600 26.6 3.11 102.0 98.5
21 LB 8.120 1.734 1.604 26.5 3.05 99.5 94.5
22 LB 24.77 1.990 1.595 0.31 6.30∗ 160.5 152.5 23 LB 24.77 1.990 1.595 0.31 6.20∗ 170.0 154.5 24 LB 24.77 1.990 1.595 0.31 6.13∗ 165.0 155.5
25 LB 1.926 1.557 1.528 39.4 2.59 96.0 94.0
26 LB 1.978 1.552 1.522 39.6 2.60 100.5 99.5
27 LB 1.999 1.558 1.527 39.3 2.92 94.0 93.0
28 LB 3.972 1.509 1.451 39.5 3.00 101.0 98.0
29 LB 4.037 1.502 1.444 39.7 2.94 98.0 95.5
30 LB 4.102 1.509 1.450 39.4 2.85 103.0 101.5 31 LBF 0.080 1.600 1.599 39.5 2.79 108.5 104.0 32 LBF 0.080 1.600 1.599 39.5 3.04 111.5 107.5 33 LBF 0.100 1.604 1.602 39.4 3.10 112.0 108.0 34 LBF 2.470 1.596 1.558 37.4 2.73 102.0 100.5 35 LBF 2.492 1.603 1.564 37.1 2.52 101.5 96.5
36 LBF 2.561 1.598 1.558 37.2 2.47 99.5 99.0
37 LBF 4.833 1.615 1.541 34.4 2.94 108.0 103.5 38 LBF 4.888 1.613 1.538 34.5 2.96 102.0 96.5 39 LBF 4.943 1.608 1.532 34.6 2.95 105.5 97.5
40 LBF 7.411 1.601 1.491 32.7 2.39 97.0 94.0
41 LBF 7.411 1.605 1.494 32.5 2.34 98.0 93.5
42 LBF 7.532 1.604 1.492 32.5 3.01 108.0 100.5 43 LBF 2.480 1.638 1.598 35.7 3.13 101.0 98.0
44 LBF 2.543 1.631 1.591 35.9 2.96 96.5 94.5
45 LBF 4.965 1.667 1.588 32.2 3.16 103.0 102.5 46 LBF 4.965 1.662 1.583 32.4 3.03 103.0 102.5 47 LBF 8.167 1.730 1.599 26.6 3.01 104.0 102.5 48 LBF 8.178 1.732 1.601 26.5 3.21 104.0 96.5 49 LBF 24.77 1.996 1.600 0.01 5.57+ 153.0 146.0
50 LBF 24.77 1.990 1.595 0.31 6.16∗ 160.0 154.0 51 2LB 2.512 1.633 1.593 35.9 3.10 108.5 106.0 52 2LB 2.512 1.635 1.595 35.8 3.01 104.0 100.5 53 2LB 4.993 1.660 1.581 32.4 3.11 104.5 96.0 54 2LB 4.998 1.679 1.599 31.7 3.22 103.0 99.5 55 2LB 8.026 1.732 1.603 26.6 3.23 111.5 111.0 56 2LB 8.085 1.732 1.602 26.6 3.25 103.5 99.0 57 2LB 24.77 1.990 1.595 0.31 6.42∗ 163.0 156.0 58 2LB 24.77 1.990 1.595 0.31 6.51∗ 167.0 159.0 59 Stanag 0.090 1.937 1.935 26.8 3.01 115.0 112.5 60 Stanag 0.090 1.928 1.926 27.1 2.99 115.4 113.0 61 Stanag 4.167 2.006 1.926 19.3 3.46 129.0 120.5 62 Stanag 4.232 1.999 1.918 19.5 3.27 121.0 117.0 63 Stanag 8.648 2.088 1.922 10.9 4.37 136.0 134.5 64 Stanag 8.719 2.097 1.929 10.4 4.38 139.0 131.5 65 Stanag 11.11 2.148 1.933 5.57 4.69 158.0 146.5 66 Stanag 11.14 2.133 1.919 6.20 4.88 148.0 136.0 67 Stanag 14.15 2.198 1.926 0.09 4.97 169.0 152.5 68 Stanag 14.15 2.201 1.928 0.00 5.57 164.5 153.5 69 Clay 26.50 1.929 1.525 0.00 7.82∗ 97.0 95.0 70 Clay 26.90 1.925 1.517 0.00 7.79∗ 100.0 98.0 71 Clay 27.30 1.862 1.463 0.00 7.69∗ 101.0 97.0
72 Minepot - - - - 2.63 141.8 138.5
73 Minepot - - - - 2.65 145.0 139.5
74 Minepot - - - - 2.60 144.0 140.5
This is shown in Fig. 7b where the points at zero air voids account for a 36% variation in 187
delivered impulse. It is appreciated that three very different soil types are represented: LB a 188
cohesionless uniform sand, Stanag a well-graded cohesionless sandy-gravel, and Clay a cohe-189
sive fine-grained silty clay. These differing soils have markedly different constitutive properties, 190
which when combined with a numerical model able to incorporate them can lead to excellent 191
agreement between numerical and physical modelling [12, 10]. 192
As a primary single predictor of impulse however, moisture content has been shown to be 193
more highly correlated, indicating its relevance for inclusion in future simplified models to 194
predict loading. For completion, the correlation of impulse with bulk density is also plotted in 195
Fig. 7c. This shows a moderate positive correlation (r = 0.47). Bulk density has had success 196
as the sole predictor of impulse in empirical models for mine blast [11], but like air voids has 197
[image:13.595.176.417.364.437.2]difficulty in differentiating between soil types at full saturation. 198
Table 4: Correlation between geotechnical parameters and Impulse
w ρ Av I
w 1.0000 0.4749 −0.7571 0.9356
ρ 0.4749 1.0000 −0.0937* 0.4710
Av −0.7571 −0.0937* 1.0000 −0.7978
I 0.9356 0.4710 −0.7978 1.0000 *Low statistical significance
Table 4 also shows the correlation between geotechnical parameters such as density and 199
moisture content. Due to the wide variety of soils utilised, a high moisture content does not 200
necessarily equal a high density. The correlation is almost identical to that between density and 201
impulse showing that for a single soil type where density increases monotonically with moisture 202
content, bulk density would be an excellent indicator of impulsive output. 203
In the sub-test series a, b & c, the bulk density, dry density, and air voids were kept constant 204
respectively. The data from these test series at low moisture contents have been replotted in 205
Fig. 8. 206
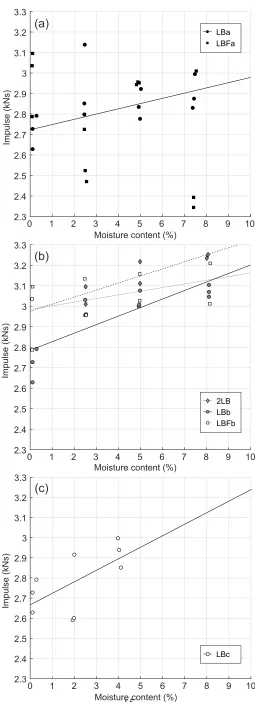
4.1.2. Series a
207
In Fig. 8a, where bulk density was held constant, the LBa data show a moderate positive 208
trend (r= 0.42), however this does include the outlier at 2.5% moisture content (I =3.14 kNs). 209
trend line is plotted. This indicates that with no change of the overall mass in the system, as the 211
moisture content increases the impulse delivered to a target will also increase (as the moisture 212
content increases, the dry density of the soil decreases). 213
These findings support general observations that moisture content plays a more important 214
role in governing the output from a buried charge than its density alone would suggest. This 215
trend is only true for LB due to the difficulties in preparing the LBF as noted previously [14], 216
due to it having an increased variation in particle size compared to LB. There does exist a 217
weak negative correlation (r = −0.34) in the LBF data, but this is not statistically significant 218
(p= 0.28). 219
Due to the nature of test series a, there are only a limited number of low moisture contents 220
which can be used before the minimum dry density of the soil was reached. 221
4.1.3. Series b
222
In test series b (Fig. 8b) the dry density of the soils were held constant while the moisture 223
content and hence bulk density was increased. All soils in this series show a positive correlation 224
between moisture content and impulse, ranging from r = 0.46 in the LBF to r = 0.88 and 225
r = 0.84 for the 2LB and LB respectively. It should be noted that these are the trends for the
226
low moisture content data only.
227
In test series b the moisture content can be increased to full saturation, at which point the 228
individual soil correlations are within 0.02 of the overall dataset correlation of r = 0.97 in 229
Fig. 7a. These data support previous findings where more uniformly-graded soils (LB and
230
2LB) produced more repeatable soil beds and hence a higher correlation [14]. 231
4.1.4. Series c
232
In the final test series, the air voids present in the soil were kept constant, leading to a rapid
233
decrease in dry density as moisture content was increased. The results presented in Fig. 8c
234
show a positive correlation (r=0.62) which, when compared to the strong correlation between
235
moisture content and impulse (r = 0.94), emphasizes the importance of using moisture content
236
as a primary metric over air voids.
237
0 5 10 15 20 25 30
Moisture content (%)
2 3 4 5 6 7 8
Impulse (kNs)
1.4 1.5 1.6 1.7 1.8 1.9 2 2.1 2.2 2.3
Bulk density (Mg/m3)
2 3 4 5 6 7 8
Impulse (kNs)
0 5 10 15 20 25 30 35 40
Air voids (%)
2 3 4 5 6 7 8
Impulse (kNs)
2LB Clay LBa LBb LBc LBFa LBFb Stanag Minepot
(a)
(b)
[image:15.595.131.470.47.706.2](c)
2.3 2.4 2.5 2.6 2.7 2.8 2.9 3 3.1 3.2 3.3
Impulse (kNs)
2.3 2.4 2.5 2.6 2.7 2.8 2.9 3 3.1 3.2 3.3
Impulse (kNs)
(a)
(b)
0 1 2 3 4 5 6 7 8 9 10
Moisture content (%) 2.3
2.4 2.5 2.6 2.7 2.8 2.9 3 3.1 3.2 3.3
Impulse (kNs)
(c)
0 1 2 3 4 5 6 7 8 9 10
Moisture content (%)
0 1 2 3 4 5 6 7 8 9 10
Moisture content (%)
2LB LBb LBFb LBa LBFa
[image:16.595.170.425.60.762.2]LBc
Figure 8: Impulse at low moisture contents. Test series: (a) constant bulk density (b) constant dry density, and (c) constant air voids
4.2. Scaling particle size distributions
238
To directly assess the effect of possible scaling issues on the grain size of the soil when 239
moving between full and half-scale testing, tests were conducted with two variations of LB. 240
The standard LB used has a particle size range between 0.6–1.18 mm (midpoint particle size, 241
D50 = 0.87 mm), the second variant, 2LB has particles twice as large (range = 1.18–2.8 mm, 242
D50 = 1.76 mm). This means that 2LB at the current scale is geometrically identical to LB 243
at full-scale. Comparison of the results from the two soils can therefore be used to determine
244
whether scaling the particle size is also required when moving to half-scale testing. The impulse
245
results in Fig. 7a and highlighted further in Fig. 8b showno clear systematic difference between 246
the LB(b) and 2LB results (r = 0.84 and r = 0.88) indicating that scaling of the grain size 247
at half-scale testing is not required. It should be noted that the difference between the trend 248
lines in Fig. 8b is caused by the exclusion of the full saturation data. The average difference 249
between the trendlines plotted through the entire LBb and 2LBdatasetis 2.5%, which is within 250
the experimental error for both soils reported in [14]. Any further scaling down of the test 251
arrangement would require further validation to check that the soil is still indicative of its full-252
scale equivalent. 253
4.3. Factors affecting plate deflection
254
For each test the peak and residual deflections were recorded. Fig. 9 show the peak de-255
flection plotted against moisture content, air voids and bulk density. Interestingly the primary 256
predictor of impulse is not the same as that for plate deflection. Fig. 9a shows the correla-257
tion of peak deflection versus moisture content. Whilst there is a moderate positive correlation 258
(r = 0.47), soil type plays a more important role, highlighted by the results at full saturation 259
where there is a 50% spread of deflection between the Stanag, LB and Clay soils. As was dis-260
cussed previously, the use of the Minepot not only lowers impulse delivered but also the peak 261
target deflections when compared with the fully-saturated Stanag. Air voids are shown to be a 262
more correlated predictor of plate deformation as shown in Fig. 9b (r= −0.76). This value does 263
include the cohesive soils which no not conform to the same trends, indicating that the mode of 264
Fig. 9c, peak deflection is plotted against bulk density. The overall correlation is stronger than 266
with moisture content (r = 0.56). It is worth noting that this overall trend with bulk density 267
incorporates all soils rather than being an excellent fit for cohesionless soils only. 268
Thus far each of the geotechnical factors have been plotted against peak deflection. Rather 269
than also plotting all the data against residual deflection, peak deflection has been plotted against 270
residual deflection in Fig. 10. With an R2value of 0.98, the deflections are almost perfectly pro-271
portional, with peak deflection being 7.5% higher than the corresponding residual deflection 272
(post elastic strain recovery), as would be expected. Therefore, the trends for peak deflection 273
outlined previously are equally applicable for residual deflection in this experimental configu-274
ration. 275
4.4. Impulse and deflection interactions
276
To further interrogate the dataset, peak deflection was plotted against impulse for all the tests 277
conducted, Fig.11. For all the cohesionless soil tests the data lie in a band where peak deflection 278
is approximately proportional to the impulse delivered. It is postulated that the factor driving 279
deflection is the degree of focus of the generated blast. The best example of this focussing 280
effect is the Minepot, which is able to drive a high deflection despite delivering a relatively 281
low impulse. Alternatively, the Clay data show very low deflections despite having the highest 282
impulse, indicating that the loading is delivered in a less focussed, more spatially uniform way. 283
5. Development of a predictive model for impulse
284
Predicting the impulsive output from buried charges is highly dependent on the physical 285
test arrangement used. Whilst the effects of a specific combination of soil type, charge size,
286
and burial geometry can be determined through experimentation or numerical analysis, the aim 287
of this paper is to develop a simplified predictive model that indicates how the geotechnical 288
conditions can effect the impulse generated by a buried charge in a relative way. For impulse, 289
moisture content has been shown to be the driving geotechnical condition, however bulk density 290
also been shown to have a secondary effect in mediating impulse. In this article an impulse
291
modification factor (Imod) is developed based on the combined effects of moisture content and
292
1.4 1.5 1.6 1.7 1.8 1.9 2 2.1 2.2 2.3
Bulk density (Mg/m3)
80 90 100 110 120 130 140 150 160 170 180
Peak de
flection (mm)
0 5 10 15 20 25 30
Moisture content (%)
80 90 100 110 120 130 140 150 160 170 180
Peak de
flection (mm)
0 5 10 15 20 25 30 35 40
Air voids (%)
80 90 100 110 120 130 140 150 160 170 180
Peak de
flection (mm)
2LB Clay LBa LBb LBc LBFa LBFb Stanag Minepot (a)
(b)
[image:19.595.127.470.60.706.2](c)
80
Residual deflection (mm) 80
90 100 110 120 130 140 150 160 170 180
Peak de
flection (mm)
2LB Clay LBa LBb LBc LBFa LBFb Stanag Minepot
R = 0.982
y= 1.0751 - 2.632x
100 110 120 130 140 150 160 170 180
[image:20.595.98.500.77.393.2]90
Figure 10: Peak versus residual plate deflection
2 3 4 5 6 7 8
Impulse (kNs) 80
90 100 110 120 130 140 150 160 170 180
Peak de
flection (mm)
[image:20.595.102.498.333.609.2]2LB Clay LBa LBb LBc LBFa LBFb Stanag Minepot
Figure 11: Peak plate deflection versus impulse
bulk density, which, when used to multiply the known impulse from a reference condition, can
293
give a first-order estimate of the impulse delivered to a target situated above the soil bed.
294
The reference condition in the proposed model (Imod = 1) is that of a dry uniform sand 295
(LB) with a bulk density of 1.6 Mg/m3, representing the lowest mass and moisture content 296
combination likely to be present in the natural environment. The impulse from each test was 297
divided by the average reference condition impulse to give a normalised value. A multiple 298
linear regression analysis was then conducted to assess the individual contributions of both 299
geotechnical parameters on impulse. Theimpulse modification factor, Imod (unitless), is given
300
in Equation 1, where w is moisture content in percent and ρ is bulk density in Mg/m3. The 301
results of this equation are shown in Fig. 12a with the higher the moisture content and bulk 302
density the greater the factor on the reference impulse. 303
Imod= 0.89935−0.095907w+0.033118ρ+0.077821wρ (1)
As the predictive method is intended to be first-order accurate, it is important to consider the 304
potential error in the calculated impulse. The model error is plotted against both bulk density 305
and moisture content in Figs. 12b and c respectively to identify any areas where the model 306
is less accurate. The relative standard deviation of the model predictions is 0.0953, with 1σ
307
and 2σ bounds (representing the 68 and 95% confidence intervals) also shown in Figs. 12b 308
and c. Hence as there is a 95% probability that the calculated impulse is within ±20% of 309
the actual value. The mean absolute model error across the whole data series (experimental
310
impulse/prediction)is 7.3%. 311
When considering the accuracy of the model across the entire data series, it is worth noting
312
the following:
313
• The influence of moisture content on impulse becomes less significant for moisture
con-314
tents below 8%. Whilst Figure 8b shows that the impulse delivered to a target will increase
315
with increasing moisture content when the bulk density of the soil is kept constant, the
316
model will over-predict this effect. This can be seen in Fig. 12c where the model gives an
317
impulse value that is consistently lower than the experiments at 0% moisture content and
318
consistently higher than the experiments at 8% moisture content.
319
• Bulk density effects are less well accounted for at bulk densities below 1.8 Mg/m3. This 320
is due to the minimal influence of bulk density on impulse at these values (see Fig. 7),
particularly at low moisture contents. This produces a region of near-unity modification
322
factors towards the bottom-left of Fig. 12a. Despite this, the model is still accurate to
323
±20% in this range.
324
Moisture content (%) (c) 0 0.7 0.8 0.9 1 1.1 1.2 1.3 0.7 0.8 0.9 1 1.1 1.2 1.3
Experimental impulse / prediction (-)
Bulk density (Mg/m3 )
Moisture content (%)
Bulk density (Mg/m3 ) (b) 0.8 1 1 1.2 1.2 1.4 1.6 1.8 2 2.2 2.4 2.6 2.8 3 3.2 3.4 3.6
1.0 1.5 2.0 2.5 5 10 15 20 25 30 (a)
5 10 15 20 25 30
2LB Clay LBa LBb LBc LBFa LBFb Stanag
1.0 1.5 2.0 2.5
+1σ +2σ -1σ -2σ +1σ +2σ -1σ -2σ
[image:22.595.34.565.133.490.2]Experimental impulse / prediction (-)
Figure 12: Output from predicted model (a) lookup table for modification factor (Imod) to account for geotechnical
parameters. Experimental factor divided by the predicted factor plotted against (b) bulk density (c) moisture content
5.1. Worked example 1: geotechnical variance
325
The predictive model requires a reference condition to which the calculated modification 326
factor is applied. The reference condition consists of a specific bulk density and moisture con-327
tent at which the impulsive output from a physical test is known. This allows any changes in 328
geometry (from the test conditions presented in this paper) to be appropriately incorporated. 329
The reference condition used in this example is that of dry LB at a bulk density of ≈ 1.6 330
Mg/m3. From Table 3 it is known that impulse delivered from a 625 g charge buried at 50 mm 331
will be≈ 2.7 kNs. From the reference condition it is possible using the modification factors in 332
Fig. 12a to assess the range of impulses achievable with variations in moisture content (and bulk 333
density as the two are intrinsically linked). From Fig. 12a, dry soil (w = 0%, ρ = 1.6 Mg/m3) 334
has a corresponding modification factor of≈1.0. 335
By using Fig. 12a the modification factor can be assessed for any change in geotechnical 336
conditions. For example at full saturation, the moisture content and density both change, in this 337
case w = 25% and ρ = 2 Mg/m3, giving a modification factor of ≈ 2.4 (2.459 using Eq. 1). 338
By multiplying the measured reference condition impulse by the modification factors the range 339
of impulses can be generated. This leads to a range in impulse from 2.7 kNs for a dry soil in 340
the reference condition to 6.48 kNs (6.64 kNs using Eq. 1) for a saturated soil, which when 341
compared with the experimentally measured results (2.63–6.03 kNs) is within the error of the 342
model and provides an indicative first-order estimate. 343
5.2. Worked example 2: impact on numerical models
344
The assessment of impulse variation is also applicable to numerical modelling. One of 345
the most easily accessible models for the prediction of mine loading is the empirical method 346
outlined by Tremblay [20], based on the original work by Westine et al. [11]. This model 347
includes bulk density as an input parameter, but does not explicitly include moisture content 348
effects. The predictive model in this paper can therefore be utilised to modify the Tremblay-349
calculated impulse to account for moisture content effects. 350
The Tremblay model gives the total impulse acting on a plate, I, as
351
I =0.1352 1+ 7δ
9z
! r
ρE z
x1
Z
x0
y1
Z
y0
tanh(0.9589ζd) ζd
!3.25
dydx (2)
where the symbols used in Equation 2 are given in Table 5 and have been evaluated for the
352
experimental arrangement in the current article. This equation was solved through numerical
353
integration using MatLab. The value of E/Aρc2z=3.3953 is below the lower limit of 6.35, and
354
hence the results are extrapolated slightly beyond the range suggested by Tremblay.
355
In Fig. 13, Equation 1 is plotted for moisture contents between 0 and 20%, at 5% increments, 356
ted as the dashed line, where the results have been normalised against the Tremlbay-predicted 358
impulse at a reference condition of ρ = 1.6 Mg/m3. As shown in Fig. 13, at a bulk density of 359
[image:24.595.92.503.161.383.2]2.1 Mg/m3Tremblay model result lies between the 0 and 5% moisture content lines. 360
Table 5: Input parameters for the Tremblay model
Parameter Symbol Value
Burial depth (from charge centre) δ 0.038/2+0.05=0.069 m Standoff(from charge centre) z δ+0.1375=0.2065 m
Soil density ρ 1600 kg/m3
Explosive mass W 0.625 kg
Energy release in explosive charge E W×6.7E6=4187500 J Cross-sectional area of mine (in plan) A π×(0.115/2)2 =0.104 m2 Seismic P-wave velocity c 500 ms−1
Plate dimensions x0 −0.3375 m
x1 +0.3375 m
y0 −0.3375 m
y1 +0.3375 m
Lateral distance to centre of mine d px2+y2
Tremlay parameter ζ δ
z5/4A3/8tanh
2.2δ
z
3/2! =0.0499 m
−1
The Tremblay model does not explicitly account for moisture content effects. The
modifica-361
tion factor, Imod, determined from Equation 1, can be applied to the Tremblay model prediction
362
to account for this. In the case of a soil with a moisture content of 10% and bulk density of
363
2.1 Mg/m3, using the impulse modification factor derived in this article alone would give a
fac-364
tor of 1.56 to apply to the reference condition of the impulse from dry soil at a bulk density
365
of 1.6 Mg/m3. However, as the Tremblay model already includes allowances for bulk density
366
effects, the modification factor of 1.56 cannot be directly applied to the results. The Tremblay
367
model predicts a normalised impulse of 1.15 when accounting for bulk density effects alone at
368
ρ = 2.1 Mg/m3. The correct modification factor to apply to the Tremblay reference condition 369
would therefore be the modification factor calculated from the predictive method in this article at
370
10% moisture content, divided by the dry Tremblay normalised impulse, i.e. 1.56/1.15=1.36.
371
This modification factor can then be applied directly to the results from the Tremblay model
372
to account for the combined effects of bulk density and moisture content. Clearly this method
373
relies on an accurate underlying model, however its use as an indicative first-order estimate for
374
the variation generated by changing geotechnical conditions is valid regardless of the reference
375
condition.
376
Bulk density (Mg/m3 ) 0.8
1 1.2 1.4 1.6 1.8 2 2.2 2.4
Modi
fi
cation factor
Tremblay
1.5 1.6 1.7 1.8 1.9 2 2.1 2.2 2.3
1.4
1.15
0% 5%
10%
15% 20%
1.56
[image:25.595.100.496.92.328.2]Moisture content
Figure 13: Predicting the possible influence of moisture content on the impulse generated by the Tremblay model
6. Conclusions
377
It has been shown that moisture content is the primary geotechnical condition which governs 378
the impulsive output from a shallow buried charge with a positive correlation, r, of 0.9356. By 379
moving from a dry to a saturated sand the impulsive output can be more than doubled. 380
Whilst air voids are also a good indicator of impulse output their inability to distinguish be-381
tween soils at full saturation is problematic for use in any predictive model. This was confirmed 382
by conducting separate test series at low moisture contents specifically looking at keeping the 383
air voids, dry, and bulk densities constant and comparing the impulses. This study showed that 384
for soils which have identical air void ratios, the effect of increasing moisture content (whilst 385
decreasing mass) still has the effect of increasing impulse. 386
As many soils were utilised in the work the effect of scaling particle sizes by a factor of 387
50% was also investigated by testing with LB and 2LB soils. This showed no noticeable effect 388
on the output from tests in both soils for both deflection and impulse measurements, validating 389
particle distributions. However, further work would be required to validate this approach below 391
the half-scale testing current conducted. 392
The primary geotechnical condition which governs plate deflections was found to be air 393
voids. It is hypothesised that this is due to the confinement given to the detonation products by 394
the soil. For cohesionless soils this means that the less compressible the soil (the lower the air 395
voids) the more confinement given to the detonation products, and hence the loading is more 396
localised and the deflections larger. This is only true however for cohesionless soils. In the case 397
of cohesive soils (clay) the deflections were 40% lower due to a lower degree of focusing of 398
the loading. The Minepot results conversely gave a much higher deflection than the impulse 399
measured during the testing would suggest. For nominally identical test setups, a uniform blast 400
load will have a higher impulse:deflection ratio whereas a focussed load will deliver a lower 401
impulse:deflection ratio. The exact nature of this loading is currently being investigated further 402
by the authors [21, 22]. 403
A first-order predictive model for the impulse from a buried charge has been proposed based 404
on the results presented herein, which allows researchers to gain an estimate of the effect that 405
changing the bulk density and moisture content of the soil surrounding a buried charge has on 406
the impulse output. It is hope that this will provide a simple assessment tool for numerical 407
model error analyses and for fast running engineering models. 408
Acknowledgements
409
The authors wish to thank the Defence Science and Technology Laboratory (DSTLX-1000059883) 410
for funding the published work. 411
References
412
[1] A Neuberger, S Peles, and D Rittel. Scaling the response of circular plates subjected to large and close-range 413
spherical explosions. Part II: Buried charges. International Journal of Impact Engineering, 34(5):874–882, 414
2007. 415
[2] Pickering EG, Chung Kim Yuen S, Nurick, GN, Haw P. The response of quadrangular plates to buried 416
charges. Int J of Impact Eng, 49:103–114, 2012. 417
[3] Shaowen Xu, Xiaomin Deng, Vikrant Tiwari, Michael a. Sutton, William L. Fourney, and Damien Bretall. An 418
inverse approach for pressure load identification. International Journal of Impact Engineering, 37(7):865– 419
877, 2010. 420
[4] Bergeron DM, Trembley JE. Canadian research to characterize mine blast output. 16th Int Sym on the 421
Military Aspects of Blast and Shock, Oxford, UK, 2000.
422
[5] Hlady SL. Effect of soil parameters on landmine blast. 18th Int Sym on the Military Aspects of Blast and 423
Shock, Bad Reichenhall, Germany, 2004.
424
[6] Fourney WL, Leiste U, Bonenberger R, Goodings DJ. Mechanism of loading on plates due to explosive 425
detonation. Int J on Blasting and Fragmentation, 9(4):205–217, 2005. 426
[7] Anderson CE, Behner T, Weiss CE. Mine blast loading experiments. Int J of Impact Eng, 38(8-9):697–706, 427
2011. 428
[8] Fox DM, Huang X, Jung D, Fourney WL, Leiste U, Lee JS. The response of small scale rigid targets to 429
shallow buried explosive detonations. Int J of Impact Eng, 38(11):882–891, 2011. 430
[9] Ehrgott JQ, Rhett RG, Akers SA, Rickman DD. Design and fabrication of an impulse measurement device to 431
quantify the blast environment from a near-surface detonation in soil. Experimental Techniques, 35(3):51–62, 432
2011. 433
[10] Fox DM, Akers SA, Leiste UH, Fourney WL, Windham JE, Lee JS, Ehrgott JQ, Taylor LC. The effects of air 434
filled voids and water content on the momentum transferred from a shallow buried explosive to a rigid target. 435
Intl J of Impact Eng, 69(0):182–193, 2014.
436
[11] Westine PS, Morris BL, Cox PA, Polch E. Development of computer program for floor plate response from 437
landmine explosions. Contract Report No. 1345, for US Army TACOM Research and Development Center, 438
1985. 439
[12] Grujicic M, Pandurangan B, Cheeseman BA. The effect of degree of saturation of sand on detonation phe-440
nomena associated with shallow-buried and ground-laid mines. Shock and Vibration, 13(1):41–61, 2006. 441
[13] Deshpande VS, McMeeking RM, Wadley HNG, Evans AG. Constitutive model for predicting dynamic 442
interactions between soil ejecta and structural panels. Journal of the Mechanics and Physics of Solids, 443
57(8):1139–1164, 2009. 444
[14] Clarke SD, Fay SD, Warren JA, Tyas A, Rigby SE, Reay JJ, Livesey R, Elgy I. Geotechnical causes for 445
variations in output measured from shallow buried charges. Intl J of Impact Eng, 86(0):274–283, 2015. 446
[15] NATO. Procedures for evaluating the protection level of armoured vehicles - mine threat. Allied Eng. 447
Publication (AEP) 55, Vol.2, Edition C, Version 1, May, 2014.
448
[16] NATO. Protection levels for occupants of armoured vehicles. STANAG 4569, Edition 3, 23 May, 2014. 449
[17] S.D. Fay, S.E. Rigby, A. Tyas, S.D. Clarke, J.J. Reay, J.a. Warren, and R. Brown. Displacement timer pins: 450
Journal of Impact Engineering, 86:124–130, 2015.
452
[18] DSTL. UK ministry of defence technical authority instructions for testing the protection level of vehicles 453
against buried blast mines. DSTL (draft), 2012. 454
[19] X. Zhao, V. Tiwari, M. A. Sutton, X. Deng, W. L. Fourney, and U. Leiste. Scaling of the deformation 455
histories for clamped circular plates subjected to blast loading by buried charges. International Journal of 456
Impact Engineering, 54:31–50, 2013.
457
[20] Tremblay JE. Impulse on blast deflectors from a landmine explosion. DREV Technical memorandum, DREV-458
TM-9814, 1998.
459
[21] Clarke SD, Fay SD, Warren JA, Tyas A, Rigby SE, Elgy I. A large scale experimental approach to the 460
measurement of spatially and temporally localised loading from the detonation of shallow-buried explosives. 461
Measurement Science and Technology, 26:015001, 2015.
462
[22] S.E. Rigby, S.D. Fay, S.D. Clarke, A. Tyas, J.J. Reay, J.A. Warren, M. Gant, and I. Elgy. Measuring spatial 463
pressure distribution from explosives buried in dry leighton buzzard sand. International Journal of Impact 464
Engineering, 96:89 – 104, 2016.
465