Role of Microstructure and Surface Defects on the Dissolution
Kinetics of CeO
2
, a UO
2
Fuel Analogue
Claire L. Corkhill,
*
Daniel J. Bailey, Florent Y. Tocino, Martin C. Stennett, James A. Miller, John L. Provis,
Karl P. Travis, and Neil C. Hyatt
*
Immobilisation Science Laboratory, Department of Materials Science and Engineering, The University of Sheffield, Sir Robert Hadfield Building, Mappin Street, Sheffield S1 3JD, U.K.
ABSTRACT: The release of radionuclides from spent fuel in a geological disposal facility is controlled by the surface mediated dissolution of UO2 in groundwater. In this study we investigate the influence of reactive surface sites on the dissolution of a synthesized CeO2analogue for UO2 fuel. Dissolution was performed on the following: CeO2annealed at high
temperature, which eliminated intrinsic surface defects (point defects and dislocations); CeO2‑x annealed in inert and reducing atmospheres to
induce oxygen vacancy defects and on crushed CeO2particles of different size fractions. BET surface area measurements were used as an indicator of reactive surface site concentration. Cerium stoichiometry, determined using X-ray Photoelectron Spectroscopy (XPS) and supported by X-ray Diffraction (XRD) analysis, was used to determine oxygen vacancy concentration. Upon dissolution in nitric acid medium at 90 °C, a quantifiable relationship was established between the concentration of
high energy surface sites and CeO2dissolution rate; the greater the proportion of intrinsic defects and oxygen vacancies, the
higher the dissolution rate. Dissolution of oxygen vacancy-containing CeO2‑xgave rise to rates that were an order of magnitude greater than for CeO2with fewer oxygen vacancies. While enhanced solubility of Ce3+influenced the dissolution, it was shown
that replacement of vacancy sites by oxygen significantly affected the dissolution mechanism due to changes in the lattice volume and strain upon dissolution and concurrent grain boundary decohesion. These results highlight the significant influence of defect sites and grain boundaries on the dissolution kinetics of UO2fuel analogues and reduce uncertainty in the long term performance of spent fuel in geological disposal.
KEYWORDS: nuclear fuel, dissolution, defects, oxygen vacancies, grain boundaries
1. INTRODUCTION
Spent nuclear fuel is a heterogeneous ceramic material composed primarily of UO2, with a minor component of actinides and fission products. The internationally supported strategy for the safe disposal of this nuclear waste material is within a geological disposal facility,1 where the release of radionuclides to the environment will be dominated by the interaction of the UO2matrix with groundwater. To assess the
long-term performance of the geological disposal site toward the containment of radionuclides, a safety case is being prepared, which assesses the mechanism and kinetics of fuel dissolution; accordingly, a large number of laboratory experi-ments have been focused on determining the dissolution kinetics of UO2under a wide variety of temperature and redox
conditions.2,3 However, dissolution rates determined from natural uraninite (UO2) ore weathering indicate that rates
measured in the laboratory are orders of magnitude greater than in nature.4,5 This phenomenon has been widely considered and is attributed to a number of factors including artifacts of specimen preparation, solution saturation state, and changes in surface area with time.6Clearly, it is important to
the development of a robust postclosure safety case for spent fuel disposal that such uncertainty is reduced.
In the current study, we consider the role of “energetically reactive sites”, which contain fewer, and weaker, chemical bonds than those on defect-free surfaces or in the bulk, in the determination of laboratory dissolution rates of spent UO2fuel.
These sites, which may include natural crystal defects (point defects and dislocations), grain boundaries, or sample preparation-induced artifacts (e.g., polishing scratches or sharp edges on crushed particles), comprise atoms that have greater reactivity than those in the defect-free surfaces or in the bulk, thus may dissolve more rapidly.7,8 For example, the dissolution of UO2and a CeO2 analogue for UO2have been
found to be influenced by sample crushing9,10and polishing;11 dissolution rates were overestimated by 3 orders of magnitude due to the reactive surface sites induced through these sample preparation techniques.11Natural defects, especially randomly distributed oxygen vacancy defects, dominate the lattice
Received: November 23, 2015
Accepted: March 29, 2016
Published: March 29, 2016
Research Article
www.acsami.org License, which permits unrestricted use, distribution and reproduction in any medium,
structure of spent UO2 fuel, due to the incorporation of trivalent rare earthfission products in the UO2lattice.12It has
been hypothesized that the presence of such energetically reactive defect sites may influence the dissolution rate.13−18 However, the extent of such an effect on the overall dissolution rate is difficult to observe when other factors, such as the enhanced solubility of U(VI) over U(IV), strongly influence the dissolution behavior. Recent work by the current authors has shown that these seemingly minor features may significantly influence theinitialdissolution rate of UO2fuel analogues11,19 and, therefore, should be taken into consideration alongside other important factors (notably oxidation, solubility, and radiolysis) when understanding dissolution mechanisms of spent fuel.
In an attempt to preclude the dominant effects of U(IV) oxidation, the high solubility of U(VI) and radiolysis on the dissolution kinetics, we here report the role of energetically reactive features on the dissolution of a UO2analogue, CeO2,
that was developed to closely resemble the microstructure of UO2fuel.20Both UO2and CeO2crystallize in the samefl
uorite-type structure (Fm3̅m) and can be engineered to have similar grain sizes and crystallographically randomly orientated grains. We describe an evaluation of how energetically reactive sites, including intrinsic surface defects and oxygen vacancies, influence dissolution kinetics. Through quantification of these effects, we attempt to improve our understanding of the uncertainties associated with dissolution rates of spent fuel in geological disposal conditions.
2. EXPERIMENTAL METHODS
2.1. CeO2Preparation.Cerium dioxide monoliths were prepared according to Stennett et al.,20at a sintering temperature of 1700°C. Monoliths were crushed using a percussion mortar and ball mill, sieved to four different size fractions, 25−50μm, 75−150μm, 300−600μm, and 2−4 mm, and washed, all according to ASTM C1285 (the Product Consistency Test).21 Prior to use, the particles were inspected by Scanning Electron Microscopy (SEM) to ensure nofine particles <1 μm in size remained adhered to particle surfaces. Particles in the size fraction 25−50μm were subjected to further heat treatment; annealing in air was performed in a standard muffle furnace heated to 300, 400, 600, 800, 1000, and 1250°C at a ramp rate of 5°C min−1and held for
4 h. Annealing in inert (Ar) and reducing (5% H2/95% N2)
atmospheres was performed in a standard tube furnace, sealed, and purged with gas for 2 h prior to heating to 1000°C at a ramp rate of 5 °C min−1and held for 4 h. Following dissolution, particles were dried
by patting with tissue and placed in an inert-atmosphere desiccator prior to analysis.
2.2. Particle Characterization.The surface area of each crushed size fraction and the 25−50μm heat-treated particles was determined using the Brunauer, Emmett, and Teller (BET) method, using a nitrogen adsorbate. Particles were degassed for 3 h at 200 °C and analyzed using a Beckman Coulter SA3100 instrument. The surface oxidation state of annealed particles was determined using a Kratos Axis Ultra X-ray Photoelectron Spectrometer (XPS) with a monochromatic Al Kαsource. The spectral intensities recorded were converted to surface oxidation state concentrations byfirst subtracting a Shirley-type background22 and then obtaining accurate peak positions by fitting peaks using a mixed Gaussian/Lorenzian line shape. All photoelectron binding energies were referenced to C 1s adventitious contamination peaks at a binding energy of 285 eV.
Powder X-ray Diffraction (XRD) patterns were acquired using a Bruker D2 Phaser diffractometer operating in reflection mode at 30 kV and 10 mA with Cu Kα1radiation. Data were collected between 20 <
2θ < 60° at 2° min−1 and a step size of 0.02°. Rietveld analysis of
phases identified in the diffraction patterns was performed using the refinement software, Topas (Bruker), and strain was calculated using
the Double-Voigt approach.23Secondary electron images of particles were acquired using a Hitachi TM3030 SEM, operating at an accelerating voltage of 15 kV and a working distance of 18 mm.
2.3. CeO2Dissolution.Samples of 0.1 g of each size fraction of CeO2particles were placed in 50 mL PTFE vessels, which had been
cleaned according to ASTM C1285.21Each vessel wasfilled with 40 mL of 0.01 M HNO3(pH 2.0), sealed, and placed within a Carbolite
oven. For 25−50 μm CeO2 particles with no annealing treatment,
experiments were performed at 40, 70, and 90°C (±0.5°C). All other experiments were performed at 90 (±0.5)°C. Each experiment was performed in triplicate with duplicate blanks, and sampling was conducted at regular intervals from 0 to 35 days. During each sampling, an aliquot (1.2 mL) of the supernatant liquid in each vessel was removed andfiltered (0.22μm) prior to analysis by Inductively Coupled Plasma − Mass Spectroscopy (ICP-MS) (Agilent 4500 Spectrometer). Solution data expressed as the normalized weight loss (NL, expressed in g m−2) were calculated from the Ce concentrations
after normalization by the surface areaS(m2) of the sample in contact
with the solution (assuming that all the surface is“reactive”) and by the mass loading of the element considered in the solid (i.e., fi is expressed as the ratio between the mass of the considered element and the overall mass of the leached sample), according toeq 124,25
= ×
N i m
f S
( ) i i L
(1)
where mi (g) corresponds to the total amount of the element i measured in the solution.
Derivation of eq 1 as a function of dissolution time gives the normalized dissolution rate of Ce (RL(Ce)), expressed in g m−2d−1)26
= =
× ×
=
× × × ≈ × ×
R N
t f S
m t
f S t C V
V
f S
C t
(Ce) d (Ce) d
1 d
d
1 d
d ( )
d d L L Ce Ce Ce Ce Ce Ce (2)
whereCCe(g L−1) is the concentration of Ce in solution, andV(L) is
volume of leachate. In this expression, thefCeandSvalues are usually
assumed to remain almost constant during the leaching experiments, which can be considered as a valid assumption at the beginning of the dissolution tests for powdered samples.
3. RESULTS
3.1. Characterization of Defect Structures in CeO2.
Particles from the 25−50μm size fraction were annealed in air at temperatures ranging from 300−1250 °C. One sample was analyzed without annealing for comparison. High temperature annealing in air lead to a reduction in surface area, as shown in
Figure 1. For example, annealing at 600°C gave a surface area of 0.20±0.01 m2 g−1, while at 1000°C the surface area was
0.11 ± 0.01 m2 g−1. We hypothesize that the surface area decrease reflects the removal of “sharp edges” and other intrinsic surface defects in the CeO2particles, during heating.
When the annealing temperature was increased to the range 700 to 1250°C, a sharp drop in surface area was observed. This may be due to agglomeration of particles at these higher temperatures. Dissolution rate investigation was performed on samples annealed at 600 and 1000°C; both were representative of the removal of“sharp edges” and intrinsic surface defects, but samples annealed at 1000 °C additionally represented particles with a significantly lower surface area.
An attempt to generate oxygen vacancies in particles of CeO2 in the 25−50μm size fraction was made by annealing at 1000
°C in the absence of oxygen (inert or reducing environments). The creation of an oxygen vacancy in CeO2is accompanied by
Ce2O3 occurs through the formation of CeO2‑x intermediate
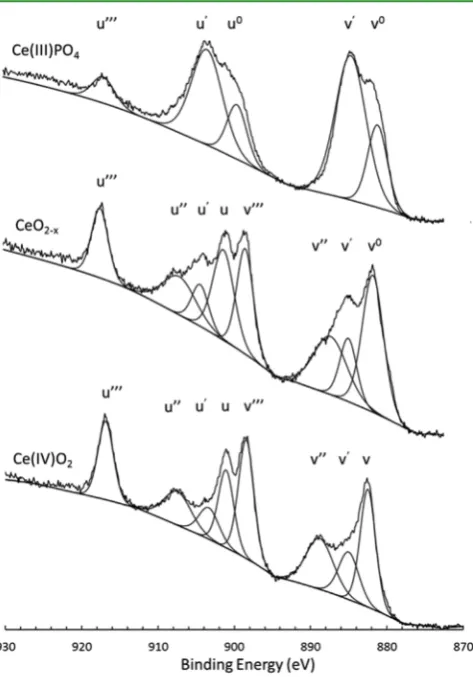
[image:3.625.60.300.62.234.2]phases;28 to confirm the presence of oxygen vacancies, the oxidation state of Ce was determined using XPS, shown in
Figure 2. Trivalent Ce was identified in the particle surfaces (top ∼10 nm), confirming that Ce4+ reduction to Ce3+ had
occurred. The Ce 3d XPS data were resolved using ten components;29 Table 1 describes each of the components found in the current study according to the accepted Burroughs nomenclature.30 These data are in excellent agreement with previously published XPS data for partially reduced CeO2
31,32
and show that samples annealed in an inert or reducing environment were not fully reduced to Ce2O3but contained a
combination of identifiable contributions from both Ce3+ and
Ce4+oxidation states at the sample surface. This indicates the formation of partially reduced CeO2 with a stoichiometry of CeO2‑xand the generation of oxygen vacancies. These defects
have been previously characterized as Frenkel-type defects.33 The fraction of Ce3+(denoted α) was determined from Ce 3d peak area analysis, according toeq 3. On the basis that half an oxygen vacancy is formed per Ce3+created, the deviation,x, from the ideal oxygen stoichiometry was determined for each sample, as shown inTable 2
α=
∑ + Ce
Ce
3
(3)
Annealing in a reducing (H2/N2) atmosphere resulted in
CeO2‑xwith the greatest Ce3+fraction (α= 0.370±0.019) and
a stoichiometry of CeO1.82, while annealing in an inert (Ar)
atmosphere gave a higher Ce3+ fraction than annealing in air
under the same conditions (α= 0.221±0.011 andα= 0.080± 0.004, respectively). As the Ce3+fraction is directly related to
the concentration of oxygen vacancies generated, it can be assumed that the oxygen vacancy concentration is proportional to the Ce3+fraction of each sample.
[image:3.625.323.564.107.243.2]The crystal structure of nonstoichiometric CeO2‑x was determined using X-ray diffraction. Because the samples were Figure 1. Surface area analysis of CeO2 25−50 μm particles as a
[image:3.625.63.300.348.687.2]function of annealing temperature, as determined by the BET method. Errors represent 1σfrom triplicate samples.
Figure 2. X-ray photoelectron oxidation state analysis of CeO2
annealed under reducing conditions, showing Ce 3d spectra for CeO2‑xannealed in a reducing (H2/N2) atmosphere. Standard spectra
for Ce3+- and Ce4+-containing materials are shown for comparison.
Peak deconvolution was performed and labeled according to the accepted Burroughs nomenclature30for Ce 3d as described inTable 1.
Table 1. Experimental Binding Energies and FWHM for Ce 3d Peaks Derived from a CePO4Standard and CeO2and CeO2‑xParticles Investigated in the Current Study
Ce 3d peak assignment
oxidation state assignment
binding energy (eV) (±0.1)
fwhm (eV) (±0.05)
v0 3+ 881.90 3.0
V 3+ 882.40 1.8
v′ 4+ 885.30 4.3
v″ 4+ 888.40 4.2
v‴ 4+ 898.50 2.3
u0 3+ 899.95 3.0
U 3+ 901.10 1.8
u′ 4+ 903.00 4.3
u″ 4+ 907.60 4.2
u‴ 4+ 916.80 2.3
Table 2. Calculated Surface Stoichiometry and Ce3+Fraction (α) of Samples and Standards Investigated in This Study, as Determined from Ce 3d XPS Dataa
sample treatment surface stoichiometry α
Ce(III)PO4standard 0.952±0.051
H2/N2atmosphere 1000°C CeO1.82 0.370±0.019 Ar atmosphere 1000°C CeO1.89 0.221±0.011
air 1000°C CeO1.96 0.080±0.004
air 600°C CeO1.93 0.143±0.007
air - no annealing CeO1.99 0.021±0.008
aErrors quoted for α are standard deviations based upon duplicate
XPS scans on each sample.
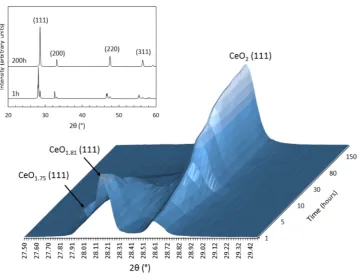
found to be chemically unstable upon exposure to air, they were loaded into the diffractometer within minutes of being removed from the annealing furnace. By comparison to the known correlation of the fluorite lattice parameter with the oxygen stoichiometry in the CeO2‑xsystem,34the three main diffraction
peaks identified inFigure 3were assigned to CeO1.75, CeO1.81,
and CeO2. The second phase is in reasonable agreement with the XPS analysis of this sample, which gave a stoichiometry of CeO1.82 (Table 2). The CeO1.75 phase was not identified by
XPS; this may be due to the rapid oxidation, as described below. The spatial distribution of the phases within the samples was not investigated, however, since Ce3+ species have previously been found to accumulate at grain boundaries within partially reduced CeO2,35 grain boundaries may host
CeO1.75 and CeO1.81. The identification of these phases
following annealing in a reducing atmosphere is consistent with the formation of oxygen vacancies.34
With prolonged exposure to ambient conditions (air, for up to 200 h), the relative intensity of the peaks assigned to CeO1.75, CeO1.81, and CeO2 changed (Figure 3). Quantitative Rietveld
analysis of the distribution of phases as a function of time is shown inFigure 4. Initially, the sample was composed of∼15% CeO1.75,∼68% CeO1.81, and∼16% CeO2(±1.0%). After 56 h,
CeO1.75was no longer observed, and the distribution of phases
remained at 4.5±0.9% CeO1.81and 95.2±1.3% CeO2(Figure 4) until 200 h. The increase in the content of oxygen, corresponding to a decrease in oxygen vacancies, was found to occur at a rate of (1.40±0.14)×10−3mol h−1during thefirst 24 h of exposure to ambient conditions. This process was associated with a change in the volume of thefluorite unit cell, as calculated from Rietveld-refined lattice parameters. The fluorite unit cell was found to contract, from 167.62± 3.4 Å3
for CeO1.75 to 164.97±3.30 Å3for CeO1.81and to 157.58 ±
3.15 Å3for CeO2. This volume reduction is consistent with the
oxidation of Ce3+to Ce4+; Ce3+has a larger ionic radius than
Ce4+ (1.03 and 0.97 Å, respectively).36 Overall, the sample annealed in a H2/N2 atmosphere underwent a 6% volume contraction within several hours of exposure to oxygen under ambient atmospheric conditions. The lattice strain, as calculated using Rietveld analysis of the CeO2 phase, was found to
[image:4.625.134.496.63.337.2]significantly decrease during oxidation, from a value of ε = 0.092±0.01 at 2 h toε= 0.034±0.01 after 200 h, consistent Figure 3.X-ray diffraction data for CeO2‑xformed by annealing CeO2at 1000°C under a reducing atmosphere (H2/N2). XRD patterns were
recorded, in air, at regular periods from 0.76 to 200 h after annealing. Correlation of thefluorite lattice parameter with the known oxygen stoichiometry in the CeO2‑xsystem31allowed diffraction peaks to be identified as CeO1.75, CeO1.81, and CeO2. Inset shows full diffraction patterns
recorded at 1 h and 200 h, indexing peaks for CeO2.
Figure 4.Weight fraction of CeO2 and CeO2‑x phases present in a sample of CeO2 annealed at 1000°C in a H2/N2 atmosphere as a
function of time, as determined by quantitative Rietveld analysis of powder XRD patterns. After 56 h, there was no further change in the distribution of phases up to 200 h of observation. Errors are ±3% based on Rietveld analysis methods.
[image:4.625.330.561.392.580.2]with the observed change in lattice volume. Due to the rapid nature of these chemical and structural changes, all dissolution experiments were performed within 30 min of sample annealing to minimize the effects of air oxidation.
3.2. CeO2 Dissolution.Cerium dioxide dissolution
experi-ments were performed under aggressive conditions (0.01 M HNO3, 90 °C) to attain quantitative dissolution kinetic data within several weeks. It has been suggested that reduction of Ce4+to Ce3+may be induced by nitrous acid (HNO
2) formed
through nitric acid instability at high acidity (>0.5 M);13 however, this is not expected to influence the dissolution reaction in the current experiments, which were at an acidity much less than 0.5 M.
The dissolution of CeO2 can be described by two distinct
regimes, as shown inFigure 5; thefirst, rapid regime is far from
solution saturation and thus represents the kinetically controlled dissolution rate, Rk. The second regime is
representative of near-solution saturation, controlled by the solubility of CeO2and concentration of Ce(OH)22+in solution.
This is less rapid due to thermodynamic effects that occur close to equilibrium and is denoted Rt. To understand the role of
defects in the dissolution of CeO2, it was necessary to focus only on the kinetic regime of dissolution; therefore, we herein reportRk only. Generally, the change between the kinetic and the thermodynamically controlled dissolution regimes occurred at ∼7 days, unless otherwise stated. Figure 5 shows the normalized mass loss of Ce (NL, g m−2) from nonannealed 25−
50μm particles of CeO2as a function of time at 40, 70, and 90
°C. The normalized dissolution rate of Ce wasRk = (1.90 ±
0.74) × 10−4 g m−2 d−1 at 90 °C. The dependence of dissolution on temperature gave an activation energy of 30.4± 4 kJ mol−1, assuming an Arrhenius-type relationship. This is consistent with previous work on CeO2and otherfluorite-type
dioxides such as ThO2and PuO2(Ea= 20−37 kJ mol−1)13,25,37 and is indicative of a surface-controlled dissolution mechanism. 3.3. Effect of Defect Annealing/Surface Area on CeO2
Dissolution Kinetics. The dissolution rates of 25−50 μm particles of CeO2 annealed in air, and nonannealed CeO2of four different particle sizes, are shown inTable 3andFigure 6.
The surface area normalized dissolution rates were observed to increase with increasing surface area. This behavior is unexpected, since normalization to the surface area should result in similar dissolution rates. Samples of CeO2that were
crushed and sieved to different size fractions clearly showed this correlation, with dissolution rates increasing fromRk= (4.17±
[image:5.625.322.564.128.312.2]1.13)×10−5g m−2d−1for 2−4 mm particles toRk= (1.38± 0.28) ×10−4g m−2d−1 for particles in the 75−150 μm size fraction. The exposure of grain boundaries during particle crushing may be responsible for enhancing the reactive surface area, resulting in the observed trend, as follows: each particle is composed of a number of grains, with a grain size of 5−30μm. As the particle size decreases, from 2−4 mm to 75−150 μm, the ratio of particle size to the number of grains also decreases. Because the grain size remains constant, the shrinking size of the particle exposes more grain boundaries to the dissolution medium. Grain boundaries are known to preferentially dissolve due to the presence of a greater number of energetically Figure 5.Concentration of Ce, normalized to surface area (g m−2) for
non-annealed CeO2 particles 25−50μm in size, reacted in 0.01 M
HNO3at 40, 70, and 90°C, as a function of time. Graph depicts the
two main dissolution rates observed, kinetically controlled dissolution (Rk) and thermodynamic effect-controlled dissolution (Rt). Errors
represent 1σfrom triplicate samples.
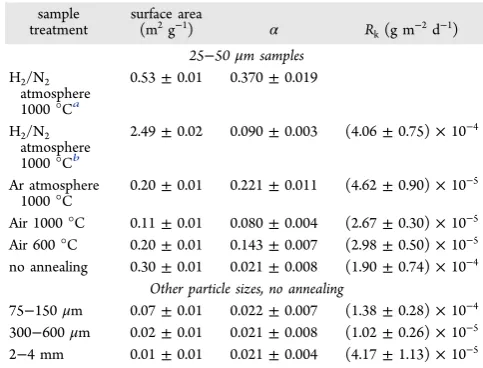
Table 3. Calculated Dissolution Rates (Rk) for CeO2and CeO2‑xReacted in 0.01 M HNO3at 90°C between 0 and 35 Days of Dissolution, with the Corresponding Measured Surface Area and Oxygen Vacancy Content (Ce3+ Fraction,
α)
sample treatment
surface area
(m2g−1) α R
k(g m−2d−1) 25−50μm samples
H2/N2 atmosphere 1000°Ca
0.53±0.01 0.370±0.019
H2/N2 atmosphere 1000°Cb
2.49±0.02 0.090±0.003 (4.06±0.75)×10−4
Ar atmosphere 1000°C
0.20±0.01 0.221±0.011 (4.62±0.90)×10−5
Air 1000°C 0.11±0.01 0.080±0.004 (2.67±0.30)×10−5 Air 600°C 0.20±0.01 0.143±0.007 (2.98±0.50)×10−5 no annealing 0.30±0.01 0.021±0.008 (1.90±0.74)×10−4
Other particle sizes, no annealing
75−150μm 0.07±0.01 0.022±0.007 (1.38±0.28)×10−4 300−600μm 0.02±0.01 0.021±0.008 (1.02±0.26)×10−5 2−4 mm 0.01±0.01 0.021±0.004 (4.17±1.13)×10−5
aInitial surface area and Ce3+ fraction, measured within minutes of
[image:5.625.66.296.238.409.2]removal of furnace.bSurface area and Ce3+fraction, measured 1 day after dissolution.
Figure 6.Normalized dissolution rates of Ce, Rk (g m−2 d−1) as a
function of specific surface area and particle size.
[image:5.625.323.565.350.524.2]reactive surface sites (e.g., defects) compared to the surfaces.11 Once the smallest particle size is reached, each particle comprises only a few grains, with a high number of grain boundaries exposed to solution, which leads to the most rapid dissolution rates (Figure 6).
Similarly, thermally annealed particles of CeO2with the same
particle size (25−50 μm) exhibited a factor of 7 decrease in their dissolution rate compared with nonannealed particles (Rk
= (2.98±0.50)×10−5g m−2d−1and (2.67±0.30)×10−5g m−2d−1, for 600 and 1000°C respectively), as shown inFigure 7. Because the reduction in surface area in these samples was
associated with the high temperature annealing of intrinsic defects and sharp edges generated through sample crushing, it can be concluded that these energetically reactive features influence the dissolution kinetics. This is in agreement with the
work of Claparede et al.13 who found that increasing the sintering temperature of Th1−xCexO2 powders led to a
reduction in dissolution rate, attributed to the elimination of crystal defects and amorphous domains. The current work extends this hypothesis to samples prepared by crushing, generating surface defects in the form of “sharp edges”, as proposed by Corkhill et al.11
3.4. Effect of Oxygen Vacancies on Dissolution Kinetics.For CeO2samples annealed in different atmospheres
at 1000 °C, the samples with the greatest oxygen vacancy content were found to dissolve at the most rapid rates. For example, the dissolution rate of CeO2 annealed in Ar was
slightly enhanced compared with CeO2annealed in air at the
same temperature, by a factor of 2 (Table 3). The dissolution of CeO1.82(annealed in H2/N2) showed a significantly enhanced
dissolution rate (Table 3, Figure 7). Samples of this material were analyzed by SEM at several time points during dissolution; in contrast to particles of stoichiometric CeO2,
which did not change their shape or morphology upon 1 or 35 days of dissolution (Figure 8a−c), examination of the CeO1.82
particles revealed a dramatic transformation. Prior to dissolution, these particles were 25−50 μm in size (Figure 6d), but within 1 day they were observed to break apart into smaller fragments∼5μm in size, with a morphology suggestive of individual grains (Figure 8e). After 35 days of dissolution, some larger particles remained, but most of the sample had decomposed into single grain-sized fragments (Figure 8f). Post-dissolution BET analysis of these samples after 1 day of dissolution gave a surface area of 2.49 ± 0.01 m2 g−1, an increase by a factor of 5 compared with the initial surface area (Table 3). Normalization of the dissolution rate data to this surface area value gave a rate ofRk = (4.06± 0.75)×10−4g
m−2d−1, 15 times greater than for air or Ar annealed samples of the same particle size (Figure 7). Due to the extremely rapid dissolution of this material, it was necessary to calculate theRk
between 0 and 1 day of dissolution, after which time the Figure 7.Summary of the normalized dissolution rates of Ce,Rk(g
m−2d−1) as a function of particle size and annealing in air, Ar, and H 2/
N2atmospheres.
Figure 8.SEM images of 25−50μm particles of non-annealed CeO2(a) prior to dissolution and after dissolution in 0.01 M HNO3at 90°C for (b)
1 day and (c) 35 days; and H2/N2annealed CeO2‑x(d) prior to dissolution; and after dissolution in 0.01 M HNO3at 90°C for (e) 1 h and (f) 35
days.
normalized release of Ce was constant. When analyzed by XPS after 1 day of dissolution, these samples gave a surface stoichiometry of CeO1.96, which indicates that a rapid oxidation of CeO2‑x occurred, concurrent with a significant reduction in
the oxygen vacancy content.
4. DISCUSSION
4.1. Microstructure and Surface Defect−Dissolution Rate Relationship in CeO2 and CeO2‑x. A first-order
expression that describes the concentration of Ce (C) as a function of time (t) has been considered
= − −
C A(1 e bt) (4)
where A is the solubility limit of CeO2, and b is the rate
constant. Expanding eq 4 to account for the factors that are expected to contribute to the dissolution kinetics (surface area, oxygen vacancy content, and the different relative solubilities of Ce3+and Ce4+) afirst order dissolution rate expression can be derived for the CeO2samples investigated in this study
α α
= − − + − − −
C S
S [ A(1 e ) (1 )A (1 e )]
b t b t
0
3 3 4 4
(5)
whereS is the measured surface area (after dissolution in the case of CeO2‑x),S0is a reference surface area of 1 m2g−1,αis
the fraction of Ce3+(representing the oxygen vacancy content)
at the particle surface as determined by XPS, A3 and A4
correspond to the solubility limits of Ce3+ and Ce4+
respectively, and b3 and b4 are the rate constants for Ce3+
and Ce4+.
A genetic algorithm, which can be applied to solve constrained optimization problems,38 was used to fit the individual parameters ineq 5, providing optimum solubility and rate constant values for Ce3+and Ce4+based on the dissolution
data obtained in this study; the data and modelfits are shown inFigure 9. The modeled Ce3+and Ce4+solubilities,A
3andA4,
gave best-fit values of (5.10±0.54)×10−4mol dm−3and (1.59
±0.08)×10−6mol dm−3, respectively (errors represent the 1σ confidence interval). These are in reasonable agreement with geochemically modeled solubility values, for example, Ce4+
solubility was calculated using PHREEQC (LLNL database) to be 4.01 × 10⁻⁶ mol dm−3. When considering only CeO2 annealed at various temperatures in air, and CeO2particles of
different sizes (shown in Figures 9a and b, respectively), the rate constant for Ce3+was found to beb3= (0.245±0.06) d−1.
For Ce4+the scatter in the experimental data, combined with
[image:7.625.326.563.69.561.2]the low absolute solubility limit, resulted in poorly defined estimates for b4; a value of the order 1.00 × 10⁻⁷ d−1 is tentatively suggested. Because the model to data fit was in agreement for CeO2(Figure 9a and b), and the solubilities of the different Ce oxidation states were similar to geochemically modeled solubility values, it can be surmised that the parameters ineq 5adequately describe the dissolution rate of stoichiometric CeO2.
Figure 9c shows the dissolution data and modelfit for CeO2‑x
samples annealed in Ar and H2/N2atmospheres. The modelfit to the parameters in eq 5 agrees somewhat with samples annealed in Ar; however, the modelfit to the parameters is not in agreement with data from samples annealed in H2/N2,
despite normalization to the post-dissolution surface area and consideration for the elevated content of the more highly soluble Ce3+species in this sample (eq 5). Surface area data in Table 3show that during dissolution, the surface area of CeO2‑x
annealed in a H2/N2atmosphere increased by a factor of 5 after
1 day of dissolution. The first order dissolution model described above predicts that a surface area increase of a factor of 50 would be required to create a goodfit to the parameters ineq 5, assuming all other values are correct. Specific surface area, as measured by BET, is routinely accepted to be the same as reactive surface area. However, recent studies have discussed that this may not necessarily be the case due to different activation energies of different high energy surface sites, e.g., Figure 9.Ce concentrations (mol dm−3) derived from dissolution at 90°C in 0.01 M HNO3(points) compared with modeledfit toeq 5
(lines) for (a) 25−50 μm CeO2 subject to different annealing
temperatures in air; (b) CeO2crushed to different size fractions, with
no subsequent annealing; and (c) 25−50 μm CeO2 subject to
annealing in different atmospheres at 1000°C. The parameters ineq 5 do not fit the data for H2/N2 annealed samples shown in (c),
suggesting another factor may contribute to the dissolution rate.
grain boundaries and oxygen vacancies.39It is possible that the BET surface area measurements taken here, 1 day after dissolution, underestimated the reactive surface area of these samples during the initial stages of dissolution due to the presence of a high proportion of exposed grain boundaries, which are known to be significantly more reactive than the bulk. 4.2. Physical Effects of Oxidation on the Kinetics of Dissolution. As described above, not only the enhanced chemical solubility of Ce3+influenced the dissolution kinetics of CeO2‑xbut also the physical effects leading to a change in the
sample surface area played a significant role. The mechanism through which this is postulated to occur for CeO2‑x
investigated in the current study is described below.
Upon contact with air or an oxic solution, the Ce3+ions in CeO2‑x, present as a result of charge compensation for oxygen vacancies, were rapidly oxidized to Ce4+. Due to the difference in ionic radius between Ce3+ and Ce4+(with Ce4+the smaller cation), this oxidation process was associated with a contraction of thefluorite unit cell volume, on the order ofΔV=−3.25± 0.06 Å3according to Rietveld analysis of XRD data (a 6.0 ±
0.1% volume decrease relative to the starting volume). Ceramic materials that have undergone volume change-related phase transition exhibit significant internal lattice strain; according to Rietveld analysis, the lattice strain was initially high in CeO2‑x,
reducing by a factor of 2.6 during oxidation to CeO2.
Additionally, the presence of oxygen vacancies results in enhanced oxygen mobility, especially at grain boundaries where it is expected that a higher proportion of Ce3+ exists;35 this facilitates preferential dissolution of grain boundaries.11In this study, during the dissolution of CeO1.82 to CeO1.96, the
combined influence of lattice strain and enhanced oxygen mobility, created by the removal of oxygen vacancies, resulted in the disintegration of particles, preferentially along grain boundaries, producing individual grain-sized fragments after 1 day of dissolution (Figure 8e−f). Importantly, this resulted in an increase in reactive surface area, which exposed fresh surfaces for dissolution and enhanced the overall dissolution rate. After 1 day, the dissolution rate was observed to be more or less constant, likely because there is reduced oxygen atom mobility within the nearly stoichiometric CeO1.96. Hence, the
combined roles of oxygen vacancies and grain boundaries should be considered significant in defining the dissolution kinetics of nonstoichiometric CeO2 and other fluorite-type materials.
The dual role of oxygen vacancies and grain boundaries in dissolution has been observed in otherfluorite-type materials, albeit those comprisising a solid solution of different chemical species. For example, Horlait et al.17reported the “crumbling” of Ce1−xLnxO2‑x/2 materials along grain boundaries during
dissolution. This was associated with an increase in reactive surface area by up to a factor of 5. It was postulated that the incorporation of Ln3+played a significant role in the dissolution mechanism through changes to the lattice volume.17,40 Similarly, Finkeldei et al.41 found that defect fluorite and pyrochlore structures in the ZrO2−Nd2O3group preferentially dissolved along grain boundaries and at triple junctions, leading to disintegration. Substitution of elements into afluorite lattice results in a volume change due to the difference in ionic radius of the substituting element;36the current study highlights the equally important role of oxygen vacancies on lattice volume change when only a single chemical species is present (CeO2),
confirming the importance of this defect feature in dissolution rate kinetics.
The association of defect structures with grain boundaries and their influence on the dissolution of CeO2 and ThO2
analogues for spent fuel was recently hypothesized by Corkhill et al.,11 who showed that the dissolution of grain boundaries was influenced by the crystallographic orientation of the grains and the corresponding mean misorientation angle of the grain boundaries. Boundaries with higher mean misorientation angles were found to dissolve at faster rates than those with low mean misorientation angles; it was hypothesized that higher misorientation angle grain boundaries contained a greater proportion of defects, with a high reactive surface area, which led to the enhanced dissolution rates. This study and others17,18 have highlighted the important role of grain boundaries and particularly their association with defect structures (e.g., oxygen vacancies) on dissolution processes in spent fuel analogues. This underlines the requirement for new methodologies capable of linking grain boundary structure with dissolution kinetics, to fully understand their role in the dissolution of spent fuel materials.42
4.3. Implications for the Dissolution of Spent Fuels.It was recently demonstrated for a suite offluorite type materials, including CeO2, CaF2, and UO2, that the surface stability is
correlated with the proportion of high energy surfaces, even when different chemical processes of dissolution occur, for example for CeO2 and CaF2.8 ThO2 has also been shown to confirm this hypothesis.11,19 Together with the resulted presented herein, these findings highlight the potential for energetically reactive surface sites to play a role in UO2
dissolution.
Spent UO2fuel forms a complicated defect structure during
fission within a reactor, and it is not yet clear the extent to which different types of reactive surface sites may influence the dissolution kinetics of spent fuel; however, studies on SIMFUEL have shown that doping with trivalent rare elements (to simulate fission products) resulted in lattice contraction12 and a loss of cubic symmetry. On the basis of the results presented in the current study, we can hypothesize that such a lattice modification may lead to grain boundary decohesion. Evidence supporting this hypothesis includes a study of UO2 fuel stored in aerated, moist environments, which was found to degrade along its grain boundaries and become heavily fractured.43 The effects of lattice volume change on the integrity of grain boundaries in these materials, and the extent to which it may affect the dissolution kinetics, requires further exploration. Recent work has shown that Mixed Oxide Fuels (MOx), containing Pu3+, with a PuO2‑x stoichiometry of
PuO1.61,44 may also be prone to accommodating oxygen vacancies,45although the distribution of such defects between grains and the grain boundaries is currently not known. In light of the current limited knowledge of the atomic-scale structure of spent fuels, further work is required on inactive analogues, UO2, and spent fuel materials to ascertain the effects of reactive
surface sites on dissolution kinetics, as distinct from oxidative dissolution or radiolysis effects, to reduce the uncertainty associated with the prediction of spent fuel dissolution within a geological disposal facility.
5. CONCLUSIONS
We present an investigation of the role of energetically reactive surface sites on the initial dissolution rate of CeO2to ascertain whether these features may result in overestimation of dissolution rates in the laboratory. Reactive surface sites and
“sharp edges” were simulated by crushing samples to different
size fractions and through high temperature annealing. Oxygen vacancy defects in CeO2‑xwere generated by high temperature
annealing in oxygen-free conditions. Surface area was used as a measurement of “sharp edges” and intrinsic defects, and the total Ce3+ fraction measured by XPS was used as a
measurement of the oxygen vacancy concentration. The relative dissolution rates of these materials showed that there was a quantifiable relationship between energetically reactive surface sites and dissolution rate, which was dependent upon reactive surface site concentration and the solubilities of Ce3+and Ce4+; the greater the concentration of reactive surface sites, the higher the dissolution rate. The elimination of oxygen vacancies in CeO2‑xwas found to significantly influence the dissolution rate; this was associated with changes in the lattice volume and lattice strain, manifested as grain boundary decohesion and increased surface area. Thus, it is clear that reactive surface sites, including artifacts of sample preparation, intrinsic material defects, and grain boundaries, have the potential to significantly enhance the dissolution of spent oxide fuel. We show that such effects can be quantified, thus it is possible to reduce the uncertainty associated with laboratory measurements of UO2 dissolution, albeit in a simplified analogue system. It will be essential to develop further careful studies designed to interrogate the effect of reactive surface features on the durability and dissolution of materials such as UO2and MOx, as distinct from solubility, surface area, and radiation effects.
■
AUTHOR INFORMATIONCorresponding Authors
*Phone: 44 (0)1142223632. E-mail:c.corkhill@sheffield.ac.uk.
*Phone: 44 (0)1142225502. E-mail:n.c.hyatt@sheffield.ac.uk.
Notes
The authors declare no competingfinancial interest.
■
ACKNOWLEDGMENTSThe research leading to these results has received funding from the European Atomic Energy Community’s Seventh Frame-work Programme (FP7) under grant agreement No. 269903, The REDUPP (REDucing Uncertainty in Performance Prediction) project. We wish to give special thanks to the late Dr. Paul Wincott (University of Manchester) for assistance with XPS data collection. We are grateful to Dr. Virginia Oversby and Dr. Lena Z. Evins for invaluable discussion and support throughout the project. C.L.C. is grateful to The University of Sheffield for the award of a Vice Chancellor’s Fellowship and EPSRC for the award of an ECR Fellowship (EP/N017374/1), N.C.H. acknowledges support from the Royal Academy of Engineering and the Nuclear Decom-missioning Authority for funding, D.J.B. acknowledgesfinancial support from the EPSRC Nuclear FiRST Doctoral Training Centre (EP/G037140/1), and F.Y.T. acknowledges support from the EPSRC PACIFIC programme (EP/L018616/1). We thank EPSRC and University of Sheffield Knowledge Transfer Account, under grant reference EP/H500170/1 for financial support. This research was performed, in part, at the MIDAS facility, at the University of Sheffield, which was established with support from the Department of Energy and Climate Change.
■
REFERENCES(1) Cui, D.; Low, J.; Spahiu, K. Environmental Behaviours of Spent Nuclear Fuel and Canister Materials. Energy Environ. Sci. 2011, 4, 2537−2545.
(2) Oversby, V. M. Uranium Dioxide, SIMFUEL and Spent Fuel Dissolution Rates−A Review Of Published Data.SKB Technol. Rep.
1999, TR-99-22.
(3) Shoesmith, D. W. Used Fuel and Uranium Dioxide Dissolution Studies−A Review.Nucl. Waste Manage. Org. Rep.2007, NMWO TR-2007-03.
(4) Smellie, J.; Karlson, F. A Reappraisal of Some Cigar Lake Issues of Importance to Performance Assessment.SKB Technol. Rep. 1996, TR 96-08.
(5) Bruno, J.; Spahiu, K. The Long-Term Effect of Hydrogen on the UO2Spent Fuel Stability under Anoxic Conditions: Findings from the
Cigar Lake Natural Analogue Study.Appl. Geochem.2014,49, 178−
183.
(6) White, A. F.; Brantley, S. L. The Effect of Time in the Weathering of Silicate Minerals: Why do Weathering Rates Differ in the Laboratory and the Field?Chem. Geol.2003,202, 479−506.
(7) Fischer, C.; Kurganskaya, I.; Schafer, T.; Luttge, A. Variability of Crystal Surface Reactivity: What do we Know?Appl. Geochem.2014,
43, 132−157.
(8) Maldonado, P.; Godinho, J. R. A.; Evins, L. Z.; Oppeneer, P. M. Ab Initio Prediction of Surface Stability of Fluorite Materials and Experimental Verification.J. Phys. Chem. C2013,117, 6639−6650.
(9) Ollila, K.; Oversby, V. M. Dissolution of Unirradiated UO2and
UO2Doped with233U Under Reducing Conditions.SKB Technol. Rep.
2005, TR-05-07.
(10) Ollila, K. Dissolution of Unirradiated UO2and UO2Doped with 233U in 0.01M NaCl Under Anoxic and Reducing Conditions.Posiva
Oy Rep.2006, 2006−08.
(11) Corkhill, C. L.; Myllykylä, E.; Bailey, D. J.; Thornber, S. M.; Qi, J.; Maldonado, P.; Stennett, M. C.; Hamilton, A.; Hyatt, N. C. Contribution of Energetically Reactive Surface Features to the Dissolution of CeO2 and ThO2 Analogues for Spent Nuclear Fuel. ACS Appl. Mater. Interfaces2014,6, 12279−12289.
(12) Razdan, M.; Shoesmith, D. W. Influence of Trivalent-Dopants on the Structural and Electrochemical Properties of Uranium Dioxide (UO2).J. Electrochem. Soc.2014,161, H105−H113.
(13) Claparede, L.; Clavier, N.; Dacheux, N.; Mesbah, A.; Martinez, J.; Szenknect, S.; Moisy, P. Multiparametric Dissolution of Thorium-Cerium Dioxide Solutions.Inorg. Chem.2011,50, 11702−11714.
(14) Claparede, L.; Clavier, N.; Dacheux, N.; Moisy, P.; Podor, R.; Ravaux, J. Influence of Crystallisation State and Microstructure on the Chemical Durability of Cerium-Neodymium Mixed Oxides. Inorg. Chem.2011,50, 9059−9072.
(15) Horlait, D.; Clavier, N.; Szenknect, S.; Dacheux, N.; Dubois, V. Dissolution of Cerium(IV)- Lanthanide(III) Oxides: Comparative Effect of Chemical Composition, Temperature, and Acidity. Inorg. Chem.2012,51, 3868−3878.
(16) Horlait, D.; Tocino, F.; Clavier, N.; Dacheux, N.; Szenknect, S. Multiparametric Study of Th(1−x)Ln(x)O(2−x/2) Mixed Oxides
Dis-solution in Nitric Acid Media.J. Nucl. Mater.2012,429, 237−244.
(17) Horlait, D.; Claparede, L.; Tocino, F.; Clavier, N.; Ravaux, J.; Szenknect, S.; Podor, R.; Dacheux, N. Environmental SEM Monitoring of Ce1−xLnxO2−x/2 Mixed-Oxide Microstructural Evolution During
Dissolution.J. Mater. Chem. A2014,2, 5193−5203.
(18) Szenknect, S.; Mesbah, A.; Horlait, D.; Clavier, N.; Dourdain, S.; Ravaux, J.; Dacheux, N. Kinetics of Structural and Microstructural Changes at the Solid/Solution Interface During Dissolution of Cerium(IV)-Neodymium(III) Oxides. J. Phys. Chem. C 2012, 116, 12027−12037.
(19) Myllykylä, E.; Lavonen, T.; Stennett, M.; Corkhill, C.; Ollila, K.; Hyatt, N. Solution Composition and Particle Size Effects on the Dissolution and Solubility of a ThO2 Microstructural Analogue for
UO2Matrix of Nuclear Fuel.Radiochim. Acta2015,103, 565−576.
(20) Stennett, M. C.; Corkhill, C. L.; Marshall, L. A.; Hyatt, N. C. Preparation, Characterisation and Dissolution of a CeO2Analogue for
UO2Nuclear Fuel.J. Nucl. Mater.2013,432, 182−188.
The Product Consistency Test (PCT); ASTM C 1285-02; American Society for Testing and Materials: Philadelphia, 2008.
(22) Shirley, D. A. High Resolution X-Ray Photoemission Spectrum of Valence Bands of Gold.Phys. Rev. B1972,5, 4709−4714.
(23) Balzar, D. Voight-Function Model in Diffraction-Line Broad-ening Analysis. InMicrostructure Analysis from Diffraction; Snyder, R. L., Bunge, H. J., Fiala, J., Eds.; Int. Union of Crystall.: 1999.
(24) Thomas, A.; Dachuex, N.; Le Coustumer, P.; Brandel, V.; Genet, M. Kinetic and Thermodynamic Study of the Thorium Phosphate-Diphosphate Dissolution.J. Nucl. Mater.2000,281, 91−105.
(25) Claparede, L.; Tocino, F.; Szenknect, S.; Mesbah, A.; Clavier, N.; Moisy, P.; Dacheux, N. Dissolution of Th1‑xUxO2: Effects of
Chemical Composition and Microstructure.J. Nucl. Mater.2015,457, 304−316.
(26) Dacheux, N.; Le Dû, J.; Brandel, V.; Genet, M.; Decambox, P.; Moulin, C. Solubility Tests on Various Uranium (IV) Phosphates.New J. Chem.1996,20, 507−514.
(27) Stetsovych, V.; Pagliuca, F.; Dvorak, F.; Duchon, T.; Vorokhta, M.; Aulicka, M.; Lachnitt, J.; Schernich, S.; Matolinova, I.; Veltruska, K.; Skala, T.; Mazur, D.; Myslivecek, J.; Libuda, J.; Matlon, V. Epitaxial Cubic Ce2O3Films via Ce-CeO2Interfacial Reaction. J. Phys. Chem. Lett.2013,4, 866−871.
(28) Bevan, D. J. M. Ordered Intermediate Phases in the System CeO2−Ce2O3.J. Inorg. Nucl. Chem.1955,1, 49−59.
(29) Romeo, M.; Bak, K.; El Fallah, J.; Le Normand, F.; Hilaire, L. XPS Study of the Reduction of Cerium Dioxide.Surf. Interface Anal.
1993,20, 508−512.
(30) Burroughs, P.; Hamnet, A.; Orchard, A. F.; Thornton, G. Satellite Structure In The X-Ray Photoelectron Spectra of some Binary and Mixed Oxides of Lanthanum and Cerium. J. Chem. Soc., Dalton Trans.1976,17, 1686−1698.
(31) Pfau, A.; Schierbaum, K. D. The Electronic Structure of Stoichiometric and Reduced CeO2 Surfaces: An XPS, UPS and
HREELS Study.Surf. Sci.1994,321, 71−80.
(32) Mullins, D. R.; Overbury, S. H.; Huntley, D. R. Electron Spectroscopy of Single Crystal and Polycrystalline Cerium Oxide Surfaces.Surf. Sci.1998,409, 307−319.
(33) Mamontov, E.; Egami, T. Structural Defects in a Nano-Scale Powder of CeO2Studied by Pulsed Neutron Diffraction.J. Phys. Chem. Solids2000,61, 1345−1356.
(34) Kümmerle, E. A.; Heger, G. The Structures of C-Ce2O3+δ,
Ce7O12, and Ce11O20.J. Solid State Chem.1999,147, 485−500.
(35) Hojo, H.; Mizoguchi, T.; Ohta, H.; Findlay, S. D.; Shibata, N.; Yamamoto, T.; Ikuhara, Y. Atomic Structure of a CeO2 Grain
Boundary: The Role of Oxygen Vacancies.Nano Lett.2010,10, 4668−
4672.
(36) Reid, D. P.; Stennett, M. C.; Hyatt, N. C. The Fluorite Moderated Structures of the Gd2(Zr2‑XCex)O7 Solid Solution: An
Analogue for Pu Disposition.J. Solid State Chem.2012,191, 2−9.
(37) Heisbourg, G.; Hubert, S.; Dacheux, N.; Purans, J. Kinetic and Thermodynamic Studies of the Dissolution of Thoria-Urania Solid Solutions.J. Nucl. Mater.2004,335, 5−13.
(38) Ojovan, M.; Travis, K. P.; Hand, R. J. Thermodynamic Parameters of Bonds in Glassy Materials from Viscosity-Temperature Relationships.J. Phys.: Condens. Matter2007,19, 415107−415122.
(39) Luttge, A.; Arvidson, R. S.; Fischer, C. A Stochastic Treatment of Crystal Dissolution Kinetics.Elements2013,9, 183−188.
(40) Horlait, D.; Claparede, L.; Clavier, N.; Szenknect, S.; Dacheux, N.; Ravaux, J.; Podor, R. Stability and Structural Evolution of Ce(IV)1‑xLn(III)xO2/2 Solid Solutions: A Coupled μ-Raman/XRD
Approach.Inorg. Chem.2011,50, 7150−7161.
(41) Finkeldei, S.; Brandt, F.; Rozov, A. A.; Bukaemskiy, S.; Neumeier, S.; Bosbach, D. Dissolution of ZrO2Based Pyrochlores in
the Acid pH Range: A Macroscopic and Electron Microscopy Study.
Appl. Geochem.2014,49, 31−41.
(42) Fischer, C.; Finkeldei, S.; Brandt, F.; Bosbach, D.; Luttge, A. Direct Measurement of Surface Dissolution Rates in Potential Nuclear Waste Forms: The Example of Pyrochlore.ACS Appl. Mater. Interfaces
2015,7, 17857−17865.
(43) Wronkewicz, D. J.; Buck, E. C.; Bates, J. K. Grain Boundary Corrosion and Alteration Phase Formation During the Oxidative Dissolution of UO2 Pellets. Mater. Res. Soc. Symp. Proc. 1997,468,
519−526.
(44) Degueldre, C.; Pin, S.; Poonoosamy, J.; Kulick, D. A. Redox state of plutonium in irradiated mixed oxide fuels.J. Phys. Chem. Solids
2014,75, 358−365.
(45) Conradson, S. D.; Begg, B. D.; Clark, D. L.; den Auwer, C.; Ding, M.; Dorhout, P. K.; Espinosa-Faller, F. J.; Gordon, P. L.; Haire, R. G.; Hess, N. J.; Hess, R. F.; Keogh, D. W.; Morales, L. A.; Neu, M. P.; Paviet-Hartmann, P.; Runde, W.; Tait, C. D.; Veirs, D. K.; Villella, P. M. Local and Nanoscale Structure and Speciation in the PuO2+x‑y(OH)2y.zH2O System. J. Am. Chem. Soc.2004,126, 13443−
13458.