Ecological speciation in sympatric palms: 1. Gene expression,
selection and pleiotropy
L . T . D U N N I N G *1 , 2, H . H I P P E R S O N *1 , 2, W . J . B A K E R†, R . K . B U T L I N‡§, C . D E V A U X *3, I . H U T T O N¶, J . I G E A *4, A . S . T . P A P A D O P U L O S *†, X . Q U A N * , C . M . S M A D J A *3,
C . G . N . T U R N B U L L * * & V . S A V O L A I N E N *† *Department of Life Sciences, Imperial College London, Ascot, UK
†Royal Botanic Gardens, Kew, Richmond, UK
‡Department of Animal and Plant Sciences, University of Sheffield, Sheffield, UK
§Sven Loven Centre for Marine Sciences, Tj€arn€o, University of Gothenburg, Stromst€ad, Sweden ¶Lord Howe Island Museum, Lord Howe Island, NSW, Australia
**Department of Life Sciences, Imperial College London, London, UK
Keywords:
Lord Howe Island; positive selection; sympatric speciation; transcriptomics.
Abstract
Ecological speciation requires divergent selection, reproductive isolation and a genetic mechanism to link the two. We examined the role of gene expres-sion and coding sequence evolution in this process using two species of
Howea palms that have diverged sympatrically on Lord Howe Island, Aus-tralia. These palms are associated with distinct soil types and have displaced flowering times, representing an ideal candidate for ecological speciation. We generated large amounts of RNA-Seq data from multiple individuals and tissue types collected on the island from each of the two species. We found that differentially expressed loci as well as those with divergent coding sequences between Howea species were associated with known ecological and phenotypic differences, including response to salinity, drought, pH and flowering time. From these loci, we identified potential ‘ecological speciation genes’ and further validate their effect on flowering time by knocking out orthologous loci in a model plant species. Finally, we put forward six plausi-ble ecological speciation loci, providing support for the hypothesis that pleio-tropy could help to overcome the antagonism between selection and recombination during speciation with gene flow.
Introduction
The conditions required for speciation to happen are still being debated, although the emphasis of the discus-sion has changed considerably in recent years. Diver-gence resulting from geographical isolation acting as a physical barrier to gene flow is a well-known driving
force of speciation. However, it is now well accepted that physical separation is not a prerequisite for this process and that speciation can transpire despite ongo-ing gene flow (Coyne & Orr, 2004). For this to occur, the action of divergent selection is generally required to overcome the powerful homogenizing effect of contin-ued gene exchange (Dieckmann & Doebeli, 1999; Smadja & Butlin, 2011).
Divergent selection may ultimately result in specia-tion despite ongoing gene flow when there is a genetic mechanism linking the target of divergent selection
with assortative mating (Schluter, 2000, 2001;
Kirkpatrick & Ravigne, 2002; Rundle & Nosil, 2005; Nosil, 2012). Over the last two decades, there has been renewed interest in the effect of ecologically based divergent selection, in an attempt to understand how the interaction of individuals with their environment can result in reproductive isolation, and ultimately
Correspondence: Prof. Vincent Savolainen, Imperial College London, Silwood Park Campus, Buckhurst Road, SL5 7PY Ascot, Berks, UK. Tel.: +44 (0)20 7594 2374; fax: +44 (0)20 7594 2339;
e-mail: [email protected] 1
These authors contributed equally. 2
Present address: Department of Animal and Plant Sciences, University of Sheffield, Sheffield, S10 2TN UK
3
Present address: Institut des Sciences de l’Evolution, (UMR 5554) CNRS-IRD-EPHE-CIRAD-University of Montpellier, Montpellier, France 4
Present address: Department of Plant Sciences, University of Cambridge, Downing St, Cambridge, CB2 3EA, UK
ª2 0 1 6 T H E A U T H O R S .J . E V O L . B I O L .
‘ecological speciation’ (Schluter, 2000, 2001; Rundle & Nosil, 2005; Nosil, 2012).
Local adaptation may represent the embryonic stages of incipient ecological speciation (e.g. Nosil, 2012). Broadly speaking, there are two genetic mechanisms by which this initial divergence may culminate in ecologi-cal speciation. The simplest mechanism involves a sin-gle locus pleiotropically affecting both ecological and reproductive traits. For example, mFAS in Drosophila is involved in the synthesis of cuticular hydrocarbons associated with both desiccation resistance and mate choice (Chung et al., 2014). In this example, the syn-thesis of cuticular hydrocarbons is acting as a single ‘multiple-effect trait’, with mutations in this gene alone capable of underpinning progress towards ecological speciation (Chung et al., 2014). An alternative genetic mechanism capable of facilitating ecological speciation requires separate genes underpinning ecological and reproductive traits to be nonrandomly associated through linkage disequilibrium. For example, hybrid lethality and copper tolerance in monkeyflowers are separately controlled by two tightly linked loci (Wright
et al., 2013).
The endemicHoweapalms of Lord Howe Island (LHI) represent one of the most convincing examples of sym-patric speciation (Gavrilets & Vose, 2007), with diver-gence between the two species, Howea belmoreana and
Howea forsteriana, being hypothesized to have occurred as a result of adaptation to soil type (Savolainen et al., 2006). LHI is a minute (<16 km2) subtropical island formed 6.4–6.9 million years ago (Mya) through volcanic activity (McDougallet al., 1981). LHI was subsequently colonized by the ancestor of Howea from the closest major landmass, Australia (580 km west of LHI), approx-imately 4.5–5.5 Mya (Savolainen et al., 2006). Origi-nally, LHI was composed of a homogenous volcanic habitat, with calcarenite subsequently deposited around the low-lying coastal regions during the mid-Pleistocene (Brookeet al., 2003). This new substrate is hypothesized to have been the catalyst for ecological speciation in
Howea, with the date of calcarenite formations corre-sponding to the predicted divergence time of the two species (Savolainenet al., 2006). Howea forsterianais pre-dicted to have split from its sister species (an ancestor of
H. belmoreana) by colonizing the calcarenite soils and other areas that have reduced soil water, elevated pH and increased salinity (Savolainenet al., 2006; Papadop-ulos et al., 2013). The physiological responses to the novel ecological stressors associated with calcarenite soil are assumed to have indirectly displaced flowering phe-nology, moving the populations further towards comple-tion of speciacomple-tion (Savolainenet al., 2006).
Currently on LHI, edaphic preference remains an important factor influencing Howea distribution. Howea belmoreana is restricted to the older volcanic soil, whereas H. forsteriana has been able to colonize both substrates. Despite this co-occurrence on volcanic soils,
species boundaries are maintained although hybrids do form at low frequency (Babik et al., 2009). This led to the hypothesis that whilst speciation likely involved an initial plastic response to the environment, the indirect shift in flowering time as a result of the colonization of calcarenite soil has subsequently become genetically fixed (Savolainen et al., 2006; H. Hipperson, L.T. Dun-ning, C. Devaux, W.J. Baker, R.K. Butlin, I. Hutton, A.S.T. Papadopulos, C.M. Smadja, T.C. Wilson & V.S. Savolainen, submitted). However, the genetic mecha-nism linking adaptation and assortment, and so facili-tating ecological speciation in Howea, remains unknown. As explained above, divergent selection to different soil types and reproductive isolation due to displaced flowering phenologies between the species could be directly connected through pleiotropy, or indi-rectly through linkage disequilibrium (Kirkpatrick & Ravigne, 2002; Smadja & Butlin, 2011).
Measuring the impacts that local adaptation and assor-tative mating have had on descendent species provides an opportunity to make inferences regarding the speciation process (Fitzpatricket al., 2008). Adaptation to the novel calcarenite soil, and the resulting flowering time displace-ment, has likely left signals of both positive selection in protein coding sequences and altered patterns of gene expression between Howea species. The importance of protein coding sequence mutations in environmental adaptation (e.g.Mc1Rin mice; Hoekstraet al., 2006) and reproductive isolation (e.g.OdsHinDrosophila; Tinget al., 1998) has long been known. However, gene expression variation can also promote ecological speciation either by indirectly supporting population persistence or by directly affecting adaptive genetic divergence in traits causing reproductive isolation (Pavey et al., 2010); well-docu-mented examples include Darwin’s finches, where differ-ential gene expression alters beak shape (Abzhanovet al., 2004), and ragwort plants, where it influences altitude adaptation (Chapman et al., 2013). In fact, changes in expression may evolve first, because small nucleotide dif-ferences can cause significant expression alterations, for example, as documented between recently diverged European carrion and hooded crows (Wolfet al., 2010).
Materials and methods
RNA extraction and sequencing
Tissue samples were collected on LHI over the course of three field trips in 2010, encompassing the seasonal variation and the flowering phenologies of both Howea
species (Fig. 1; see Table S1 for details of sample collec-tion and sequencing results). We collected 36 individu-als, including 19 H. belmoreana and 17 H. forsteriana. Three tissue types were individually sampled (leaf, root and inflorescence with mature female or male flowers) and stored in RNAlater (Sigma , St Louis, MO, USA). Whenever possible, all tissues were collected and sequenced for the same tree (Table 1 & Table S1). Tis-sue samples were disrupted using a Power Gen 125 tis-sue homogeniser (Fisher Scientific , Waltham, MA, USA), and total RNA was extracted using the RNeasy Plant Mini kit (Qiagen, Hilden, Germany) with Plant RNA Isolation Aid (Ambion) and DNaseI (Qiagen). Total RNA was further purified using the RNeasy MinE-lute Cleanup kit (Qiagen). RNA quality and concentra-tion was determined using the RNA 6000 Nano kit with an Agilent 2100 Bioanalyser (Agilent Technologies, Palo Alto, CA, USA). For transcriptome sequencing, indexed cDNA libraries were constructed for each individual and
tissue type using the Illumina TruSeq RNA sample preparation kit, and a minimum of 10-million 100-base pair (bp) paired-end reads per library were generated using an Illumina HiSeq 2000 System (at GATC Biotech, Konstanz, Germany).
Raw sequences were filtered to remove PCR dupli-cates, sequencing adapters, low-quality bases and ribo-somal RNA sequences. PCR duplicates were identified using a modified version of Fulcrum v0.42 (Burriesci
et al., 2012). Paired-end reads were concatenated, and PCR duplicates among these were identified as almost identical sequences, that is one nucleotide mismatch per 200 bp allowed, but ignoring mismatches with low-quality bases (Q<7). Where duplicates were identified, the read with the highest average quality score was retained. Low-quality leading and trailing bases, along with adapter sequences, were filtered out using Trim-momatic v0.22 with default settings (Bolger et al., 2014). Internal low-quality bases (Q<20) were trimmed from the remaining sequence using a four-base sliding window. After trimming, any read shorter than 25 bp was removed. Reads with >90% coverage and >90% identity to sequences in the nonredundant ribosomal RNA database were removed using riboPicker v0.4.3 (Schmiederet al., 2012).
Assembly of the reference transcriptome
A high-quality reference transcriptome forH. forsteriana
was assembled with Trinity v2013-05-08 (Grabherr
et al., 2011), using the eight individuals sequenced for all three tissue types (Table S1). Cleaned reads werein silico normalized and subsequently assembled using Trinity with the default parameters and minimum kmer coverage of 2. Cleaned paired-end reads for each RNA-Seq library were subsequently mapped onto the refer-ence transcriptome and read counts summarized using RSEM v1.2.4 (Li & Dewey, 2011) as part of the Trinity analysis pipeline (Haaset al., 2013).
The raw counts from RSEM were used to filter the reference transcriptome and remove assembly artefacts. Each tissue type was analysed separately, and each uni-gene (i.e. clusters of contigs representing splice variants of the same locus) was required to have at least one read per million mapped reads (rpm) to be retained as part of the reference transcriptome used for down-stream analyses. This also discards transcripts that are so lowly expressed that expression levels are difficult to compare accurately.
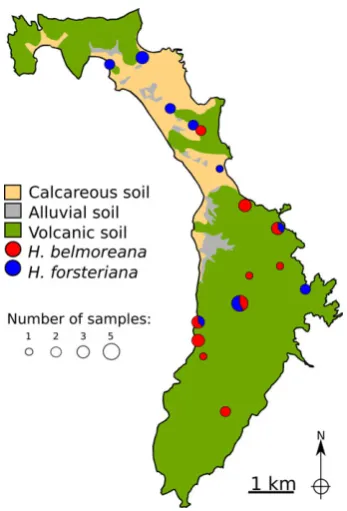
[image:3.595.304.532.99.155.2]Fig. 1 Broadscale geological map of Lord Howe Island showing sampling localities ofHoweapalms used for RNA-Seq. Circle size is proportional to the number of individuals collected at each site, with pie sections representing the proportion of samples from each species/hybrids at sympatric sites.
Table 1 Number of individual RNA-Seq libraries.
Tissue Howea belmoreana Howea forsteriana
Leaf 16 14
Floral 16 14
[image:3.595.86.260.396.652.2]The reference transcriptome was annotated by BLASTX sequence searching against the National Cen-tre for Biotechnology Information SwissProt databases, restricted to matches withArabidopsis thalianaandOryza sativa (E-value threshold=1e6). Gene ontology (GO) terms were extracted from The Arabidopsis Information Resource (TAIR, accessed March 2014; Lamesch et al., 2012) and the Rice Genome Annotation Project (ac-cessed May 2014; Ouyang et al., 2007). Open reading frames (ORFs) were predicted using TransDecoder, with a minimum predicted protein length of 100 amino acids. For each unigene, the contig with the longest ORF was retained for downstream sequence analysis.
Because there is no available genome resource for
Howea or a closely related species, we cannot exclude that considerably divergent alleles from a single locus
may have been split into two loci, or conversely that recently diverged paralogues would have assembled into a single locus. This problem is inherent to de novo
RNA-seq in nonmodel organisms.
Gene expression
Analyses of differential gene expression were conducted between species using edgeR v3.2.4, looking at each tis-sue in turn. Because theANOSIManalysis was significant for species and sampling date (see Results below and Table S2), we fitted generalized linear models (GLMs) to the data to take into account these factors for all dif-ferential expression analyses. For the GLM, sampling dates were categorized into collection trips (Fig. 2, Table S1). Due to the large number of pairwise
(a) (b) (c)
(d)
(g)
(e) (f)
comparisons made, a per-tissue false discovery rate (FDR) cut-off of <0.05 was used. In total, 79 RNA-Seq libraries were used for differential expression analysis (leaf=16 H. belmoreana and 14 H. forsteriana; flo-ral=16 H. belmoreana and 14 H. forsteriana; root=eight H. belmoreana and 11 H. forsteriana; Table 1).
We repeated the differential expression analyses for: (i)H. forsterianagrowing on calcarenite (10 trees) vs. vol-canic soils (seven trees; Table S1); (ii)H. forsteriana grow-ing on calcarenite (10 trees) vs.H. belmoreana (19 trees; Table S1); and (iii)H. forsterianagrowing on volcanic soil (seven trees) vs.H. belmoreana(19 trees; Table S1).
To test for sampling effects, a multivariate analysis
was performed using the entire ‘transcriptomic
responses’ between species, soil, inflorescence sex and the date of sampling. Groupings of expression profiles based on the biological coefficient of variation (BCV) were identified with multidimensional scaling (MDS) in edgeR v3.2.4 (Robinson et al., 2010). The significance of these groupings was then tested using analysis of similarity (ANOSIM) with the R package vegan v2.2.1 (Oksanenet al., 2013).
To validate the RNA-Seq expression estimates, a sub-set of 13 genes with a range of GO annotations and magnitude of differential expression were selected for quantitative PCR (qPCR) analysis. Two nondifferentially expressed unigenes (PP442 and BECN1) were also selected to normalize the relative qPCR expression esti-mates between genes. Primers were designed with stringent criteria using the Primer3 plugin in Genei-ous v5.3.6. Where possible, all primers had a Tm of 59–61°C, GC content between 40% and 60%, were 18–25 base pairs long and amplified a product between 60 and 150 bp in length (Table S3). Quantitative PCR was performed using cDNA synthesized from 10H. bel-moreanaand 10H. forsteriana RNA extracts. These were the same extracts as used for the RNA-Seq library con-struction and came from the three tissue types (5x floral, 3x leaf and 2x root). A total of 125 ng of DNAse-treated RNA was reverse transcribed using a High-Capacity cDNA Reverse Transcription Kit with RNase Inhibitor kit (Invitrogen). Quantitative PCRs consisted of 6.25 ng cDNA, 0.8 lMof each primer and 19Power SYBR Green PCR Master Mix (Applied Biosystems) with a total reaction volume of 25 lL. Reactions were carried out on an ABI Prism 7000 sequence detection system with the following cycling parameters: 50 °C for 2 min; 95°C for 10 min; 40 cycles of 95°C for 15 sec, 60°C for 15 s and 72°C for 30 s; and 72°C for 10 min. At the end of each run, a melting curve was generated to verify that only a single product was amplified. Quantification cycle (Cq) values and primer efficiencies for each reaction were calculated using Lin-RegPCR (Ramakers et al., 2003). Reactions with high (>120%) or low (<70%) primer efficiencies were excluded from subsequent analysis. Normalization
factors based on the geometric means of the reference genes were calculated using geNorm (Vandesompele
et al., 2002). An approximate Pfaffl method (Pfaffl, 2001) was used to generate relative amounts of each target gene. To convert to fold-change values, the mean relative amount for each H. belmoreana tissue was divided by the mean relative amount of theH. forsteri-ana tissue. Linear regression with Pearson’s correlation
coefficients was used to compare the agreement
between the RNA-Seq and qPCR results (Fig S1).
Gene ontology enrichment
To identify which GO terms were enriched in the differ-ently expressed genes, we conducted an over-represen-tation analysis using ErmineJ v3.0 (Lee et al., 2005). These analyses were restricted to GO terms annotated with 10 to 100 unigenes, to avoid overly general GO cat-egories as well as those with low statistical support (De Witet al., 2012). Although rice is more closely related to palms (both being monocots), we used the Arabidopsis
data due to a larger number of annotated proteins in the NCBI SwissProt database (i.e. 14 430Arabidopsisentries vs. 3453 for rice). Furthermore, ArabidopsisGO annota-tions in the TAIR database are inferred from multiple sources and direct evidence, whereas GO annotations for other species (including The Rice Genome Annota-tion Project) are generally electronically inferred by BLASTP sequence searching against theArabidopsis thali-anaproteome.
Combinations of tissues, species and expression esti-mates were used to infer enrichment of GO terms com-pared to the reference transcriptome (FDR<0.2). Significantly enriched GO terms were summarized by removing degenerate terms with REVIGO (Supek et al., 2011).
Population genetics
To investigate the distribution of genetic variation between the two species, single polymorphic sites (SNPs) were identified from 10 individuals of each spe-cies that had the largest amounts of data when pooled across tissues. These included H. forsteriana trees from calcarenite (four individuals) and volcanic (six individu-als) soils. Cleaned paired-end reads were mapped onto the reference transcriptome using BWA v0.6.1 (q=20) (Li & Durbin, 2009), and SNPs were called with Sam-tools’ v.1.18 mpileup function (Liet al., 2009) with the following parameters: base quality value >30; indels were not called; anomalous read pairs were also used; base calls represented by <3 independent reads removed. Variant Call Format files were further pro-cessed with VCFtools v0.1.11 (Danecek et al., 2011) to
remove low-quality and low-frequency genotypes
The SNP calls were used to investigate genetic structure using the software STRUCTURE (Pritchard
et al., 2000). To verify that we have 10 pure individuals of each species, we estimated the number of genetic clusters (K) using five independent runs for values of
K=1–5, with 10 000 burn-in cycles, 100 000 Markov chain Monte Carlo iterations and an admixture model with correlated allele frequencies (Falush et al., 2003). We then used STRUCTURE HARVESTER (Earl & vonHoldt, 2012) and the rate of change in log-likeli-hood between successive values of K (Evanno et al., 2005) to assess the most likely value ofK. We repeated this analysis withinH. forsteriana to investigate whether genetic variation was structured over soil type and to assess whether this species could be treated as a single population for further genetic analyses.
We also measured genetic differentiation and diver-sity. Relative differentiation (FST) between species was estimated using the R package HIERFSTAT (Goudet, 2005), and potential outliers were identified with BayeScan v2.1 (Foll & Gaggiotti, 2008). Absolute diver-gence (Dxy) was calculated using the fasta2popgen script (available at https://github.com/LaMariposa/pop-gen_scripts). Heterozygosity was measured using the software 4P (Benazzoet al., 2015). Transcriptome-wide and unigene specific nucleotide diversity (p), Tajima’s
D, Fu and Li’sDand Fu and Li’s Fwithin and between species were calculated using the mstatspop R package (available from http://bioinformatics.cragenomica.es/ numgenomics/people/sebas/software/software.html).
Detecting selection on coding sequences
We used three approaches to search for the signature of selection on coding sequences.
The action of selection on a protein-coding DNA sequence can be inferred fromx, that is the ratio of the number of nonsynonymous substitutions per nonsyn-onymous site (dN) to the number of synonymous sub-stitutions per synonymous site (dS). Purifying selection is indicated by dN/dS<1, whereas dN/dS=1 indicates neutral evolution, anddN/dS>1 signifies positive selec-tion. We calculated dN/dS for the ORFs using the Yang & Nielsen (2000) counting method implemented in yn00, as part of the PAML v4.7 package (Yang, 2007). This method estimates dN/dS from a pairwise compar-ison between sequences, providing a single estimate for the entire ORF, and only considering fixed differences between species and without the need for a closely related outgroup comparison. Consensus sequences for each species were generated from the previous high-confidence SNP calls using VCFtools. Alignments of genes withdN/dS>1 were checked by eye to ensure no alignment errors were present.
We also tested for positive selection by calculating a (Smith & Eyre-walker, 2002), an extension of the McDonald–Kreitman test (McDonald & Kreitman,
1991), for the pool of genes with a dN/dS>1 in comparison with those with dN/dS≤1. To calculate a, we used the total number of nonsynonymous substitu-tions (DN), the total number of synonymous substitu-tions (DS), the total number of nonsynonymous polymorphisms (PN) and the total number of synony-mous polymorphisms (PS), as: a=1 [(DS PN)/(DN
PS)]. IfDN/Dsis>PN/PS,aranges between 0 and 1, and significant departure from zero indicates that positive selection is acting on the coding sequence.
Finally, we calculated the ‘fraction of nonsynony-mous substitution rate’ (fN) and the ‘difference in selec-tion’ (DiS) following Xie et al. (2011). Briefly, dN/dS values can be impossibly large or meaningless when the number of synonymous substitutions (ds) is, or close to, zero (Xie et al., 2011). CalculatingfN (fN=dN/ (dN +dS)) can compensate for this, and improves on previous methods using rates as opposed to absolute numbers of mutations (Xieet al., 2011). For each gene, we calculated dN and dS values between all pairs of sequences from all individuals using the yn00 program (Yang & Nielsen, 2000). From these results, we calcu-lated average intra- and interspecific dN and dS values that were then used to calculate fN for within and between species comparisons. From these fN values, the difference in selection regime within and between spe-cies can be compared, where DiS =fN-between–fN-within.
Coalescence analyses
Under a scenario of speciation with gene flow, we expect that any locus under divergent selection would have greater coalescence depth compared to neutral genes. To evaluate this, an isolation-with-migration analysis using IMa2 was used to compare the diver-gence times of the genes putatively under selection (as identified above) with nine control loci (Hey, 2010). A data set consisting of nine loci with evidence of having evolved under divergent selection was fitted to an isola-tion-with-migration model of population demographic history to calculate the corresponding divergence times between the two species. Haplotypic phases for each locus were determined from transcriptomic data for a maximum of 10 individuals per species using PHASE v.2.1.1 (Stephens et al., 2001) with default parameters. Possible recombination events were detected using IMgc (Woerner et al., 2007), and the largest nonrecom-bining blocks were chosen when necessary.
analyses. Thus, we were able to convert the estimates obtained with IMa2 (which are scaled by a mutation rate specific to each set of analysed data) into absolute time estimates.
All analyses were carried out using IMa2, where an ancestral population was allowed to split into two (cor-responding to the two extantHowea species) with con-tinuous gene flow (Hey, 2010), with preliminary trial runs to estimate the most suitable set of priors. We ran 25 Markov chain Monte Carlo (MCMC) simulations for 500 000 steps, retaining 50 000 genealogies, with an initial one-million step burn-in. After initial explo-ration, the most adequate sets of upper bounds on the prior distributions were chosen for each analysis. These were q=8, m=3, t=5 (for the loci under divergent selection) and q=10, m=5, t=5 (for the loci under no selective pressure). Results are plotted in Fig S4.
The evolutionary rates for both PRK and RPBII introns were obtained from a time-calibrated phylogeny for 120 taxa belonging to Arecoideae (including both
Howea species). Each intron was used as an indepen-dent partition in a BEAST analysis (Drummond & Rambaut, 2007) (v.1.7.5), with its own substitution model (estimated by JMODELTEST to be GTR+I +G for both markers), and its own evolutionary rate modelled using an uncorrelated log-normal relaxed clock. The tree prior was set following a birth–death model. Fossil constraints were used following a previous study (Savo-lainen et al., 2006). The prior for the root of the tree
was set using a gamma distribution (shape =1,
scale =4, offset=83.5). Two internal nodes with Mas-carenes-endemic species were constrained to be no older than the estimated age of the islands using trun-cated normal distributions. The analysis was run for 70 million generations (sampling every 3000 generations), and after discarding the initial 18 000 trees, a maxi-mum clade credibility tree was obtained with TreeAnno-tator. The evolutionary rates for the Howea clade were calculated for PRK and RPBII by averaging the obtained rates for both Howeaspecies and the branch leading to the Laccospadix-Howea split. The resulting evolutionary rate was 2 *109substitutions per site per year.
Identifying potentially pleiotropic loci
Genes significantly differential expressed, or with evi-dence for positive section, were further filtered to iden-tify potential pleiotropic genes relevant to ecological speciation in Howea. Specifically, we searched for loci involved with biological processes associated with colo-nization of a new substrate (chemistry of calcarenite soils) and reproductive isolation via shift in flowering time. Specifically, we used the following GO terms: response to stress (GO:0006950), response to osmotic stress (GO:0006970), response to water deprivation (GO:0009414), response to metal ion (GO:0010038), reproduction (GO:0000003) and regulation of flower
development (GO:0009909). General parent GO terms for the known ecological and reproductive differences (e.g. reproduction and response to stress) were used to retain as many candidate loci as possible for subsequent analyses, this encapsulated all relevant daughter terms associated with flowering phenology and soil stress without being so restrictive that potential candidates with depauperate GO annotation would be missed.
To be considered potentially pleiotropic, genes under positive selection were required to possess at least one GO term in both categories (divergent selection and reproductive isolation). For possible pleiotropic loci that are differently expressed, we restricted our analyses to those that had nonoverlapping differential expression (NODE; Fig. S1) profiles and GO annotations from the two predefined categories above, that is the same crite-ria as for genes under positive selection. NODE was defined as being significantly differentially expressed (i.e. edgeR FDR<0.05) in addition to being consis-tently expressed at a higher level in all individuals of one of the species than in all individuals of the other species (as identified using rpm values).
Knockout experiments
We tested the effect of potential pleiotropic loci on phe-nology using knockouts of their putative orthologs in
the T-DNA insert. Significant differences in flowering time between homozygous knockout mutants and wild-type plants were assessed using at-test with stan-dard Bonferroni correction for multiple testing.
Results
Reference transcriptome
For 34 trees (Table S1), a total of 79 individually sequenced RNA-Seq libraries generated approximately 3.5-billion 100-bp paired-end reads representing 352 Gb of data, with a mean of 4.5 Gb per library (range 2.5–16.2 Gb). Over 70% of the data were kept after removing low-quality reads, ribosomal RNA sequences and PCR duplicates (Table S1).
We used 78.6 Gb of data from eight individuals to cre-ate the reference transcriptome forH. forsteriana, result-ing in 402 093 contigs and 182 013 unigenes (mean length=1341 bp; N50=2444 bp). After removing likely assembly artefacts, the reference transcriptome comprised 14 576 unigenes, which were then used for downstream analyses (183 650 contigs, mean length of the longest contig per unigene=2596 bp, N50 of the longest contig per unigene=2308 bp). Of the 14 576 unigenes, 57% and 31% matchedArabidopsis and rice protein sequences, respectively (Table S5 describes the full transcriptome annotation and detailed results). The higher percentage ofArabidopsisprotein matches is likely due to four-fold moreArabidopsisthan rice entries in the Swiss-Prot database (13 037 vs. 3227; Swiss-Prot 2014_07 release note statistics). A total of 79.3% of uni-genes had predicted ORFs longer than 300 bp (Table S5). Raw RNA-Seq data are deposited in the NCBI Sequence Read Archive (accession number SRP041170).
Differential gene expression
Leaf and floral tissues were each represented by 30 RNA-Seq libraries (16 H. belmoreana and 14 H. forsteri-ana), in addition to 19 root libraries (eight H. belmore-ana and 11 H. forsteriana). Counts for differential expression were generated by mapping the cleaned reads onto the reference transcriptome, with between
65.7% and 85.0% (Mean=78.9%; SD=3.4%,
Table S1) of reads from each individual having at least one valid alignment. In total, 13 494, 12 129 and 12 446 unigenes for floral, leaf and root tissues, respec-tively, met our criteria of having at least one count per million mapped reads for each sample.
Comparing overall expression profiles between sam-ples using the MDS (Fig. 2) andANOSIM(Table S2) anal-yses identified species as significant groupings across all three tissues (floral: ANOSIM R=0.194, P=0.013; leaf:
ANOSIM R=0.210, P=0.010; root: ANOSIM R=0.188,
P=0.018), but sampling date was also significant (flo-ral: R=0.148,P=0.013; leaf: R=0.213,P =0.009).
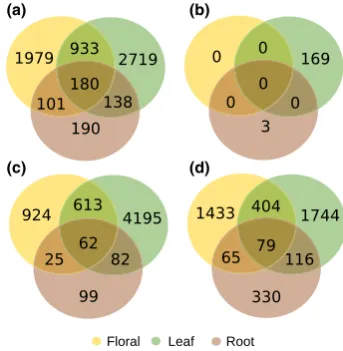
The interspecific analysis using edgeR identified 6240 differentially expressed genes between species in at least one tissue type (floral=3193; leaf =3970; root=609; all tissues=180; Fig. 3a). Slightly more dif-ferentially expressed transcripts were up-regulated in
H. forsteriana (57%). Expression estimates in all three tissues were verified using qPCR: overall, there was a strong correlation between the RNA-Seq and qPCR results (R2=0.76,P<0.001; Fig. S2).
The intraspecific analysis between H. forsteriana from the different soil types identified 172 differentially expressed genes (floral=0; leaf=169; root=3; all tis-sues =0; Fig. 3b). Of these 172 transcripts, 16 were also significantly differentially expressed for the intraspecific comparison in the same tissue (Table S5), with more loci up-regulated in H. forsteriana from vol-canic soil (62%).
To identify potential gene expression changes associ-ated with adaptation to calcarenite soil, we
indepen-dently compared the expression of each of the
H. forsterianapopulations from the different soil types to
H. belmoreana. Overall, 7469 genes were differentially expressed in at least one tissue from both analysis, with 44% unique to the H. forsteriana from calcarenite vs.
H. belmoreana comparison, 20% unique to the H. forste-riana from volcanic soil vs. H. belmoreana comparison, and 36% shared by both analyses.
Gene ontology enrichment analysis was performed for genes identified as significantly differentially expressed. In total, 29 GO categories were enriched in at least one of the tests performed between species (Table S6), and only two were enriched between
H. forsteriana from the different soil types (‘cellulose
(a) (b)
(c) (d)
Fig. 3 Number of differentially expressed transcripts between
Howea belmoreanaandHowea forsterianatissue types (a); between
H. forsterianasamples from the two different soil types (b, see text for details); (c) betweenH. belmoreanaandH. forsterianafrom calcarenite soils; and (d) betweenH. belmoreanaandH. forsteriana
[image:8.595.334.506.467.643.2]biosynthetic process’ and ‘beta-glucan biosyntheic process’). A further nine GO categories were enriched in the genes significantly differentially expressed between
H. forsteriana growing on calcarenite vs. H. belmoreana,
but not significantly for H. forsteriana growing on vol-canic soil vs.H. belmoreana (Table S7); noteworthy, this include the GO term for primary root development (Table S7).
Population differentiation
We identified 22 741 SNPs from mapping the sequence data from 20 individuals (10 from each species) onto 11 572 reference transcripts with ORFs. There were 1.37 SNPs per kb, with an average of two SNPs per uni-gene. No SNP was found in 31.7% of the reference genes (i.e. monomorphic). Of the 22 741 SNPs, 5151 (22.65%) were fixed differences between species, 7178 (31.56%) were shared polymorphisms, and the remain-der were private polymorphisms in eitherH. belmoreana
(5701 SNPs, 25.07%) or H. forsteriana (4711 SNPs, 20.72%). Using the 22 741 SNPs, the most likely num-ber of genetic clusters within Howea was shown to be two, with all 20 individuals showing 100% membership to their respective species cluster (data not shown). Furthermore, there appeared to be no genetic structure as a result of soil type withinH. forsteriana, with mean LnP(K) values equal across all values of K, indicating
K=1.
Various measures of genetic diversity, that is, nucleo-tide diversity (p), observed heterozygosity, Tajima’s D, Fu and Li’sDand Fu and Li’sF, were marginally higher for H. belmoreana than H. forsteriana when considering all loci, and a reduced set of those loci containing at least three SNPs (Table S8). The population genetic
metrics were similar between species, with the
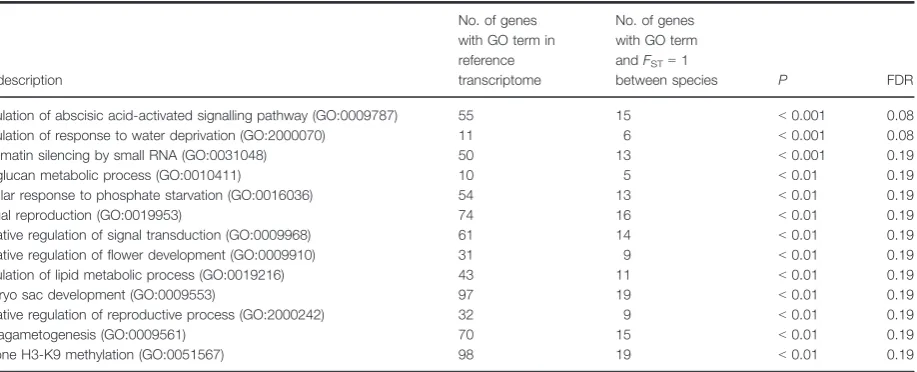
distribution of Tajima’s D, Fu and Li’s D and Fu and Li’sF centred well above zero (Fig. S3). This pattern of genetic variation could be generated in numerous ways, either by (i) a decrease in population size; (ii) and/or balancing selection; or (iii) population size increase resulting in an excess of rare alleles at low frequency. For the 68.3% of genes that had at least one SNP, FST was high (mean=0.47, SD=0.34), with 1320 unige-nes having an FST equal to 1 (Table S5). Due to the high number of fixed differences, no significant outliers were detected with BayeScan. The mean Dxy Between species was 0.00176 (SD=0.00116; Table S5). For these genes with FST equal to 1, p was also lower (mean=0.000632, SD =0.000425) than the rest of the data set (mean=0.000871, SD=0.000810). This may indicate selective sweeps or reduced recombination. These 1320 genes were significantly enriched for sev-eral GO categories associated with ecological and repro-ductive differences betweenHoweaspecies (Table 2).
We also looked at the link between relative sequence divergence and differential expression. A total of 548 of the 1320 genes with FST =1 were differentially expressed in at least one tissue. This is in the same pro-portions as would be expected by chance (548 of 1320 genes with FST=1 differentially expressed, 5811 of all 14 576 genes differentially expressed, paired z-test
P=0.244). No GO category was significantly enriched in these differentially expressed genes.
Positive selection
[image:9.595.74.533.520.706.2]We were able to calculate thedN/dSratio for 518 of the 2981 unigenes that had at least three SNPs, excluding those where dSequals zero. The mean dN/dSwas 0.48 (SD=0.31), with 37 genes having values >1 and potentially indicating positive selection. No GO category
Table 2 Gene ontology (GO) enrichment analysis for genes with only fixed differences between species (FST=1).
GO description
No. of genes with GO term in reference transcriptome
No. of genes with GO term andFST=1
between species P FDR
Regulation of abscisic acid-activated signalling pathway (GO:0009787) 55 15 <0.001 0.08 Regulation of response to water deprivation (GO:2000070) 11 6 <0.001 0.08 Chromatin silencing by small RNA (GO:0031048) 50 13 <0.001 0.19
Xyloglucan metabolic process (GO:0010411) 10 5 <0.01 0.19
Cellular response to phosphate starvation (GO:0016036) 54 13 <0.01 0.19
Sexual reproduction (GO:0019953) 74 16 <0.01 0.19
Negative regulation of signal transduction (GO:0009968) 61 14 <0.01 0.19 Negative regulation of flower development (GO:0009910) 31 9 <0.01 0.19 Regulation of lipid metabolic process (GO:0019216) 43 11 <0.01 0.19
Embryo sac development (GO:0009553) 97 19 <0.01 0.19
Negative regulation of reproductive process (GO:2000242) 32 9 <0.01 0.19
Megagametogenesis (GO:0009561) 70 15 <0.01 0.19
was enriched in the 37 genes with evidence of positive selection. However, seven of the annotated transcripts were differentially expressed in leaves between species (DNLI4, POT4, FBL4, LTN1, PUB12, XYL1 and Y2182). We then calculated a for these 37 genes (a=0.708;
DN=130, DS=38, PN=34, PS=34), which we
com-pared to a for the remaining 481 unigenes
(a=0.131; DN=729, DS=716, PN=525, PS=456). Given that a for the 37 genes is significantly higher (P<0.001; 10 000 permutations), it provides further support that these genes are indeed evolving under positive selection relative to the rest of the loci. Finally, we calculated fN for all the loci with at least 3 SNPs (2981). When plotted, the nonsynonymous substitution rate (fN) between and within species shows a linear relationship (Fig. S4). The best-fit regression line for the data was fN-between=0.019 +1.024 9fN-within (Fig. S4), indicating that the nonsynonymous substitu-tion rate between the species is roughly equal to that within species. In combination, the test of selection indicates that positive selection may be acting on a sub-set of coding sequences, but divergence of a majority of the other loci may not be a result of divergent selection between species.
Candidate pleiotropic genes
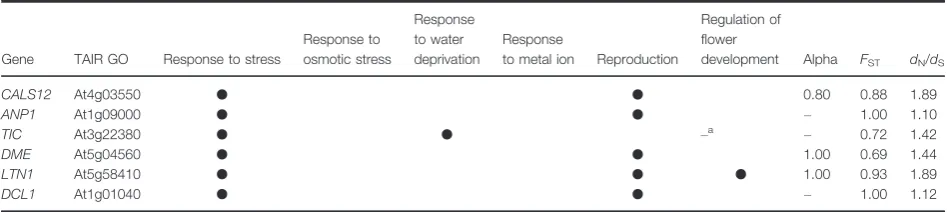
Firstly, of the 37 unigenes potentially evolving under positive selection, 23 had significant matches with Ara-bidopsisorthologs, and six of these orthologs possess GO annotations associated with ecological adaptation and reproductive isolation (Table 3). FPA was the only other locus that possessed more than one of the GO categories of interest, but these categories were both associated with reproduction. The proportion of loci with potential pleiotropic effects relevant to our specia-tion scenario (six of 23) was significantly greater than would be expected by chance (comparison to the refer-ence transcriptome; paired z-test P<0.0001). We also confirmed that these potential ‘speciation genes’ with pleiotropic effect had greater coalescent depths than neutral loci, although loci equally subject to divergent
selection without the relevant GO annotations showed similar coalescence depths (Fig. S5).
Secondly, we looked at candidate pleiotropic genes that showed the greatest difference in expression between species. Of the 6240 genes identified in the differential expression analysis, 145 had NODE in at least one tissue (floral=30, leaf=65, root=72). Of these, 86 were annotated against Arabidopsis, with two orthologs possessing GO annotations matching our pleiotropic criteria. An additional eight loci with NODE had more than one of the relevant ecological GO anno-tations but lacked annotation for functions associated with reproduction. Hence, we also screened these can-didates for their effects on flowering time in case there was an unknown link to reproductive isolation. We obtained Arabidopsisknockout mutants for orthologs to eight of these 10 candidates. When we grew these Ara-bidopsis mutant lines, four showed significantly delayed flowering time (SAL1, DCL4, NAC072, AKR4C9, Fig. 4 and Table S9). InHowea, three orthologs of these genes had NODE and were up-regulated in vegetative tissues of H. forsteriana (SAL1 leaf, DCL4 Floral and root,
AKR4C9 root), and one up-regulated in the roots of
H. belmoreana (NAC072). Furthermore, although not showing NODE, several of these genes were signifi-cantly up-regulated in other tissues for H. forsteriana
(SAL1 in floral tissue, DCL4 in leaves and AKR4C9 in flowers) and for H. belmoreana (NAC072 in flowers and leafs).
Discussion
The population genetic data presented here shows that the two Howea species are now well differentiated. A key component of the previously proposed scenario for their ecological speciation is the colonization of cal-carenite deposits around the coastal margins of LHI by the ancestor of H. forsteriana (Savolainen et al., 2006). Colonizing calcarenite would likely have involved adap-tation to novel ecological stressors, most notably differ-ences in pH, soil moisture and salinity (Papadopulos
[image:10.595.63.537.590.696.2]et al., 2013). This was hypothesized to have indirectly
Table 3 Genes showing signals of positive selection (dN/dS>1) and with functions associated with reproduction and stress.
Gene TAIR GO Response to stress
Response to osmotic stress
Response to water deprivation
Response
to metal ion Reproduction
Regulation of flower
development Alpha FST dN/dS
CALS12 At4g03550 ● ● 0.80 0.88 1.89
ANP1 At1g09000 ● ● – 1.00 1.10
TIC At3g22380 ● ● –a –
0.72 1.42
DME At5g04560 ● ● 1.00 0.69 1.44
LTN1 At5g58410 ● ● ● 1.00 0.93 1.89
DCL1 At1g01040 ● ● – 1.00 1.12
a
displaced flowering phenologies, resulting in prezygotic isolation and initiating speciation (Savolainen et al., 2006). The association between soil adaptation and flowering time differences could have been driven directly by pleiotropic loci, or indirectly through linkage disequilibrium; here, we focused on the former possibil-ity. Using RNA-seq, we sought to identify the genetic divergences between species associated with extant eco-logical and reproductive differences. Furthermore, we explored the possibility that ecological speciation in
Howeamay have been driven by pleiotropic loci. We expected to measure divergence in the coding sequences of genes associated with reproductive isola-tion and/or ecological adaptaisola-tion based on current phe-notypic differences between the two species. The nucleotide fixation index across protein coding sequences was high, with 1320 genes showing fixed differences between species at variable sites (i.e. 9% of the reference transcriptome with FST =1). The gene ontologies of these loci are not randomly distributed among biological processes, and we observe the enrich-ment of several functional categories pertinent to mod-ern differences between the species, notably those associated with water deprivation, phosphate starvation (linked to pH) and flower development. Sandy cal-carenite soils drain faster than volcanic muds, and soil
water has been shown to be one of the key differences in the Howeaecology (Papadopulos et al., 2013).Howea forsteriana grows on calcarenite with a higher pH (pH 8–9) than the volcanic substrate where it co-occurs withH. belmoreana(Savolainenet al., 2006; Papadopulos
et al., 2013). At higher pH, phosphorus forms insoluble salts with calcium and magnesium, limiting its availabil-ity to plants and potentially causing starvation (Yiet al., 2005).
Flowering time displacement is thought to be the pri-mary component of prezygotic isolation inHowea, with
H. forsteriana flowering earlier (Savolainen et al., 2006; H. Hipperson, L.T. Dunning, C. Devaux, W.J. Baker, R.K. Butlin, I. Hutton, A.S.T. Papadopulos, C.M. Smadja, T.C. Wilson & V.S. Savolainen, submitted). Several of the GO terms enriched in the loci with high
FST are associated with reproduction, in particular with ‘negative regulation of flower development’. With the high number of fixed differences, it is difficult to sepa-rate the loci that were involved in the initial speciation process from subsequent neutral divergence or adapta-tion. However, these broadscale patterns of fixed genetic differences between Howeaspecies indicate that the current ecological and phenotypic distinctions have been among the major selective pressures driving their evolution on LHI.
(a) (b)
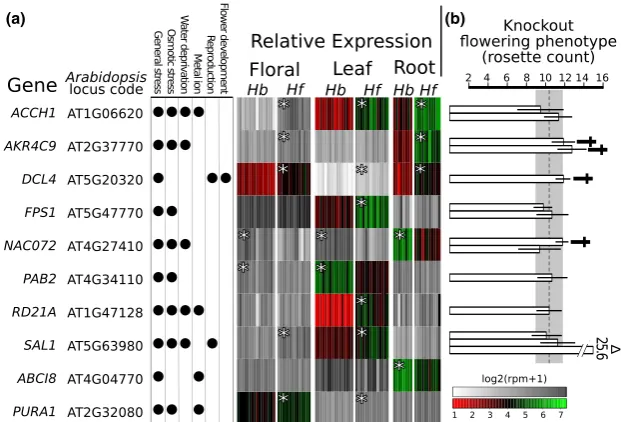
Fig. 4 Potentially pleiotropic loci that may influence ecological adaptation and flowering phenology differences betweenHowea, and their phenotypic effect inArabidopsismutants. (a) List of genes with selected gene ontology annotations and their relative gene expression using multiple individuals (vertical bars) in three tissues forHowea forsteriana(Hf) andHowea belmoreana(Hb). The grey scale represents general differential expression, whereas the red-green scale represents genes consistently expressed at a higher level in all individuals of one of the species (NODE: nonoverlapping differential expression). Genes significantly differentially expressed are indicated (*). (b) Number of rosette leaves (a proxy for flowering time and standard procedure when working withArabidopsis) inArabidopsisknockouts in comparison with the wild type (dotted line and standard deviation in grey shade; dagger (†) indicates significant differences). Each bar represents an independent knockout line, with standard deviation shown. Significant results from the literature are indicated by a triangle (SAL1Xiong
[image:11.595.140.451.86.297.2]We further identified 37 genes evolving potentially under positive selection, one of which, FPA, regulates flowering phenology by suppressing the expression of one of the most common regulators of flowering, Flow-ering Locus C (Michaels & Amasino, 2001). FPA forms part of the autonomous flowering pathway where flow-ering is induced by endogenous regulators, indepen-dently from photoperiod or gibberellin hormones (Srikanth & Schmid, 2011). Although originally identi-fied in annual Arabidopsis, orthologous loci from this pathway have been conserved in numerous other spe-cies (Simpson, 2004), including woody perennials (Zhanget al., 2011).
We also expected that loci involved with the ecolog-ical speciation scenario would have diverged before neutral loci within the genome. We showed that this was the case (Fig. S5). However, it is hard to disentan-gle this result from the general expectation that genes with fixed differences between species (subject to divergence selection) will show deeper times to coales-cence. In fact, a set of genes without relevant GO terms but equally under positive selection showed sim-ilar coalescence depths (Fig. S5). Therefore, further, finer-scale coalescence analyses are required for stron-ger support.
Differences in gene expression may promote ecologi-cal speciation by directly affecting adaptive divergence in traits causing reproductive isolation (Pavey et al., 2010). As with coding sequences, we expected to observe variation in the pattern of gene expression for loci associated with the ecological and reproductive dif-ferences. We found significant differential gene expres-sion for 43% of the transcriptome in at least one tissue type. It is of course possible that not all of this variation is adaptive and that a proportion can be attributed to other processes, for example genetic drift (Khaitovich
et al., 2004, 2005). However, within these genes several GO categories are enriched that are relevant to abiotic stress in Howea, such as ‘flavonoid metabolic process’ and ‘tryptophan biosynthetic process’ (Table S6). Loci associated with flavonoid metabolic processes are pre-dominantly differentially expressed betweenHowea spe-cies in the floral tissue. Flavonoids are a diverse family of plant secondary metabolites involved in numerous processes (Winkel-shirley, 2001), which are induced as a result of abiotic stresses such as drought, metal toxic-ity and nutrient deprivation (Hernandez et al., 2009). They play a role in multiple stress responses by acting as antioxidants reducing reactive oxygen species, a common by-product of environmental stress (Hern an-dez et al., 2009). Loci associated with tryptophan syn-thesis are predominately up-regulated in the leaves of
H. forsteriana. Tryptophan has been shown to play a role in drought tolerance, with foliar application of this amino acid significantly increasing water content and leaf stability in drought-stressed maize (Rao et al., 2012).
No genetic structure was detected in H. forsteriana,
with our data indicating that this species forms a sin-gle population on LHI. The lack of divergence between the different soil types could be a result of the limited number of individuals sampled for whole
transcrip-tome sequencing, which may be only powerful
enough to detect a strong population structure. Indeed, previous population genetic studies using more individuals and AFLP data were able to detect a signal of isolation by environment within H. forsteriana
(Papadopulos et al., 2014), although STRUCTURE anal-ysis on AFLP data has not revealed genetic structure connected to soil type (Babik et al., 2009; Papadopulos
et al., 2013). Adaptation to soil types is further supported by fitness differences between the species (H. Hipperson, L.T. Dunning, C. Devaux, W.J. Baker, R.K. Butlin, I. Hutton, A.S.T. Papadopulos, C.M. Smadja, T.C. Wilson &V.S. Savolainen,submitted). Although we did not find any genetic structure between the trees from the different soil types, we found three genes differentially expressed in the roots, including a transmembrane amino acid transporter, a cell wall-associated kinase and a protein of unknown function. It is possible that the differences in expres-sion between soil types are driven by phenotypic plas-ticity rather than background genetic differences. Interestingly, there were no significant expression dif-ferences in the floral tissue.
We identified loci either differentially expressed or under positive selection between species, but we do not know which genes are physically linked. This may have been an important factor for ecological speciation in
Howea. For instance, ifFPA(involved in flowering time control and found to be under positive selection between species) and ACCH1 (related to salinity response and showing significant NODE in all the tis-sues) were physically linked, this could have led to co-occurring changes in flowering time and adaptation to soil betweenHoweaspecies. Until linkage information is available, we cannot judge this possibility. However, we looked for loci that have predicted functions consistent with a pleiotropic effect on both flowering time and soil adaptation. We identified six such potential pleiotropic genes, SAL1, DCL4, NAC072, AKR4C9, DCL1 and TIC. These loci were either differentially expressed or under positive selection between species, plus their inferred functions were relevant to both differential soil adapta-tion and altered flowering time (Fig. 4 and Table 3). These genes are candidate ecological ‘speciation genes’:
(i)AKR4C9 encodes an oxidoreductase enzyme profi-cient in reducing many substrates, and is up-regulated in response to cold, salt and drought stress in Arabidop-sis (Simpson et al., 2009). Transgenic barley over-expressing Arabidopsis AKR4C9 exhibit increased tolerance to oxidative and cadmium-induced stress (Eva
(ii)DCL1 encodes a dicerlike enzyme central to micro-RNA biogenesis, which plays a critical role in regulating multiple plant processes including abiotic stress toler-ance (Lima et al., 2012; Bologna & Voinnet, 2014). When DCL1is knocked out in Arabidopsis, flowering is delayed (Schmitzet al., 2007).
(iii)DCL4 is involved with post-transcriptional gene silencing through the biogenesis of small interfering RNA associated with many processes including juve-nile-to-adult phase transition (Xie et al., 2005) and cell-to-cell gene silencing (Dunoyeret al., 2005) in Ara-bidopsis. In Pyrenean Rocket, DCL4 was found to be under selection during rapid adaptation to novel envi-ronments (Vandepitteet al., 2014).
(iv)NAC072, also known as RD26, encodes a transcrip-tion factor induced in response to desiccatranscrip-tion and
salin-ity in the Physic Nut (Zhang et al., 2014).
Overexpression of NAC072 in Arabidopsis significantly increases drought tolerance (Tranet al., 2004).
(v)SAL1 encodes a bifunctional enzyme with 30(20),50 -bisphosphate nucleotidase and inositol polyphosphate 1-phosphatase activities; Arabidopsis mutants have altered abiotic stress tolerance (Xiong et al., 2001; Wilson et al., 2009) and increased salt sensitivity in seedlings (Chenet al., 2011).
(vi)TIC is a circadian regulator that integrates develop-mental, metabolic and environmental signals (Sanchez-Villarrealet al., 2013); loss ofTICfunction results in late flowering and increased drought tolerance in Arabidop-sis(Sanchez-Villarrealet al., 2013).
To verify the phenotypic effects of the candidate loci above, we monitored flowering time differences in
Arabidopsis knockout mutants. Ideally, we would have created transgenic Howea or knockout mutants. How-ever, this is currently impractical, with Howea taking at least 10 years to reach maturity and flower. Also,
Arabidopsis may not be the ideal proxy for Howea, being separated by millions of years of evolution, and over this timescale, the genes identified may have developed novel or secondary functions. Corroboration of these results using further model plant systems, for example rice, would increase support for the general-ity of these gene functions and support the argument that these loci have similar functions in palms. How-ever, it has already been shown that much of the core flowering time control system is conserved across widely diverged species, with measurable phenotypic effects as a result of transferring genes from monocot to dicot (rice to potato; Navarro et al., 2011), perennial to annual and vice versa (Arabidopsisto and from Pop-ulus; Pe~na et al., 2001), tropical to temperate (avocado to Arabidopsis; Ziv et al., 2014), and photoperiodic to nonphotoperiodic species (tomato to Arabidopsis; Ben-Naim et al., 2006). There is more interspecific variation in abiotic stress responses, but there are still numerous
conserved genes and pathways for drought and
salinity tolerance between taxonomically diverse groups such as angiosperms and bryophytes (Cuming
et al., 2007; Pareek et al., 2010; Wang et al., 2010). Although it is not feasible to document the effect of the palm genes in a palm system, it would be possible to assess their function in a model plant system, for example phenotype rescue studies to show homology of function of palm genes expressed in transgenic Ara-bidopsisor rice.
It is almost certain that more genes than the six candidates above were involved in the speciation of
Howea. RNA-Seq data have previously been used to show that selection acting on a handful of genes may be enough to cause speciation in other plants, such as Senecio species from Mt. Etna adapted to different altitudes (Chapman et al., 2013). Disentangling genes involved with the initial speciation process from those resulting from post-speciation local adaptation to contrasting environments can be difficult using transcriptome data alone. So far, our evidence sup-ports the decoupling of divergence in gene expression and coding sequences in the evolution of species (Moyers & Rieseberg, 2013). For example, in secon-darily woody sunflowers, these two processes were either complementary or mutually exclusive depend-ing on the loci in question (Moyers & Rieseberg, 2013).
Here, we have provided evidence that pleiotropic connections potentially driving speciation exist in
Howea. Furthermore, we now know that associations between soil adaptation and flowering likely hold the key to sympatric speciation in Howea palms, but cru-cially, a more complete account of the respective roles of linkage disequilibrium vs. pleiotropy during this pro-cess is required.
Acknowledgments
We thank the Lord Howe Island Board and the New South Wales National Park and Wildlife Services for granting permission for our research on LHI. We thank Hank and Sue Bower, Christo Haselden, Peter Weston, Larry Wilson, Matthew Hill, Rex Byrne, Louise Wilson and Damien Ball for their help in the field; Nicolas Ortiz Vaquerizas, Martin Selby and Tom Smith for tech-nical support; and Oliver Windram, Mark Chase and Tim Barraclough for comments. The internal CNRS reference ID for this publication is ISEM 2016-096. We thank the European Research Council, the UK Natural Environment Research Council and the Royal Society for funding. We would also like to thank Judith Mank and the anonymous reviewers for their insightful com-ments.
References
Abzhanov, A., Protas, M., Grant, B.R., Grant, P.R. & Tabin, C.J. 2004. Bmp4 and morphological variation of beaks in Darwin’s finches.Science305: 1462–1465.
Babik, W., Butlin, R.K., Baker, W.J., Papadopulos, A.S.T., Bou-lesteix, M., Anstett, M.-C.et al.2009. How sympatric is spe-ciation in the Howeapalms of Lord Howe Island? Mol. Ecol. 18: 3629–3638.
Benazzo, A., Panziera, A. & Bertorelle, G. 2015. 4P: fast com-puting of population genetics statistics from large DNA poly-morphism panels.Ecol. Evol.5: 172–175.
Ben-Naim, O., Eshed, R., Parnis, A., Teper-Bamnolker, P., Sha-lit, A., Coupland, G. et al.2006. The CCAAT binding factor can mediate interactions between CONSTANS-like proteins and DNA.Plant J.46: 462–476.
Bolger, A.M., Lohse, M. & Usadel, B. 2014. Trimmomatic: a flexible trimmer for Illumina sequence data. Bioinformatics 30: 2114–2120.
Bologna, N.G. & Voinnet, O. 2014. The diversity, biogenesis, and activities of endogenous silencing small RNAs in Ara-bidopsis.Annu. Rev. Plant Biol.65: 473–503.
Brooke, B.P., Woodroffe, C.D., Murray-Wallace, C.V., Heijnis, H. & Jones, B.G. 2003. Quaternary calcarenite stratigraphy on Lord Howe Island, southwestern Pacific Ocean and the record of coastal carbonate deposition. Quat. Sci. Rev. 22: 859–880.
Burriesci, M.S., Lehnert, E.M. & Pringle, J.R. 2012. Fulcrum: condensing redundant reads from high-throughput sequenc-ing studies.Bioinformatics28: 1324–1327.
Chapman, M.A., Hiscock, S.J. & Filatov, D.A. 2013. Genomic divergence during speciation driven by adaptation to alti-tude.Mol. Biol. Evol.30: 2553–2567.
Chen, H., Zhang, B., Hicks, L.M. & Xiong, L. 2011. A nucleo-tide metabolite controls stress-responsive gene expression and plant development.PLoS ONE6: e26661.
Chung, H., Loehlin, D.W., Dufour, H.D., Vaccarro, K., Millar, J.G. & Carroll, S.B. 2014. A single gene affects both ecologi-cal divergence and mate choice in Drosophila. Science 343: 1148–1151.
Coyne, J.A. & Orr, H.A. 2004. Speciation. Sinauer Associates Inc., Sunderland, MA.
Cuming, A.C., Cho, S.H., Kamisugi, Y., Graham, H. & Quatrano, R.S. 2007. Microarray analysis of transcriptional responses to abscisic acid and osmotic, salt, and drought stress in the moss,
Physcomitrella patens.New Phytol.176: 275–287.
Danecek, P., Auton, A., Abecasis, G., Albers, C.A., Banks, E., DePristo, M.A.et al.& G.P.A Group. 2011. The variant call format and VCFtools.Bioinformatics27: 2156–2158.
De Wit, P., Pespeni, M.H., Ladner, J.T., Barshis, D.J., Seneca, F., Jaris, H.et al.2012. The simple fool’s guide to population genomics via RNA-Seq: an introduction to high-throughput sequencing data analysis.Mol. Ecol. Resour.12: 1058–1067. Dieckmann, U. & Doebeli, M. 1999. On the origin of species
by sympatric speciation.Nature400: 354–357.
Drummond, A.J. & Rambaut, A. 2007. BEAST: Bayesian evo-lutionary analysis by sampling trees.BMC Evol. Biol.7: 214. Dunoyer, P., Himber, C. & Voinnet, O. 2005. DICER-LIKE 4 is
required for RNA interference and produces the 21-nucleo-tide small interfering RNA component of the plant cell-to-cell silencing signal.Nat. Genet.37: 1356–1360.
Earl, D.A. & vonHoldt, B.M. 2012. STRUCTURE HARVESTER: a website and program for visualizing STRUCTURE output and implementing the Evanno method. Conserv. Genet. Resour.4: 359–361.
Eva, C., Toth, G., Oszvald, M. & Tam as, L. 2014. Overproduc-tion of an Arabidopsis aldo–keto reductase increases barley tolerance to oxidative and cadmium stress by anin vivo reac-tive aldehyde detoxification.Plant Growth Regul.74: 55–63. Evanno, G., Regnaut, S. & Goudet, J. 2005. Detecting the
number of clusters of individuals using the software STRUC-TURE: a simulation study.Mol. Ecol.14: 2611–2620. Falush, D., Stephens, M. & Pritchard, J.K. 2003. Inference of
population structure using multilocus genotype data: linked loci and correlated allele frequencies. Genetics 164: 1567–1587.
Fitzpatrick, B.M., Fordyce, J.A. & Gavrilets, S. 2008. What, if anything, is sympatric speciation?J. Evol. Biol.21: 1252–1459. Foll, M. & Gaggiotti, O. 2008. A genome-scan method to iden-tify selected loci appropriate for both dominant and codomi-nant markers: a Bayesian perspective.Genetics180: 977–993. Gavrilets, S. & Vose, A. 2007. Case studies and mathematical
models of ecological speciation. 2. Palms on an oceanic island.Mol. Ecol.16: 2910–2921.
Goudet, J. 2005. HIERFSTAT, a package for R to compute and test hierarchical F-statistics.Mol. Ecol. Notes5: 184–186. Grabherr, M.G., Haas, B.J., Yassour, M., Levin, J.Z.,
Thomp-son, D.A., Amit, I. et al. 2011. Full-length transcriptome assembly from RNA-Seq data without a reference genome.
Nat. Biotechnol.29: 644–652.
Haas, B.J., Papanicolaou, A., Yassour, M., Grabherr, M., Blood, P.D., Bowden, J. et al. 2013. De novo transcript sequence reconstruction from RNA-seq using the Trinity platform for reference generation and analysis.Nat. Protoc.8: 1494–1512. Hernandez, I., Alegre, L., Van Breusegem, F. & Munne-Bosch,
S. 2009. How relevant are flavonoids as antioxidants in plants?Trends Plant Sci.14: 125–132.
Hey, J. 2010. Isolation with migration models for more than two populations.Mol. Biol. Evol.27: 905–920.
Hoekstra, H.E., Hirschmann, R.J., Bundey, R.A., Insel, P.A. & Crossland, J.P. 2006. A single amino acid mutation con-tributes to adaptive beach mouse color pattern.Science313: 101–104.
Khaitovich, P., Weiss, G., Lachmann, M., Hellmann, I., Enard, W., Muetzel, B. et al. 2004. A neutral model of transcrip-tome evolution.PLoS Biol.2: E132.
Khaitovich, P., P€a€abo, S. & Weiss, G. 2005. Toward a neutral evolutionary model of gene expression. Genetics 170: 929– 939.
Kirkpatrick, M. & Ravigne, V. 2002. Speciation by natural and sexual selection: models and experiments. Am. Nat. 159: S22–S35.
Lamesch, P., Berardini, T.Z., Li, D., Swarbreck, D., Wilks, C., Sasidharan, R. et al. 2012. The Arabidopsis Information Resource (TAIR): improved gene annotation and new tools.
Nucleic Acids Res.40: D1202–D1210.
Lee, H.K., Braynen, W., Keshav, K. & Pavlidis, P. 2005. Ermi-neJ: tool for functional analysis of gene expression data sets.
BMC Bioinformatics6: 269.
Li, H. & Durbin, R. 2009. Fast and accurate short read align-ment with Burrows-Wheeler transform. Bioinformatics 25: 1754–1760.
Li, H., Handsaker, B., Wysoker, A., Fennell, T., Ruan, J., Homer, N.et al.2009. The sequence alignment/map format and SAMtools.Bioinformatics25: 2078–2079.
Lima, J.C.De, Loss-morais, G. & Margis, R. 2012. MicroRNAs play critical roles during plant development and in response to abiotic stresses.Genet. Mol. Biol.4: 1069–1077.
McDonald, J. & Kreitman, M. 1991. Adaptive protein evolu-tion at theAdhlocus inDrosophila.Nature351: 652–654. McDougall, I., Embleton, B.J.J. & Stone, D.B. 1981. Origin and
evolution of Lord Howe Island, southwest Pacific Ocean.J. Geol. Soc. Aust.28: 155–176.
Michaels, S.D. & Amasino, R.M. 2001. Loss of FLOWERING LOCUS C activity eliminates the late-flowering pheno-type of FRIGIDA and autonomous pathway mutations but not responsiveness to vernalization. Plant Cell 13: 935–941.
Moyers, B.T. & Rieseberg, L.H. 2013. Divergence in gene expression is uncoupled from divergence in coding sequence in a secondarily woody sunflower. Int. J. Plant Sci. 174: 1079–1089.
Navarro, C., Abelenda, J.A., Cruz-Oro, E., Cuellar, C.A., Tamaki, S., Silva, J. et al. 2011. Control of flowering and storage organ formation in potato by FLOWERING LOCUS T.Nature478: 119–122.
Nosil, P. 2012. Ecological Speciation. Oxford University Press, Oxford.
Oksanen, J., Blanchet, F.G., Kindt, R., Legendre, P., Minchin, P.R., O’Hara, R.B.et al.2013. Package ‘vegan’.R Packag. Ver. 254: 20–28.
Ouyang, S., Zhu, W., Hamilton, J., Lin, H., Campbell, M., Childs, K. et al. 2007. The TIGR Rice Genome Annotation Resource: improvements and new features.Nucleic Acids Res. 35: D883–D887.
Papadopulos, A.S.T., Price, Z., Devaux, C., Hipperson, H., Smadja, C.M., Hutton, I.et al.2013. A comparative analysis of the mechanisms underlying speciation on Lord Howe Island.J. Evol. Biol.26: 733–745.
Papadopulos, A.S.T., Kaye, M., Devaux, C., Hipperson, H., Lighten, J., Dunning, L.T.et al.2014. Evaluation of genetic isolation within an island flora reveals unusually widespread local adaptation and supports sympatric speciation. Philos. Trans. R. Soc. Lond. B Biol. Sci.1648: 20130342.
Pareek, A., Sopory, S., Bonhert, H. & Govindjee. 2010.Abiotic Stress Adaptation in Plants: Physiological, Molecular and Genomic Foundation. Springer, New York.
Pavey, S.A., Collin, H., Nosil, P. & Rogers, S.M. 2010. The role of gene expression in ecological speciation.Ann. N. Y. Acad. Sci.1206: 110–129.
Pena, L., Mart~ ın-Trillo, M., Juarez, J., Pina, J.A., Navarro, L. & Martınez-Zapater, J.M. 2001. Constitutive expression of Ara-bidopsis LEAFY or APETALA1 genes in citrus reduces their generation time.Nat. Biotechnol.19: 263–267.
Pfaffl, M.W. 2001. A new mathematical model for relative quantification in real-time RT–PCR.Nucleic Acids Res.29: e45. Pritchard, J.K., Stephens, M. & Donnelly, P. 2000. Inference of population structure using multilocus genotype data.Genetics 155: 945–959.
Ramakers, C., Ruijter, J.M., Deprez, R.H.L. & Moorman, A.F.M. 2003. Assumption-free analysis of quantitative
real-time polymerase chain reaction (PCR) data. Neurosci. Lett. 339: 62–66.
Rao, S.R., Qayyum, A., Razzaq, A., Ahmad, M., Mahmood, I. & Sher, A. 2012. Role of foliar application of salicylic acid and l-tryptophan in drought tolerance of maize. J. Anim. Plant Sci.22: 768–772.
Robinson, M.D., McCarthy, D.J. & Smyth, G.K. 2010. edgeR: A Bioconductor package for differential expression analysis of digital gene expression data.Bioinformatics26: 139–140. Rundle, H.D. & Nosil, P. 2005. Ecological speciation.Ecol. Lett.
8: 336–352.
Sanchez-Villarreal, A., Shin, J., Bujdoso, N., Obata, T., Neu-mann, U., Du, S.-X. et al.2013. TIME FOR COFFEE is an essential component in the maintenance of metabolic home-ostasis inArabidopsis thaliana.Plant J.76: 188–200.
Savolainen, V., Anstett, M.C., Lexer, C., Hutton, I., Clarkson, J.J., Norup, M.V.et al.2006. Sympatric speciation in palms on an oceanic island.Nature441: 210–213.
Schluter, D. 2000. The Ecology of Adaptive Radiation. Oxford Univ. Press, Oxford.
Schluter, D. 2001. Ecology and the origin of species. Trends Ecol. Evol.16: 372–380.
Schmieder, R., Lim, Y.M. & Edwards, R. 2012. Identification and removal of ribosomal RNA sequences from metatran-scriptomes.Bioinformatics28: 433–435.
Schmitz, R.J., Hong, L., Fitzpatrick, K.E. & Amasino, R.M. 2007. DICER-LIKE 1 and DICER-LIKE 3 redundantly act to promote flowering via repression of FLOWERING LOCUS C inArabidopsis thaliana.Genetics176: 1359–1362.
Simpson, G.G. 2004. The autonomous pathway: epigenetic and post-transcriptional gene regulation in the control of Ara-bidopsisflowering time.Curr. Opin. Plant Biol.7: 570–574. Simpson, P.J., Tantitadapitak, C., Reed, A.M., Mather, O.C.,
Bunce, C.M., White, S.A. et al. 2009. Characterization of two novel aldo-keto reductases fromArabidopsis: expression patterns, broad substrate specificity, and an open active-site structure suggest a role in toxicant metabolism following stress.J. Mol. Biol.392: 465–480.
Smadja, C.M. & Butlin, R.K. 2011. A framework for comparing processes of speciation in the presence of gene flow. Mol. Ecol.20: 5123–5140.
Smith, N.G.C. & Eyre-walker, A. 2002. Adaptive protein evolu-tion inDrosophila.Nature415: 1022–1024.
Srikanth, A. & Schmid, M. 2011. Regulation of flowering time: all roads lead to Rome.Cell. Mol. Life Sci.68: 2013–2037. Stephens, M., Smith, N.J. & Donnelly, P. 2001. A new
statisti-cal method for haplotype reconstruction from population data.Am. J. Hum. Genet.68: 978–989.
Supek, F., Bosnjak, M.,Skunca, N. &Smuc, T. 2011. REVIGO summarizes and visualizes long lists of gene ontology terms.
PLoS ONE6: e21800.
Ting, C.-T., Tsaur, S.C., Wu, M.L. & Wu, C.I. 1998. A rapidly evolving homeobox at the site of a hybrid sterility gene.
Science282: 1501–1504.
Tran, L.P., Nakashima, K., Sakuma, Y., Simpson, S.D., Fujita, Y., Maruyama, K.et al.2004. Isolation and functional analy-sis of Arabidopsis stress-inducible NAC transcription factors that bind to a drought-responsive cis-element in the early responsive to dehydration stress 1 promoter. Plant Cell 16: 2481–2498.