Journal of Physics: Conference Series
PAPER • OPEN ACCESS
A Quantitative Evaluation of Electron Beam
Sensitivity in Calcite Nanoparticles
To cite this article: R W M Hooley et al 2017 J. Phys.: Conf. Ser. 902 012005
View the article online for updates and enhancements.
Related content
PGMA as a High Resolution, High Sensitivity Negative Electron Beam Resist Yoshio Taniguchi, Yoshio Hatano, Hiroshi Shiraishi et al.
-Device for the study of single crystals thermoluminescence. Application to the emission of calcium oxide.
M Schwartz, M Kane, R Falgon et al.
-Pyrite-pyrrhotite intergrowths in calcite marble from Bistriski Vintgar, Slovenia J Zavašnik
-Recent citations
Factors affecting electron beam damage in calcite nanoparticles
Rob Hooley et al
1234567890
Electron Microscopy and Analysis Group Conference 2017 (EMAG2017) IOP Publishing IOP Conf. Series: Journal of Physics: Conf. Series 902 (2017) 012005 doi :10.1088/1742-6596/902/1/012005
A Quantitative Evaluation of Electron Beam Sensitivity in
Calcite Nanoparticles
R W M Hooley 1, A P Brown 1, A N Kulak 2, F C Meldrum 2, R M D Brydson 1
1School of Chemical and Process Engineering, University of Leeds, Leeds, LS2 9JT, UK 2School of Chemistry, University of Leeds, Leeds, LS2 9JT, UK
Email: [email protected]
Abstract We present analysis and quantification of electron beam sensitivity in calcite in order to identify damage thresholds under which bright field TEM imaging, selected area electron diffraction and scanning TEM should be performed. A large reduction in damage under TEM was found when operating at 300 kV rather than 200 kV, suggesting that the irradiation induced degradation of calcite to calcium oxide is dominated by radiolysis. At 300 kV, bright field STEM imaging was able to retain lattice information at higher fluences than was possible using TEM and, although damage was still seen to occur, there was no observation of the formation of crystalline calcium oxide.
1. Introduction
Calcium carbonate or calcite is of widespread interest as a structural biomaterial and for its environmental and industrial importance, which has led to extensive research into its formation and properties. Understanding its structure and chemistry at the nanoscale is of interest especially in relation to its interaction with other components in complex mixtures, including fuel additives and pharmaceutical formulations. Whilst a heavily researched material, calcium carbonate is well known for its sensitivity under electron irradiation in both conventional and scanning TEM damaging through its radiolytic decomposition to calcium oxide. Although recent reports have provided partial quantification of the damage process [1-3], the purpose of this study is to use calcite as a model material to compare damage under different conditions and operating modes (e.g. TEM and STEM) and develop damage limitation strategies which may also be applicable to other electron beam sensitive systems [4,5].
2. Experimental
2.1. Materials
Calcite nanoparticles were produced through the carbonation of calcium oxide suspended in water [6]. Production of the calcite polymorph was confirmed by Raman spectroscopy and X-ray diffraction (data not shown). The particles were dried and then suspended in ethanol prior to deposition onto a either a holey carbon or lacy carbon film (Agar Scientific Ltd) for 200 kV experiments, and an ultrathin amorphous carbon or graphene oxide film (EM Resolutions Ltd) for 300 kV experiments, all supported on copper TEM grids.
2.2. 200kV TEM irradiation study
TEM irradiation experiments were carried out at 200 kV in a FEI Tecnai F-20 FEG-TEM with an
Oxford Instruments X-Max 80 mm2 EDX detector and a Gatan Orius CCD. Controlled irradiation at
several electron fluxes from 2.5x10⁴ e-nm-2s-1 to 1.6x10⁵ e-nm-2s-1 was applied to the calcite particles,
2
1234567890
Electron Microscopy and Analysis Group Conference 2017 (EMAG2017) IOP Publishing IOP Conf. Series: Journal of Physics: Conf. Series 902 (2017) 012005 doi :10.1088/1742-6596/902/1/012005
2.3. Comparing irradiation between TEM and STEM
A comparative study of electron beam sensitivity in STEM and TEM was performed in a FEI Titan3
Themis G2 operated at 300 kV on calcite nanoparticles. BF-TEM images were taken with an electron flux of 3.8x10⁵ e-nm-2s-1 at 380x103 times magnification on a Gatan OneView CCD. BF-STEM images
were taken with a probe current of 40 pA, 16 µs dwell time and a pixel size of 57.8 pm giving a fluence of 1.22x10⁶ e-nm-2 per scan. The FFTs of both TEM and STEM micrographs were compared to
investigate changes in crystallinity induced by electron irradiation.
3. Results and Discussion
3.1. 200 kV irradiation
BF-TEM imaging revealed production of what appear to be pores around the calcite particle edges, seen after accumulated fluences of approximately 1.9x10⁶ e-nm-2, irrespective of electron flux (Figures
1B and 2A). Using SAED, the nucleation and growth of nano-crystalline CaO was found to manifest as polycrystalline rings in calcite diffraction patterns at fluences of 3.9x10⁶ e-nm-2 (Figure1B inset),
also irrespective of electron flux (figure 2A). Dark field TEM imaging shows the presence of calcium oxide crystallites preferentially around the outer edges of the irradiated calcite particles (Figure 1C). The pores induced by irradiation may act as sites for the build-up and release of CO2from the particle
bulk and as even as nucleation sites for calcium oxide crystallite formation.
Figure 1A (left)- BFTEM image of calcite particles before irradiation, 1B (centre)- particles after 1.9x10⁷ e-nm-2. 1C (right)- Dark field TEM image of particle after prolonged irradiation, showing
calcium oxide nano-crystallites around the edge of the particle. Inset SAEDPs in Figure 1A correspond to a cluster of particles before and in Figure 1B, after an exposure of 1.1x10⁷ e-nm-2.
A summary of the 200 kV electron fluences required for pore formation and CaO nucleation is shown in Figure 2A. Whilst these values do not exactly pinpoint the threshold fluence for the production of CaO, it does identify the point at which the material can be identified as being no longer purely calcite, thus diffraction information is compromised.
The decomposition of calcite has also been probed by EDX and this shows decay in the oxygen content (Figure 2B). This is consistent with the expected loss of CO2 and, given that it would be
expected to occur near the surface of particles, correlates with the DF-TEM image of crystalline CaO at the surfaces (Figure 1C). The rate of loss of CO2 slows at higher fluences as alteration occurs in the
particle cores leading to diffusion of CO2 through the bulk to either the surface or a pore. The EDX
data suggest that some mass loss is occurring before damage is detectable in BF imaging as pore formation and the appearance of polycrystalline CaO in SAED patterns are only identified at fluences of 1.9x10⁶ e-nm-2 and 3.9x10⁶ e-nm-2 respectively (Figure 2B). Thus we suggest that EDX
measurements should be taken promptly, to avoid unrepresentative spectra.
A
B
B
B
C
[image:3.595.88.492.364.493.2]1234567890
[image:4.595.85.504.133.236.2]Electron Microscopy and Analysis Group Conference 2017 (EMAG2017) IOP Publishing IOP Conf. Series: Journal of Physics: Conf. Series 902 (2017) 012005 doi :10.1088/1742-6596/902/1/012005
Figure 2A (left) – 200 kV electron fluence required for pores to appear in calcite nanoparticles and for
the emergence of polycrystalline CaO rings in SAEDP for several electron fluxes. 2B (right) – EDX
derived atomic ratio of oxygen to calcium under continuous irradiation at 2.6x10⁴ e-nm-2s-1, 200 kV.
The initial low fluence O:Ca atom ratio is shifted from 3:1 to 4.2:1 presumably due to errors in the oxygen k factor used for EDX quantification. Using a correction factor to account for this implies that the O:Ca atom ratio plateaus at ~1.5 at high fluences i.e. full conversion to CaO is not achieved or CO2
is still trapped in pores within the material.
3.2. 300 kV TEM and STEM irradiation
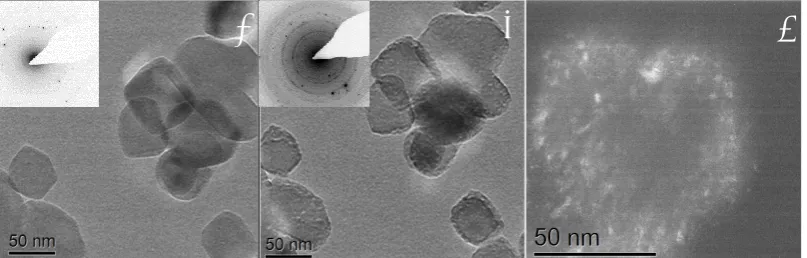
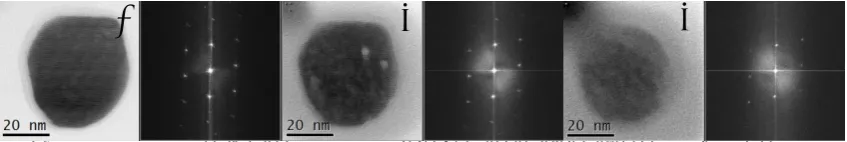
Under 300 kV TEM irradiation the FFT of the BF TEM image begins to show degradation of the calcite lattice, on average at a fluence of 5.5x10⁷ e-nm-2 (Figure 3). This indicates that the extent of radiolysis
is lower than at 200 kV, where the comparable damage threshold is 3.9x10⁶ e-nm-2 (Figure 2A). This
[image:4.595.83.509.406.476.2]is an improvement of 14 times, despite the fact that knock-on damage may become a more significant factor at 300 kV.
Figure 3A –BFTEM image and FFT [44̅1]direction, accumulated fluence 1.3x10⁷ e-nm-23B – 5.6x10⁷
e-nm-2 3C - 1.35x10⁸ e-nm-2.
Under STEM irradiation, crystalline CaO is not visible in the FFT of the BF-STEM image, even up to a fluence of 1.8x10⁸ e-nm-2, (Figure 4), suggesting that STEM may be a better choice when imaging
calcium carbonate based materials. Features are seen in the STEM images throughout the irradiation series that are seen to move to the edges of the particle and disappear (white spots in Figure 4B), these may be gas bubbles trapped under the contamination layer that reach the edge of the particle and dissipate into the vacuum.
Figure 4A – BFSTEM image and FFT [44̅1] direction, accumulated fluence 1.22x10⁶ e-nm-2 4B –
5.5x10⁷ e-nm-24C - 1.87x10⁸ e-nm-2.
The particle is still damaging under STEM irradiation, as the particle is seen to change shape over prolonged irradiation (Figure 4A and 4C) and bubbles appear under the contamination layer, however no crystalline CaO is observed, indicating either limited radiolysis, or the production of non-crystalline
A
B
C
A
B
B
B
[image:4.595.85.509.584.655.2]4
1234567890
Electron Microscopy and Analysis Group Conference 2017 (EMAG2017) IOP Publishing IOP Conf. Series: Journal of Physics: Conf. Series 902 (2017) 012005 doi :10.1088/1742-6596/902/1/012005
reduction of beam damage, as the contamination layer may be reducing the mobility of damage products, or reducing the incident electron flux.
The reduction of the calcite TEM FFT signal as calcite degrades with 300 kV irradiation matches well with the identification of CaO in SAEDPs, which is seen to increase in intensity after ~5.5x10⁷ e
-nm-2 (Figure 5A). Thus any phase contrast lattice imaging or selected area diffraction at 300 kV should
[image:5.595.116.474.248.357.2]be completed before this fluence is reached. Quantification of the reduction in spot intensity in the FFTs of BF-STEM images of calcite over prolonged irradiation does not show a threshold nor is the formation of CaO identified (Figure 5B). Thus alteration occurs either due to reduced crystallinity, and/or the build-up of hydrocarbon contamination. We note that the amorphous background, seen in the FFTs (Figure 4A-C) is seen to increase in intensity under irradiation.
Figure 5A (left) - Integrated intensity of calcite (014̅) spot and section of CaO (111) ring under 300
kV TEM irradiation 5B (right) - Integrated intensity of calcite (014̅) spot under 300 kV STEM.
4. Conclusions
Identification of electron fluence thresholds for different TEM analytical techniques can be prioritised based on the extent of material degradation that is deemed acceptable. For example, we have shown that in calcite, irradiation at 200 kV by bright field imaging should be undertaken at fluences below 1.9x10⁶ e-nm-2 and diffraction below 3.9x10⁶ e-nm-2. EDX measurements should be taken with as little
pre-irradiation as possible due to the rapid loss of CO2. When operating at 300 kV rather than 200 kV,
the TEM damage threshold of calcite increased significantly, from 3.9x10⁶ e-nm-2 to 5.5x10⁷ e-nm-2,
due to the reduction in radiolysis damage, caused by the reduction of the inelastic cross section. STEM of calcite at 300 kV however, was able to preserve crystallinity and lattice information up to higher fluences compared to both 200 kV and 300 kV TEM. There was no observable degradation into crystalline CaO at STEM fluences up to 1.87x10⁸ e-nm-2. In order to fully compare electron beam
damage in STEM and TEM, it is necessary to eliminate hydrocarbon contamination, to avoid any influence on the effects of electron beam irradiation.
These thresholds will be used during the structural and chemical analysis of calcium carbonate reverse micelles, currently used industrially as fuel additives [8].
Acknowledgements
RH acknowledges a studentship funded through the EPSRC CDT in Complex Particulate Products and Processes (cP3-CDT) and acknowledges co-funding from Thermo-Fisher Scientific (formerly FEI Co).
References
[1] Hoffmann R. et al, Micron, 2014, 62, 28-36.
[2] Golla-Schindler U. et al, Microscopy and microanalysis 2014, 20, 715-722. [3] Kovarik L. et al, Applied Physics Letters, 2016, 109, 164102.
[4] Egerton R. F. Ultramicroscopy, 2013, 127, 100-108. [5] Egerton R. F. et al, Micron, 2004, 35, 399-409.
[6] Hari B. et al, Materials Letters. 2006, 60(12), pp.1515-1518.
[7] Mitchell D.R.G. Microscopy research and technique, 200871 588-93. [8] Mansot J. et al, Colloids and Surfaces A. 1993, 71 (123-134).
A
B