R E S E A R C H A R T I C L E
Open Access
Development of the catfish 250K SNP array for
genome-wide association studies
Shikai Liu, Luyang Sun, Yun Li, Fanyue Sun, Yanliang Jiang, Yu Zhang, Jiaren Zhang, Jianbin Feng,
Ludmilla Kaltenboeck, Huseyin Kucuktas and Zhanjiang Liu
*Abstract
Background:Quantitative traits, such as disease resistance, are most often controlled by a set of genes involving a complex array of regulation. The dissection of genetic basis of quantitative traits requires large numbers of genetic markers with good genome coverage. The application of next-generation sequencing technologies has allowed discovery of over eight million SNPs in catfish, but the challenge remains as to how to efficiently and economically use such SNP resources for genetic analysis.
Results:In this work, we developed a catfish 250K SNP array using Affymetrix Axiom genotyping technology. The SNPs were obtained from multiple sources including gene-associated SNPs, anonymous genomic SNPs, and inter-specific SNPs. A set of 640K high-quality SNPs obtained following specific requirements of array design were submitted. A panel of 250,113 SNPs was finalized for inclusion on the array. The performance evaluated by
genotyping individuals from wild populations and backcross families suggested the good utility of the catfish 250K SNP array.
Conclusions:This is the first high-density SNP array for catfish. The array should be a valuable resource for genome-wide association studies (GWAS), fine QTL mapping, high-density linkage map construction, haplotype analysis, and whole genome-based selection.
Keywords:Catfish, Fish, Genome, SNP array, GWAS, Genotyping
Background
Catfish is the most important aquaculture species in the United States. In recent years, catfish industry encounters great challenges including devastating diseases which cause the largest economic loss. Improved brood stocks with a high level of disease resistance are desperately needed. Quantitative traits, such as disease resistance, are most often controlled by a set of genes involving a complex array of regulation [1-3]. The dissection of genetic basis of these traits requires large numbers of genetic markers.
Single nucleotide polymorphisms (SNPs) are now the markers of choice because they are the most abundant genetic variations widely distributed in the genome, and are generally bi-allelic polymorphisms that are amenable
to automated genotyping [4]. SNPs are efficient for genome-wide association studies (GWAS) because linkage disequilibrium can be detected with high-density SNPs when dealing with complex traits. Simultaneous analysis of thousands of SNPs have enabled genome-wide associ-ation studies for performance and production traits in chicken [5,6], pig [7,8], cattle [9-11], horse [12] and sheep [13,14]. However, such studies have not been possible with most aquaculture species including catfish due to the lack of genome-wide SNP markers and high-throughput SNP genotyping platforms.
Until recently genome-scale SNP identification was a great challenge for most non-model species. The next-generation sequencing technologies enabled efficient identification of SNPs from genomes of various organ-isms [15]. With the availability of a large number of SNPs, the challenge then is how to genotype these SNPs efficiently and economically.
A variety of SNP array platforms are available, of which Illumina iSelect HD Custom BeadChip (Illumina,
* Correspondence:[email protected]
The Fish Molecular Genetics and Biotechnology Laboratory, Aquatic Genomics Unit, School of Fisheries, Aquaculture and Aquatic Sciences, and Program of Cell and Molecular Biosciences, Auburn University, Auburn, AL 36849, USA
San Diego, CA), the Sequenom MassArray (Sequenom, San Diego, CA) and Affymetrix GeneChip Custom Array (Affymetrix, Santa Clara, CA) are widely used. More recently, Affymetrix adopted the Axiom genotyp-ing technology that allows development of customized arrays containing 1,500 to 2.6 million SNPs [16]. These platforms differ in their requirements for SNP marker numbers, sample size, cost and automation.
SNP arrays have been developed in several livestock species, including cattle [17], horse [18], pig [19], sheep [20], dog [21] and chicken [22]. For instance, the Illumina BovineSNP50 Beadchip featuring approximately 54,000 informative SNP probes was first developed for detecting variations in cattle breeds [17]. Two cattle SNP arrays with higher density were recently developed [23]. In dog, Illumina developed the CanineSNP20 BeadChip with 20K SNPs, and the recent CanineHD BeadChip containing over 170,000 SNPs [24]. A 60K chicken SNP array powered by Illumina iSelect BeadChip was de-signed to contain 57,636 SNPs [22]. Recently, a high density 600K chicken SNP array was developed with Affymetrix Axiom genotyping technology [25]. Appar-ently, there are no technology barriers for the develop-ment of high density SNP arrays, but the economic challenge is still tremendous. Even though the unit cost per genotype is currently extremely low, the total costs for the high density SNP arrays with high numbers of SNPs can still be beyond the economic powers of re-searchers working with species within small research communities.
High-density SNP arrays have not been developed for aquaculture species. Only low to medium density arrays were used in several aquaculture species. The Illumina GoldenGate Assay was used to evaluate 384 rainbow trout SNPs, resulting in a validation rate of 48% for the tested SNPs [26]. The GoldenGate Assay was also used to genotype 384 catfish EST-derived SNPs to assess the factors affecting SNP validation rates [27]. A custom Illumina iSelect SNP array containing approximately 6K SNP markers from Atlantic salmon was developed and used for linkage mapping and QTL analysis [28,29].
SNP resources required for the development of a high-density SNP array have been developed in catfish. Over two million gene-associated SNPs were identified in channel catfish and blue catfish, respectively, using next-generation sequencing. Of these putative gene-associated SNPs, approximately 400,000-500,000 were of high qual-ity [30]. In a recent study, over eight million SNPs were identified in channel catfish by whole genome sequen-cing of one wild and four aquaculture populations [31]. With the availability of these SNP resources, we report here the development and performance evaluation of the 250K catfish SNP array using the Affymetrix Axiom genotyping technology.
Results and discussion
Selection of SNPs for the SNP array
One of the most important goals of the SNP array devel-opment is to have a good coverage of the genome. The first task was to select a subset of SNPs from all identi-fied SNPs, gene-associated as well as anonymous SNPs. From a large pool of the previously identified SNPs [30,31], the following selection criteria were used for the initial selection of SNPs: 1) For gene-associated SNPs, at least one but no more than two SNPs per transcript contig were selected; 2) For anonymous SNPs, one SNP was se-lected for small contigs of less than 4 kb, but two SNPs were selected for contigs larger than 4 kb, with their spa-cing being the largest within the contig. In addition, a set of sequence features were also considered for the selection of the initial SNPs (see Methods).
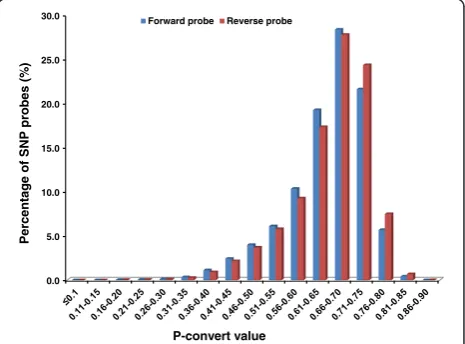
The initial in house selection resulted in 641,489 SNPs that were submitted to Affymetrix for in-silico analysis to assess the predicted performance on Axiom arrays. Both forward and reverse probes of each SNP were assigned with p-convert values, which were derived from a random forest model to predict the probability of the SNP conversion on the array. The model considers fac-tors including probe sequence, binding energy and the expected degree of non-specific hybridization to multiple genomic regions (personal communication with Affyme-trix). SNP probes with high p-convert values are expected to convert on the SNP array with high probability.
[image:2.595.306.539.533.705.2]A total of 495,671 SNPs passed the Affymetrixin-silico evaluation with various p-convert values, but the vast majority of SNPs had p-convert values greater than 0.5 (Figure 1). Because many more than needed SNPs passed the p-convert evaluation, only SNPs with p-convert values greater than 0.5 were further considered for inclusion on the array. For the SNPs with both probes passing the p-convert threshold, the probes with the higher p-covert
0.0 5.0 10.0 15.0 20.0 25.0
30.0 Forward probe Reverse probe
P-convert value
Percentage of
SNP
probes (%
)
values were selected. For the SNPs with both probes hav-ing relatively low p-convert values, both probes were se-lected to increase the conversion rate for the SNP. In the final SNP list, A/T and C/G SNPs were removed because such SNPs require twice the number of probes for genotyping.
SNPs included on the 250K array
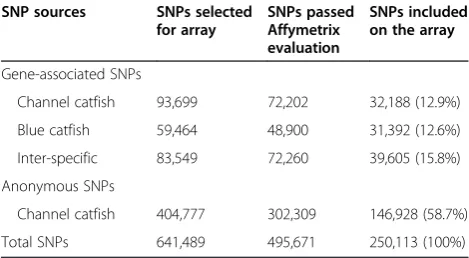
The SNPs used for the development of the catfish 250K SNP array are summarized in Table 1. A total of 250,113 SNPs were included in the 250K array including 103,185 (41.3%) gene-associated SNPs and 146,928 (58.7%) an-onymous SNPs. Of the gene-associated SNPs, 32,188 were from SNPs identified from channel catfish, 31,392 were from SNPs identified from blue catfish, and 39,605 were inter-specific SNPs identified between channel cat-fish and blue catcat-fish (Table 1, also referred to as inter-specific SNPs).
A total of 316,706 SNP probes were synthesized for the interrogation of these 250,113 SNPs, 66,593 SNPs of which were tiled with two probes (Table 2). In addition to SNP probes, 2,000 data quality control (QC) probes were included on the SNP array serving as negative con-trols. The QC probes were non-polymorphic 31-mers randomly picked from non-repetitive regions of catfish genome. We selected 1,000 QC probes with A or T at the 31st base, and another 1,000 QC probes with G or C at the 31st base.
Inclusion of gene-associated SNPs should enhance the conversion rates because genes and their associated sequences are more unique in the genome than the non-coding genomic sequences. In addition, as genes are broadly distributed across all 29 pairs of chromo-somes of the catfish genome [30], SNPs derived from genes should reflect the distribution of genes within the genome. However, as genes are not entirely evenly dis-tributed, inter-marker spacing is not equal. Genomic SNPs from anonymous regions would fill the gaps. A subset of inter-specific SNPs are included, which are useful for genetic analysis of the inter-specific hybrid
catfish system. The hybrid catfish produced by crossing channel catfish female with blue catfish male are widely used in the catfish industry because the hybrids possess several superior performance and production traits to both of their parents.
Distribution of SNP spacing
[image:3.595.305.538.100.184.2]We were unable to determine the absolute SNP coordi-nates and thereby their genome distribution because a fully assembled catfish genome is still not available. After the completion of SNP array development, a draft catfish genome assembly was generated (unpublished). To assess the SNP distribution, the inter-SNP spacing was evaluated using this draft genome assembly. A total of 248,308 SNPs (99.3%) with flanking sequences were uniquely mapped to 11,017 genome scaffolds which span a total of 785.6 Mb, approximately 80% of the genome. As shown in Figure 2, a total of 237,291 SNPs with inter-SNP spacing were ex-amined. A total of 49,718 SNPs had a small inter-SNP spacing of less than 500 bp, and 31,811 SNPs had an inter-SNP spacing of 500–1000 bp. The largest number of SNPs (46,804) had an inter-SNP spacing of 1000– 2000 bp. A total of 31,184 had a marker spacing of 2000–3000 bp, 21,100 had a marker spacing of 3000– 4000 bp, 14,538 had a marker spacing of 4000–5000 bp,
Table 1 Summary of SNPs used for the catfish 250K SNP array design
SNP sources SNPs selected for array
SNPs passed Affymetrix evaluation
SNPs included on the array
Gene-associated SNPs
Channel catfish 93,699 72,202 32,188 (12.9%)
Blue catfish 59,464 48,900 31,392 (12.6%)
Inter-specific 83,549 72,260 39,605 (15.8%)
Anonymous SNPs
Channel catfish 404,777 302,309 146,928 (58.7%)
[image:3.595.306.539.508.705.2]Total SNPs 641,489 495,671 250,113 (100%)
Table 2 Summary of the catfish 250K SNP array
SNP array Number
Total number of SNPs 250,113
Number of SNPs tiled with single probe 183,520
Number of SNPs tiled with two probes 66,593
Total number of probes 316,706
Number of data quality control probes 2,000
0.0% 20.0% 40.0% 60.0% 80.0% 100.0%
0 10 20 30 40 50
Number of
SNPs
(x
thousand)
Number of SNPs Cumulative percentage
SNP spacing (bp)
Figure 2Distribution of inter-SNP spacing of SNPs on the array.
[image:3.595.56.291.604.733.2]10,316 had a marker spacing of 5000–6000 bp, and 31,820 had a marker spacing of more than 6000 bp. Cu-mulatively, 34.4% SNPs had a marker spacing of less than 1 kb; 52.2% SNPs had marker spacing of 1–6 kb; and 13.4% had a marker spacing of greater than 6 kb (Figure 2).
Due to the lack of a fully assembled genome sequence, the inter-marker spacing is probably underestimated. The current draft genome assembly had a total genome size of 830.5 Mb, but the catfish genome is approximately 950 Mb. In addition, the spacing from the most external SNPs of each scaffold to the next marker is not included in the assessment. Therefore, the overall marker spacing could have been slightly larger.
The SNP distribution was also evaluated with regard to association with bacterial artificial chromosome (BAC) end sequences (BES). A total of 22,051 SNPs on the array are associated with 16,832 BES derived from 14,849 BAC clones. Accordingly, such SNPs are associated with 2,853 (86.3% of 3,307) contigs from the catfish physical map de-veloped by Xu et al. [32], including 1,141 contigs that were not able to integrate with linkage map constructed mainly using microsatellite markers [33]. Such BAC associated SNPs are useful because they are separated by a known distance in the genome (BAC insert size of 161 Kb on average [32]), and their use can facilitate full integration of genetic linkage and physical maps.
The catfish have a genome size of ~ 1 billion base pairs. With the 250,000 SNPs, theoretically, the average SNP marker intervals are about 4 kb in the catfish gen-ome. We should acknowledge that it is too costly to develop a SNP array with millions of markers for cat-fish, like it has been done in human and other model species, since far less funding support is available for aquaculture species. For the same budget related reason, the number of samples genotyped for GWAS is limited for aquaculture species as well. Therefore, different strat-egies should be utilized when conducting genome-wide genetic analysis using the catfish 250K SNP array. The genome regions underlying production and performance traits can be first located through the whole genome scan-ning with the 250K SNPs genotyped from hundreds of samples. To further investigate the SNP effects, it’s cost-saving to use other SNP genotyping platforms such as Sequenom MassArray (Sequenom, San Diego, CA) to
genotype thousands of individuals with denser SNPs from the targeted regions.
Performance of the catfish 250K SNP array
Genotyping performance of the SNP array
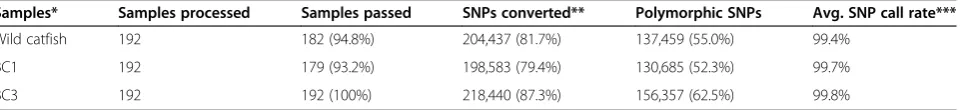
Performance of the SNP array was examined by geno-typing unrelated catfish samples from wild populations and catfish backcross families. As summarized in Table 3, a total of 204,437 SNPs (81.7%) were converted in wild catfish samples, of which 137,459 (55.0%) were poly-morphic. The SNP conversion rate and polymorphic rate in BC1 catfish were relatively lower than those in unre-lated wild catfish, as expected. However, higher conver-sion rate and polymorphic rates were observed in BC3 catfish than in BC1 catfish as well as in unrelated wild catfish (Table 3). The reason is that the BC3 catfish pos-sess a higher fraction of “channel catfish” genome than BC1 catfish, as backcross families were produced by back-crossing hybrid catfish with channel catfish. Therefore, higher proportions of intra-specific SNPs from channel catfish were expected to convert in BC3 catfish than in BC1 catfish. Furthermore, the BC3 catfish possess hybrid genome regions, therefore, the inter-specific SNPs that only exist in the hybrids were expected to convert in BC3 rather than in wild catfish.
Although polymorphism ultimately dictates how useful the array, the results present herein is related to the test-ing samples used in this study. In the case of the catfish 250K SNP array, the situation is further complicated by inclusion of intra-specific as well as inter-specific SNPs. Inter-specific SNPs are not expected to be polymorphic within channel catfish or blue catfish, but are poly-morphic in inter-specific hybrids. One obvious question we are interested to ask is how many of the 250K SNPs represented real SNPs (the validation rate). Here, a total of 137,459 SNPs were polymorphic in wild fish; 130,685 SNPs were polymorphic in BC1 fish, and 156,357 SNPs were polymorphic in BC3 fish. Taken together, of the 241,812 converted SNPs, a total of 200,860 SNPs (83.1%) were polymorphic in at least one testing population, demonstrating a high SNP validation rate.
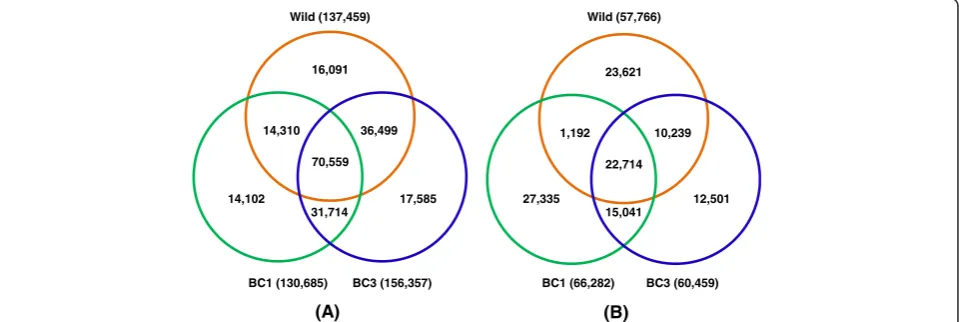
[image:4.595.60.544.661.716.2]Comparisons of polymorphic and monomorphic SNPs among wild catfish, BC1 and BC3 catfish indicated that a large number of SNPs (70,559) were polymorphic in all three examined groups of fish (Figure 3A), while a
Table 3 Performance assessment of the catfish 250K SNP array
Samples* Samples processed Samples passed SNPs converted** Polymorphic SNPs Avg. SNP call rate***
Wild catfish 192 182 (94.8%) 204,437 (81.7%) 137,459 (55.0%) 99.4%
BC1 192 179 (93.2%) 198,583 (79.4%) 130,685 (52.3%) 99.7%
BC3 192 192 (100%) 218,440 (87.3%) 156,357 (62.5%) 99.8%
relatively small number (22,714) of SNPs were not poly-morphic in any of the three fish groups tested (Figure 3B). These 22,714 SNPs were most likely pseudo-SNPs, al-though they could still be real SNPs when more fish are tested.
The catfish hybrid system is not only important to the industry but also interesting for the genetic studies be-cause the inter-specific hybrids exhibit significant heter-osis. The high conversion and polymorphic rates achieved by genotyping catfish from backcross hybrid families as well as wild populations suggested good performance and utility of this SNP array.
Assessment of informativeness of SNPs on the array Marker informativeness is reflected in minor allele fre-quencies (MAFs) as SNPs are most often bi-allelic markers. In order to assess the informativeness of the SNPs on the array, the minor allele frequencies of the SNPs were determined in wild population. The geno-types of 137,459 polymorphic SNPs in wild catfish sam-ples were used for the analysis. Distribution of minor allele frequencies with intervals of 0.05 was shown in Figure 4. Overall, most polymorphic SNPs had a MAF of greater than 0.05, with 22,349 between 0.06-0.10, 19,084 between 0.11-0.15, 16,927 between 0.16-0.20, 15,961 between 0.21-0.25, 12,667 between 0.26-0.30, 10,207 be-tween 0.31-0.35, 9,133 bebe-tween 0.36-0.40, 8,710 bebe-tween 0.41-0.45, and 8,006 between 0.46-0.50. Such distri-bution of the minor allele frequencies indicates that the array is likely very informative in most cases. Obviously, the higher MAF a SNP has, the more in-formative it will be. However, SNPs with low MAFs (rarer variants), possibly with larger effects, therefore, are essential in genome-wide association analysis as well [34].
Relationships between design score and SNP performance As the p-convert value is an important factor for the se-lection of SNPs, it is interesting to analyze its relation-ships with SNP performance. As shown in Figure 5, the p-convert values were positively correlated with the per-formance of the SNP probes, the higher the p-convert values were, the better performance of the probes was. However, once the p-convert values reached 0.7 or higher, further increase in p-convert values did not have additional effect on probe performance (Figure 5). This relationship holds not only for percent of probes that worked, but also for percent of converted SNPs. The spike in percent of converted SNPs with probes having lower p-convert values is an artifact due to the inclusion of two probes per SNP for SNPs with relatively lower p-convert values (Figure 5). Apparently, the p-convert value serves well as a parameter for the prediction of SNP probe performance.
16,091
70,559 36,499
17,585 14,102
31,714 14,310
BC1 (130,685) BC3 (156,357) Wild (137,459)
23,621
22,714 10,239
12,501 27,335
15,041 1,192
BC1 (66,282) BC3 (60,459) Wild (57,766)
[image:5.595.59.539.91.252.2](A) (B)
Figure 3Comparisons of polymorphic SNPs and monomorphic SNPs among three groups of fish. (A)Polymorphic SNPs,(B)Monomorphic SNPs. Wild, unrelated wild channel catfish, BC1, 1st generation of backcross progeny, and BC3, 3rd generation of backcross progeny.
0 5 10 15 20 25
Number of
SNPs
(x
thousand)
[image:5.595.306.539.537.715.2]Minor allele frequency
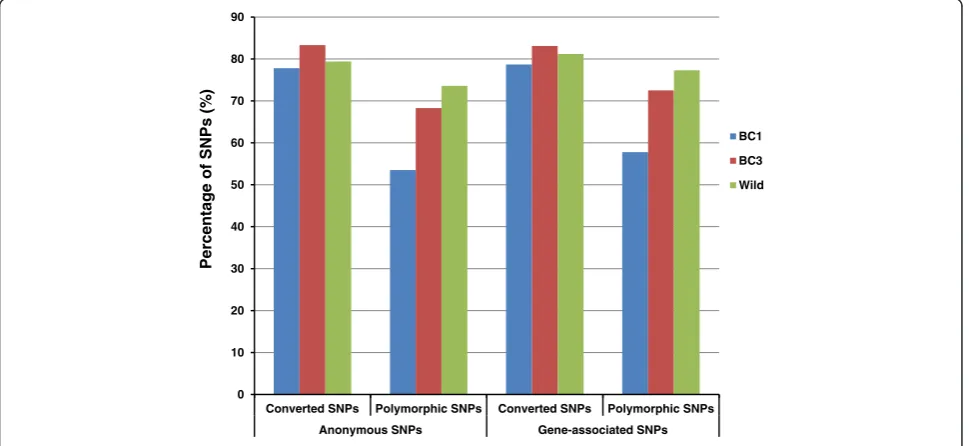
Performance of gene-associated SNPs versus anonymous SNPs
On the catfish 250K SNP array, 179,116 SNPs were identified from channel catfish, of which 146,928 were anonymous SNPs while 32,188 were gene-associated SNPs. To compare the performance of gene-associated SNPs
and anonymous SNPs, the conversion rates and percent-ages of polymorphic SNPs were analyzed. As shown in Figure 6, there is no significant difference in performance between gene-associated SNPs and anonymous SNPs, with the conversion rates and polymorphic SNP percentages of gene-associated SNPs being slightly higher, by a couple of
50.0% 55.0% 60.0% 65.0% 70.0% 75.0% 80.0% 85.0% 90.0% 95.0% 100.0%
0 20 40 60 80 100 120
Number
of
SNP
probes (x
thousand)
Probes on array
SNPs tiled with two probes Percent of worked probe Percent of converted SNPs
[image:6.595.58.538.86.376.2]P-convert value
Figure 5Relationships between Affymetrix design scores and SNP probe performance.
0 10 20 30 40 50 60 70 80 90
Converted SNPs Polymorphic SNPs Converted SNPs Polymorphic SNPs Anonymous SNPs Gene-associated SNPs
BC1 BC3 Wild
Percentage of
SNPs
(%
[image:6.595.57.542.496.719.2])
percentage, than those of anonymous SNPs in all three examined populations.
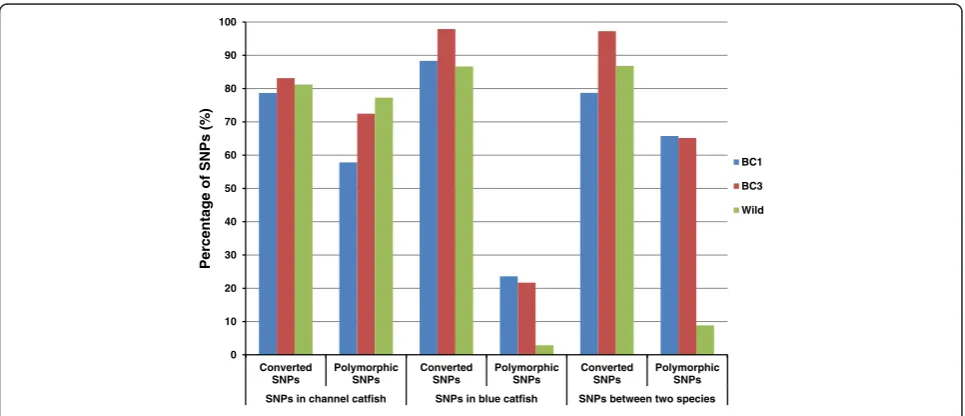
Performance of intra-specific and inter-specific SNPs The performances of 32,188 intra-specific SNPs in chan-nel catfish, 31,392 intra-specific SNPs in blue catfish and 39,605 inter-specific SNPs between the two species were examined as shown in Figure 7. As expected, the highest percentage of polymorphic SNPs was converted from SNPs in channel catfish when being genotyped in channel catfish samples from the wild population. In contrast, the intra-specific SNPs identified from blue catfish had a very low polymorphic rate in wild channel catfish population. Similarly, only 8% inter-specific SNPs were polymorphic among wild channel catfish. However, such inter-specific SNPs performed really well in inter-specific backcross families, as expected (Figure 7).
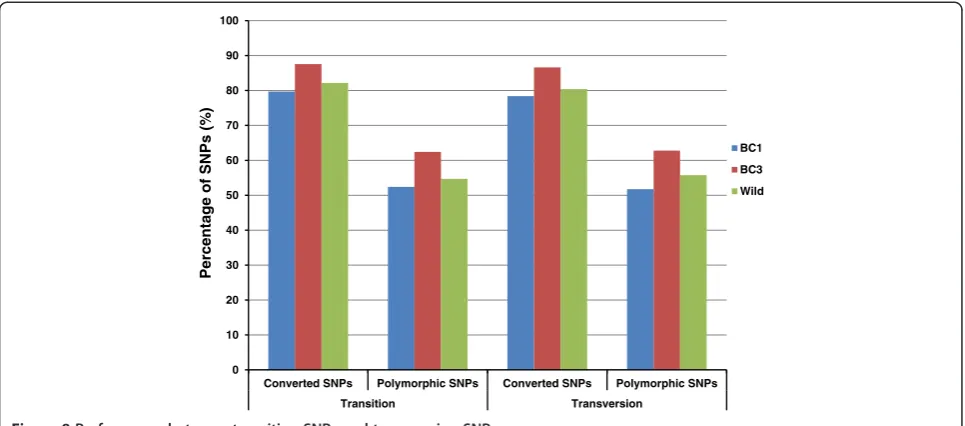
Performance of transition and transversion SNPs
Of the 250,113 SNPs on the array, 75.9% are transitions and 24.1% are transversions. Transition SNPs are more abundant than transversion SNPs, with an estimated ratio of 1.8-1.9 in catfish among gene-associated SNPs [30,35]. The exclusion of A/T and G/C SNPs in the design stage of the SNP array reduced the fraction of transversion SNPs. It is interesting to examine the performance of these two types of SNPs. As shown in Figure 8, the two types of SNPs have nearly identical conversion rates and poly-morphic rates, suggesting that they should not be different in their performance for genotyping.
SNP transferability to other related catfish species
To assess the utility of the catfish 250K SNP array in the related catfish taxa, a set of DNA samples were tested
from blue catfish (Ictalurus furcatus), brown bullhead cat-fish (Ameiurus nebulosus) and white catfish (A. catus). As summarized in Table 4, the overall SNP conversion rates across these species were actually quite high, with a min-imal rate of 50.4% in brown bullhead and as high as 77.2% in D&B strain of blue catfish. However, the polymorphic rates were much lower, more than 10 times lower than the conversion rates in most cases. For instance, the poly-morphic rates were 7.8% and 3.9% in Rio Grande and D&B strain of blue catfish, respectively, for all 250,113 SNPs on the array, as compared to 43.5% and 18.7% poly-morphic rates for SNPs identified from blue catfish (31,392) when tested in the same samples. The SNPs on the array had low polymorphic rates for brown bullhead and white catfish as well, ranging from 4.4-5.1%. Taken to-gether, these results suggested that the probes designed from channel catfish and blue catfish sequences could ac-tually hybridize to the genomic DNA of brown bullhead and white catfish, but the bases at the SNP sites were not polymorphic in the two catfish species.
In spite of the low polymorphic rates, the number of SNPs that were polymorphic was still notable with various species of catfishes. Over 12,000 SNPs were polymorphic for bullhead catfish and white catfish, suggesting its ap-plicability for genetic analysis in related catfish taxa. The polymorphic rates evaluated here are probably underesti-mated because only 10 individuals were genotyped. Poly-morphic rates would increase if more fish had been genotyped. Although these estimates are quite prelimin-ary, the very low polymorphic rates observed in D&B strain of blue catfish suggest that this strain may have ex-perienced inbreeding and might have had a small number of founders, at least twice less diverse than the Rio Grande strain (Table 4).
0 10 20 30 40 50 60 70 80 90 100
Converted SNPs
Polymorphic SNPs
Converted SNPs
Polymorphic SNPs
Converted SNPs
Polymorphic SNPs SNPs in channel catfish SNPs in blue catfish SNPs between two species
BC1 BC3 Wild
Percentage of
SNPs
(%
[image:7.595.57.540.512.720.2])
Conclusions
In this study, we report the development of the catfish 250K SNP array using Affymetrix Axiom genotyping technology. The SNPs were well-spaced in the genome. Distribution of minor allele frequency indicated that SNPs with uniform MAFs were included on the array. The performance evaluation of the SNP array by genotyp-ing samples from pedigree families and unrelated wild populations suggested high SNP conversion rates (~80%) and high polymorphic rates (over 50%) can be obtained in all the examined samples. Technically, we showed that the Affymetrix design score (p-convert value) ad-equately predicted SNP probe performance and the in-clusion of alternative probes greatly increased the SNP conversion rates, especially for SNPs with probes that had low design scores. The catfish 250K SNP array should be valuable for genome-wide association studies, fine QTL mapping, high-density linkage mapping, haplo-type analysis, and whole genome-based selection.
Methods Ethics statement
All procedures involving the handling and treatment of fish used during this study were approved by the Auburn
University Institutional Animal Care and Use Committee (AU-IACUC) prior to initiation.
SNP selection and array design
Gene-associated SNPs were generated from Liu et al. [30]. Anonymous SNPs from non-coding genomic re-gions were from Sun et al. [31]. SNPs were filtered following the specific requirements for the Affymetrix SNP array design. Flanking sequences of 35 bp for each SNP were extracted where no other variations (SNPs and/or Indels) were allowed within 30 bp of SNPs. The balanced A/T/G/C of flanking sequences was required with GC content of 30%-70%. No repetitive elements were allowed in flanking sequences. In addition, single base repeats of G or C greater than 4 and A or T greater than 6 were not allowed.
All SNPs passing the in house selection using the above criteria were submitted to Affymetrix for design score assessment, where a p-convert value was assigned to each of the two probes flanking a SNP, respectively. SNPs with probes of high p-convert values were more likely to be convertible. A p-convert value threshold was determined by excluding the tail of lowest performing probes to facilitate selection of final SNP list. For the SNPs with both probes passing the p-convert value
0 10 20 30 40 50 60 70 80 90 100
Converted SNPs Polymorphic SNPs Converted SNPs Polymorphic SNPs Transition Transversion
BC1 BC3 Wild
Percentage
of
SNPs (%
[image:8.595.57.540.89.302.2])
Figure 8Performance between transition SNPs and transversion SNPs.
Table 4 Transferability of SNPs to other catfish species
Species Latin name Converted SNPs* Polymorphic SNPs* Converted SNPs** Polymorphic SNPs**
Blue catfish (Rio Grande) Ictalurus furcatus 190,867 (76.3%) 19,549 (7.8%) 25,722 (81.9%) 13,667 (43.5%)
Blue catfish (D&B) I. furcatus 193,039 (77.2%) 9,684 (3.9%) 25,109 (80.0%) 5,859 (18.7%)
Brown bullhead catfish Ameiurus nebulosus 126,076 (50.4%) 12,649 (5.1%) 17,739 (56.5%) 1,376 (4.4%)
White catfish A. catus 129,716 (51.9%) 12,833 (5.1%) 18,286 (58.3%) 1,452 (4.6%)
[image:8.595.56.540.657.725.2]threshold, only the probe with the greater value was selected. For the SNPs with both probes having low p-convert values, both probes were selected to ensure a high probability of conversion.
To select well-spaced SNPs, at least one but no more than two SNPs per transcript contig were selected for gene-associated SNPs. At the time of the SNP selection, only the initial preliminary catfish genome assembly was available (255,858 contigs with mean length of 2,996 bp and N50 of 6,027 bp, unpublished data). The preliminary assembly was used to facilitate SNP selection according to contig length for the anonymous SNPs. One SNP per contig was selected from the contigs with lengths less than 4 kb. Two SNPs per contig were selected from the contigs with lengths greater than 4 kb. For the two SNPs selected from one contig, the SNPs with the largest distances were selected to ensure good spacing in the genome.
In addition, A/T and C/G SNPs were not selected be-cause the two alleles of these SNPs match the same dye, and additional distinct probes in different physical locations on the array are required to distinguish them. Non-polymorphic 31-mers were randomly picked from non-repetitive regions of the genome for data quality control (QC) probes. The QC probes along with the final list of SNPs were submitted to Affymetrix for production of Axiom genotyping arrays.
Assessment of SNP spacing
To assess the genome distribution of SNPs on the array, all the 250,113 SNPs with 35-bp up and downstream flanking sequences (71 bp in total) were aligned with the latest draft genome assembly now available (62,461 scaf-folds with N50 of 3 Mb, covering a total size of 850 Mb, unpublished) using BLAST to determine SNP positions. The inter-SNP spacing was determined based on SNP
AX-85189640 AX-85189008
AX-85191719
AX-85188778
(i) (ii) (iii)
(iv) (v) (vi)
[image:9.595.57.540.320.695.2]AX-85191411 AX-85188921
Figure 9Examples of six SNP/probeset categories.SNPs/probesets were classified into six categories according to cluster properties:
positions in the scaffolds. The distance between SNPs at the end of sequences and the next SNP was not included because it’s not possible to assess their inter-marker interval. Similarly, SNP flanking sequences were aligned with the catfish BAC end sequences (BES) [36,37] to identify BES associated SNPs.
SNP array performance evaluation
Fish sources
Three different sample sources were used for genotyping to assess the SNP array performance: 1) 192 unrelated channel catfish from wild populations; 2) 192 catfish hy-brids from the 1st generation of backcrossing and 3) 192 catfish hybrids from the 3rd generation of backcrossing. Samples from wild populations were channel catfish col-lected for a previous study [38]. The hybrids from the 1st generation of backcrossing were produced by backcrossing the inter-specific F1hybrids (channel female x blue male) with a male channel catfish, and the 3rd generation of backcross hybrids were produced by backcrossing the 2nd generation of backcross hybrids with a male channel catfish.
DNA isolation
Blood samples (300-500μl) were collected in a 1-ml syr-inge and immediately expelled into a 15-ml tube con-taining 5 ml of cell lysis buffer (100 mM NaCl, 10 mM Tris, pH 8, 25 mM EDTA, 0.5% SDS, and 0.1 mg/ml freshly made proteinase K) for DNA isolation. DNA was isolated as previously described [39,40]. Picogreen dye (Quant-iT Pico Green, Invitrogen) was used in order to quantify double-stranded DNA according to the manu-facturer’s protocol. The integrity of DNA samples was checked by 1% agarose gel electrophoresis stained with ethidium bromide.
SNP genotyping
Genomic DNA samples were arranged in a 96-well mi-crotiter plate, and normalized to a final concentration of 50 ng/μl with a final volume of 10 μl. Genotyping with the catfish 250K SNP array was outsourced to GeneSeek (Lincoln, NE, USA).
SNP analysis
Raw data in the form of CEL files were imported into the Affymetrix Genotyping Console software (v4.1) for quality control analysis and genotype calling using Axiom GT1 algorithm (Affymetrix). Samples with dish quality control (QC) value of 0.82 or better and call rate >0.97 were considered to have passed the quality control as-sessment. Following genotyping, SNPolisher (Affyme-trix), an R package, was used to process the genotyping results. The package calculates the QC metrics for each SNP/probe set to determine its quality, and classify
SNPs into six categories (Figure 9): (i) “ PolyHighResolu-tion”where three clusters are formed with good resolution; (ii) “NoMinorHom” where two clusters are formed with no samples of the minor homozygous genotypes; (iii) “MonoHighResolution” in which only one cluster is formed; (iv) “OTV”, off-target variants, where three good clusters are formed, but with one extra off-target cluster that is caused by sequence dissimilarity between probes and target genome regions [41]; (v)“ CallRateBelowThres-hold” where SNP call rate is below threshold, but other cluster properties are above threshold; and (vi) “Other” where one or more cluster properties are below threshold. The category (ii) was obtained when genotyping with related individuals such as in backcross families BC1 and BC3. In this study, SNPs of categories (i) to (iv) were regarded as convertible SNPs, and SNPs of cat-egories (i) to (ii) were considered as polymorphic SNPs. The data used in this study are deposited in the Na-tional Animal Genome Research Program Aquaculture Genomics Data Repository (http://www.animalgenome. org/repository) and are also available upon request.
SNP transferability to other related catfish species
A set of DNA samples were tested from other related catfish species, including blue catfish (Ictalurus furcatus) of Rio Grande strain (10) and D&B strain (10), 10 brown bullhead catfish (Ameiurus nebulosus) and 10 white catfish (A. catus). The DNA preparation, SNP genotyping and analysis were the same as mentioned above.
Competing interests
The authors declare that they have no competing interests.
Authors’contributions
SL conducted the major part of the research including SNP selection, array design, data analysis, and manuscript preparation. LS, YL, FS, YJ, YZ, JZ and JF were involved in data analysis. MK and HK are involved in DNA sample preparation. ZL supervised the entire study and provided assistance for data analysis and manuscript preparation. All authors read and approved the final manuscript.
Acknowledgements
This project was supported by Agriculture and Food Research Initiative Competitive Grant no. 2009-35205-05101 and 2010-65205-20356 from the USDA National Institute of Food and Agriculture (NIFA). The authors are grateful for the support provided by colleagues from Affymetrix Bioinformatics Services and the custom genotyping program, especially Lucy Reynolds and Ali Pirani. Thanks go to the scientists and leaders of the Center for Applied Aquatic Genomics, Chinese Academy of Fishery science including Dr. Xiaowen Sun, Dr. Peng Xu, Director Yingjie Liu, Vice President Jieren Li, Vice President Qing Liu, and President Xianliang Zhang for their collaboration with the SNP project. It is only because of their collaboration that made the cost of the catfish array affordable with our limited resources. We thank Dr. Geoff Waldbieser for his collaboration in generating the preliminary catfish whole genome assembly. We thank all the lab colleagues who provided assistance with sample collection. The first author was supported by a scholarship from the China Scholarship Council.
References
1. Gui JF, Zhu ZY:Molecular basis and genetic improvement of economically important traits in aquaculture animals.Chin Sci Bull2012, 57(15):1751–1760.
2. Zheng XH, Kuang YY, Lv WH, Cao DC, Zhang XF, Li C, Lu CY, Sun XW:A consensus linkage map of common carp (Cyprinus carpioL.) to compare the distribution and variation of QTLs associated with growth traits. Sci China Life Sci2013,56(4):351–359.
3. Odegard J, Baranski M, Gjerde B, Gjedrem T:Methodology for genetic evaluation of disease resistance in aquaculture species: challenges and future prospects.Aquac Res2011,42:103–114.
4. Kruglyak L:The use of a genetic map of biallelic markers in linkage studies.Nat Genet1997,17(1):21–24.
5. Abasht B, Lamont SJ:Genome-wide association analysis reveals cryptic alleles as an important factor in heterosis for fatness in chicken F-2 population.Anim Genet2007,38(5):491–498.
6. Wolc A, Arango J, Settar P, Fulton JE, O’Sullivan NP, Preisinger R, Habier D, Fernando R, Garrick DJ, Hill WG, Dekkers JM:Genome-wide association analysis and genetic architecture of egg weight and egg uniformity in layer chickens.Anim Genet2012,43:87–96.
7. Becker D, Wimmers K, Luther H, Hofer A, Leeb T:A genome-wide association study to detect QTL for commercially important traits in swiss large white boars.Plos One2013,8(2):e55951.
8. Sahana G, Kadlecova V, Hornshoj H, Nielsen B, Christensen OF:A genome-wide association scan in pig identifies novel regions associated with feed efficiency trait.J Anim Sci2013,91(3):1041–1050.
9. Meuwissen THE, Hayes BJ, Goddard ME:Prediction of total genetic value using genome-wide dense marker maps.Genetics2001,157(4):1819–1829. 10. Khatkar MS, Nicholas FW, Collins AR, Zenger KR, Cavanagh JA, Barris W,
Schnabel RD, Taylor JF, Raadsma HW:Extent of genome-wide linkage disequilibrium in Australian Holstein-Friesian cattle based on a high-density SNP panel.BMC Genomics2008,9:187.
11. Kim ES, Berger PJ, Kirkpatrick BW:Genome-wide scan for bovine twinning rate QTL using linkage disequilibrium.Anim Genet2009,40(3):300–307. 12. Brooks SA, Gabreski N, Miller D, Brisbin A, Brown HE, Streeter C, Mezey J,
Cook D, Antczak DF:Whole-genome SNP association in the horse: identification of a deletion in myosin Va responsible for lavender foal syndrome.Plos Genet2010,6(4):e1000909.
13. Kijas JW, Townley D, Dalrymple BP, Heaton MP, Maddox JF, McGrath A, Wilson P, Ingersoll RG, McCulloch R, McWilliam S, Tang D, McEwan J, Cockett N, Oddy VH, Nicholas FW, Raadsma H, the International Sheep Genomics Consortium:A genome wide survey of SNP variation reveals the genetic structure of sheep breeds.Plos One2009,4(3):e4668. 14. Becker D, Tetens J, Brunner A, Burstel D, Ganter M, Kijas J, Drogemuller C,
Consortium ISG:Microphthalmia in texel sheep is associated with a missense mutation in the paired-like homeodomain 3 (PITX3) gene. Plos One2010,5(1):e8689.
15. Davey JW, Hohenlohe PA, Etter PD, Boone JQ, Catchen JM, Blaxter ML: Genome-wide genetic marker discovery and genotyping using next-generation sequencing.Nat Rev Genet2011,12(7):499–510.
16. Hoffmann TJ, Kvale MN, Hesselson SE, Zhan YP, Aquino C, Cao Y, Cawley S, Chung E, Connell S, Eshragh J, Ewing M, Gollub J, Henderson M, Hubbell E, Iribarren C, Kaufman J, Lao RZ, Lu Y, Ludwig D, Mathauda GK, McGuire W, Mei G, Miles S, Purdy MM, Quesenberry C, Ranatunga D, Rowell S, Sadler M, Shapero MH, Shen L,et al:Next generation genome-wide association tool: design and coverage of a high-throughput european-optimized SNP array.Genomics2011,98(2):79–89.
17. Matukumalli LK, Lawley CT, Schnabel RD, Taylor JF, Allan MF, Heaton MP, O’Connell J, Moore SS, Smith TPL, Sonstegard TS, Van Tassell CP: Development and characterization of a high density SNP genotyping assay for cattle.Plos One2009,4(4):e5350.
18. McCue ME, Bannasch DL, Petersen JL, Gurr J, Bailey E, Binns MM, Distl O, Guerin G, Hasegawa T, Hill EW, Leeb T, Lindgren G, Penedo MC, Røed KH, Ryder OA, Swinburne JE, Tozaki T, Valberg SJ, Vaudin M, Lindblad-Toh K, Wade CM, Mickelson JR:A high density SNP array for the domestic horse and extant perissodactyla: utility for association mapping, genetic diversity, and phylogeny studies.Plos Genet2012,8(1):e1002451. 19. Ramos AM, Crooijmans RPMA, Affara NA, Amaral AJ, Archibald AL, Beever JE,
Bendixen C, Churcher C, Clark R, Dehais P, Hansen MS, Hedegaard J, Hu ZL, Kerstens HH, Law AS, Megens HJ, Milan D, Nonneman DJ, Rohrer GA, Rothschild MF, Smith TP, Schnabel RD, Van Tassell CP, Taylor JF, Wiedmann
RT, Schook LB, Groenen MA:Design of a high density SNP genotyping assay in the Pig using SNPs identified and characterized by next generation sequencing technology.Plos One2009,4(8):e6524. 20. Miller JM, Poissant J, Kijas JW, Coltman DW, Consortium ISG:A
genome-wide set of SNPs detects population substructure and long range link-age disequilibrium in wild sheep.Mol Ecol Resour2011,11(2):314–322. 21. Meurs KM, Mauceli E, Lahmers S, Acland GM, White SN, Lindblad-Toh K: Genome-wide association identifies a deletion in the 3' untranslated region of striat in in a canine model of arrhythmogenic right ventricular cardiomyopathy.Hum Genet2010,128(3):351–324.
22. Groenen MAM, Megens HJ, Zare Y, Warren WC, Hillier LW, Crooijmans RPMA, Vereijken A, Okimoto R, Muir WM, Cheng HH:The development and characterization of a 60K SNP chip for chicken.BMC Genomics2011,12(1):274. 23. Rincon G, Weber KL, Van Eenennaam AL, Golden BL, Medrano JF:Hot topic: performance of bovine high-density genotyping platforms in holsteins and jerseys.J Dairy Sci2011,94(12):6116–6121.
24. Mogensen MS, Karlskov-Mortensen P, Proschowsky HF, Lingaas F, Lappalainen A, Lohi H, Jensen VF, Fredholm M:Genome-wide association study in Dachshund: identification of a major locus affecting intervertebral disc calcification.J Hered2011,102(Suppl 1):S81–86.
25. Kranis A, Gheyas AA, Boschiero C, Turner F, Yu L, Smith S, Talbot R, Pirani A, Brew F, Kaiser P, Hocking PM, Fife M, Salmon N, Fulton J, Strom TM, Haberer G, Weigend S, Preisinger R, Gholami M, Qanbari S, Simianer H, Watson KA, Woolliams JA, Burt DW:Development of a high density 600K SNP genotyping array for chicken.BMC Genomics2013,14:59.
26. Sanchez CC, Smith TP, Wiedmann RT, Vallejo RL, Salem M, Yao J, Rexroad CE 3rd:Single nucleotide polymorphism discovery in rainbow trout by deep sequencing of a reduced representation library.BMC Genomics2009, 10:559.
27. Wang SL, Sha ZX, Sonstegard TS, Liu H, Xu P, Somridhivej B, Peatman E, Kucuktas H, Liu ZJ:Quality assessment parameters for EST-derived SNPs from catfish.BMC Genomics2008,9:450.
28. Lien S, Gidskehaug L, Moen T, Hayes BJ, Berg PR, Davidson WS, Omholt SW, Kent MP:A dense SNP-based linkage map for Atlantic salmon (Salmo salar) reveals extended chromosome homeologies and striking differences in sex-specific recombination patterns.BMC Genomics2011, 12:615.
29. Gutierrez AP, Lubieniecki KP, Davidson EA, Lien S, Kent MP, Fukui S, Withler RE, Swift B, Davidson WS:Genetic mapping of quantitative trait loci (QTL) for body-weight in Atlantic salmon (Salmo salar) using a 6.5 K SNP array. Aquaculture2012,358:61–70.
30. Liu SK, Zhou ZC, Lu JG, Sun FY, Wang SL, Liu H, Jiang YL, Kucuktas H, Kaltenboeck L, Peatman E, Liu ZJ:Generation of genome-scale gene-associated SNPs in catfish for the construction of a high-density SNP array.BMC Genomics2011,12:53.
31. Sun L, Liu S, Wang R, Zhang Y, Zhang J, Jiang Y, Bao L, Kaltenboeck L, Waldbieser G, Kucuktas H,et al:Snp Variations In The Catfish Genome: Factors To Consider For Snp Identification Using Next Generation Sequencing. In(in review).
32. Xu P, Wang SL, Liu L, Thorsen J, Kucuktas H, Liu ZJ:A BAC-based physical map of the channel catfish genome.Genomics2007,90(3):380–388. 33. Ninwichian P, Peatman E, Liu H, Kucuktas H, Somridhivej B, Liu SK, Li P,
Jiang YL, Sha ZX, Kaltenboeck L, Abernathy JW, Wang WQ, Chen F, Lee Y, Wong LL, Wang SL, Lu JG, Liu ZJ:Second-generation genetic linkage Map of catfish and its integration with the BAC-based physical Map.G3-Genes Genom Genet2012,2(10):1233–1241.
34. Manolio TA, Collins FS, Cox NJ, Goldstein DB, Hindorff LA, Hunter DJ, McCarthy MI, Ramos EM, Cardon LR, Chakravarti A, Cho JH, Guttmacher AE, Kong A, Kruglyak L, Mardis E, Rotimi CN, Slatkin M, Valle D, Whittemore AS, Boehnke M, Clark AG, Eichler EE, Gibson G, Haines JL, Mackay TF, McCarroll SA, Visscher PM:Finding the missing heritability of complex diseases. Nature2009,461(7265):747–753.
35. Wang SL, Peatman E, Abernathy J, Waldbieser G, Lindquist E, Richardson P, Lucas S, Wang M, Li P, Thimmapuram J, Liu L, Vullaganti D, Kucuktas H, Murdock C, Small BC, Wilson M, Liu H, Jiang YL, Lee Y, Chen F, Lu JG, Wang WQ, Xu P, Somridhivej B, Baoprasertkul P, Quilang J, Sha Z, Bao B, Wang Y, Wang Q:Assembly of 500,000 inter-specific catfish expressed sequence tags and large scale gene-associated marker development for whole genome association studies.Genome Biol2010,11(1):R8.
assessment of syntenic conservation with other fish species.Anim Genet
2006,37(4):321–326.
37. Liu H, Jiang YL, Wang SL, Ninwichian P, Somridhivej B, Xu P, Abernathy J, Kucuktas H, Liu ZJ:Comparative analysis of catfish BAC end sequences with the zebrafish genome.BMC Genomics2009,10:592.
38. Simmons M, Mickett K, Kucuktas H, Li P, Dunham R, Liu ZJ:Comparison of domestic and wild channel catfish (Ictalurus punctatus) populations provides no evidence for genetic impact.Aquaculture2006, 252(2–4):133–146.
39. Kucuktas H, Wang SL, Li P, He CB, Xu P, Sha ZX, Liu H, Jiang YL,
Baoprasertkul P, Somridhivej B, Wang Y, Abernathy J, Guo XM, Liu L, Muir W, Liu ZJ:Construction of genetic linkage maps and comparative genome analysis of catfish using gene-associated markers.Genetics2009, 181(4):1649–1660.
40. Liu ZJ, Li P, Argue B, Dunham R:Random amplified polymorphic DNA markers: usefulness for gene mapping and analysis of genetic variation of catfish.Aquaculture1999,174(1-2):59–68.
41. Didion JP, Yang HN, Sheppard K, Fu CP, McMillan L, de Villena FPM, Churchill GA:Discovery of novel variants in genotyping arrays improves genotype retention and reduces ascertainment bias.BMC Genomics2012, 13:34.
doi:10.1186/1756-0500-7-135
Cite this article as:Liuet al.:Development of the catfish 250K SNP array for genome-wide association studies.BMC Research Notes20147:135.
Submit your next manuscript to BioMed Central and take full advantage of:
• Convenient online submission
• Thorough peer review
• No space constraints or color figure charges
• Immediate publication on acceptance
• Inclusion in PubMed, CAS, Scopus and Google Scholar
• Research which is freely available for redistribution