1
Study of the Impact of Structural Parameters on the Dynamic
1Response of an Electronic Fuel Injector
2Nao Hu1, 2, *, Jianguo Yang1, 3, Peilin Zhou2, Ying Hu1
3
1. School of Energy and Power Engineering, Wuhan University of Technology, 430063, Wuhan, PRC; 4
2. Department of Naval Architecture, Ocean and Marine Engineering, University of Strathclyde, G4 0LZ, 5
Glasgow, UK; 6
3. Key Laboratory of Marine Power Engineering &Technology, Ministry of Communications, 430063, Wuhan, 7
PRC; 8
*. Corresponding author 9
Abstract
10The study concentrates on the effects of structural parameters of an electronic fuel 11
injector on its dynamic response (the opening delay and the closing delay). The injector 12
was developed for a marine medium-speed diesel engine. The dynamic response from 13
the start of the control signal to the end of the needle valve closing were investigated. 14
Firstly, a complete and detailed model of the electronic fuel injector was built and 15
integrated into an optimisation model, where a MOGA was applied. Secondly, the 16
importance and effects of main structural parameters on dynamic response were 17
examined, as were their interactions. Finally, a Pareto optimum was obtained through 18
scattering charts and comparisons were made between the baseline design and the 19
optimal design. Results show that the control piston diameter, fuel oil inlet passage 20
2 diameter, fuel oil outlet passage diameter and their interactions are influential factors 21
to the opening delay, while the fuel oil inlet passage diameter has the dominant effect 22
on the closing delay. A small control piston diameter together with a small fuel oil inlet 23
passage diameter contribute to a short opening delay, however, they lead to a significant 24
increase in the closing delay. Moreover, a small closing delay prefers a large fuel oil 25
inlet passage diameter. The selected Pareto optimum achieved a significant reduction 26
in both the opening delay and the closing delay under three different rail pressures. 27
28
Keywords: electronic fuel injector; structural parameter; dynamic response; interaction; 29
optimization 30
31
Nomenclature
1D one dimensional PID proportional-integral-derivative
2D two dimensional RSM response surface method
ARMOGA adaptive range multi-objective genetic
algorithm SPF spring preload force
CPD control piston diameter SS-ANOVA
smoothing spline analysis of variance algorithm
Compact RIO
a real-time embedded industrial controller made by National Instruments
µGA micro-genetic algorithm
DOE design of experiments
ECU electronic control unit Functions and variables
GA genetic algorithm M objectives number HIL hardware in loop f function
HPCR high pressure common rail j variable
IPD fuel oil inlet passage diameter K a specific objective I/O input/output Pareto design
LABCAR a flexible test system developed by
3
MOGA multi-objective genetic algorithm
NSGA-II non-dominated sorting genetic
algorithm II Units
NZD nozzle orifice diameter mm millimetre NZN nozzle orifice number MPa mega Pascal OPD fuel oil outlet passage diameter ms millisecond PLC programmable logic controller N Newton
32
1 Introduction
33Nowadays, the HPCR system has gained significant attention and application as one of 34
the most promising technologies for the control of internal combustion engines. The 35
electronic fuel injector, one of the key components of HPCR systems, is of particular 36
interest to researchers. Many studies have already been carried out around the injector 37
nozzle area, and on the influences of nozzle types and nozzle numbers on the internal 38
flow and cavitation performance, for example, Molina et al. [1] investigated the inner 39
nozzle flow and cavitation development of elliptical orifices, in that study, four nozzles 40
with different major axis orientation and eccentricity value were compared with each 41
other and also with the standard nozzle. Benajes et al. [2], Payri et al. [3], and Han et 42
al. [4] focused on nozzle orifice types for electronic fuel injectors, comparisons were 43
made between a cylindrical nozzle and a conical one. He et al. [5], Moon et al. [6] and 44
Salvador et al. [7] studied the effects of different nozzle hole arrangements and needle 45
lift movements on the initial flow and cavitation development inside diesel injectors. 46
However, to date, little attention has been paid to the influence of the nozzle parameters 47
on dynamic response, i.e. the opening delay and closing delay. 48
4 Few studies were found in the literature which considers the impact of electronic fuel 50
injector structural parameters on the dynamic response. Salvador et al. [8] compared 51
the influences of a standard diesel fuel and biodiesels on the dynamic behaviour of a 52
solenoid-operated injector. A change of the fuel oil outlet passage diameter from 0.246 53
mm to 0.27 mm was proposed to eliminate the needle lift and injection rate deviations 54
between the two fuels. The deviations were caused by a higher viscosity of the biodiesel 55
fuel comparing to the regular diesel fuel. Results showed that the opening delay of the 56
biodiesel fuel was reduced significantly under low injection pressure to match that of 57
the standard diesel fuel. Additionally, some related studies are also worth mentioning. 58
Wang et al. [9] investigated the influence of control valve parameters on the flow and 59
cavitation inside the control valve. Stefano Beccari et al. [10] predicted the mass 60
injected by a gaseous fuel solenoid injector for spark ignition engines, with special 61
attentions paid to a gas injector and to the complex needle motion during the opening 62
and closing phases. Cheng et al. [11] investigated the impact of drive strategies on the 63
power losses and dynamic response of a solenoid injector. As it can be seen that these 64
studies focused on the dynamic response of the needle motion itself rather than on the 65
opening delay and closing delay, and also left structural parameters such as the control 66
piston diameter, fuel oil inlet passage diameter, fuel oil outlet passage diameter and the 67
spring preload force at the needle valve out of their scope. Salvador et al. [ 12 ] 68
investigated the impact of fuel temperature on injection dynamics, especially during the 69
opening stage and closing stage. The delays were considered, but the structural 70
5 In this paper, the impact of the structural parameters of an electronic fuel injector on 72
injector dynamic response of the opening delay and closing delay are carefully 73
investigated, and the opening delay and closing delay are the two objectives to be 74
minimised. Firstly, a complete and detailed 1D electronic fuel injector model was built 75
in AMESim and was validated by using injection quantity data and average steady-state 76
mass flow rate obtained from a HIL test rig. Then, an optimisation model was built in 77
the modeFRONTIER software, where the 1D fuel injector model was included and a 78
MOGA was applied for optimisation. Besides the impacts of the structural parameters, 79
the interactions of them were also studied. Scattering charts were used for selecting 80
Pareto designs and the sensitivity of the important parameters and interactions on the 81
delays were examined using RSM. 82
83
One-dimensional (1D) models have frequently been built and adopted in many studies 84
to predict the performance of electronic fuel injectors. R. Payri et al. [13] used a 1D 85
model of a solenoid-driven common rail ballistic injector to study the influences of the 86
inlet fuel temperature on injection rate. Seykens et al. [14] built a 1D model of an 87
injector to analyse the elasticity of the injector needle valve and nonlinearities caused 88
by the impact of the needle valve when it returns to its seat. Rahim et al. [ 15] 89
implemented a 1D model to study the effect of temperature on diesel engine 90
performance. The detailed modelling of a solenoid fuel injector and a third generation 91
piezo injector were demonstrated by Payri et al. [ 16 ] and Salvador et al. [ 17 ] 92
6 94
Since two objectives are involved in this study, it is naturally a multi-objective problem. 95
GA is born for solving multi-objective problems. It is based on the idea of the natural 96
selection which obeys the law of “survival of the fittest”. It can continually improves 97
the average fitness level of a population by means of inheritance, mutation, selection 98
and cross-over, eventually leading to an optimal design [18, 19, 20]. MOGA is the 99
modified version of the classic GA which can find a set of multiple non-dominant 100
solutions in a single run [21]. NSGA-II, one of the genetic algorithms, proposed by Deb 101
et al. [22], was proven to have better performance of finding a diverse set of solutions 102
and converging near the true Pareto front. Thus, in this paper, the NSGA-II algorithm 103
is applied. The NSGA-II algorithm employs an elite-preserving strategy and an explicit 104
diversity-preserving mechanism. According to the objectives, elitism is given to the 105
corresponding designs. Designs with a higher elitism have priority to be selected. If two 106
designs have the same elitism, the one with less crowding distance (proximity to other 107
Pareto solutions) is assigned with a higher priority. 108
109
Pareto optimums are often adopted in multi-objective optimisation occasions, as shown 110
in Fig. 1. Cases A-D can be considered as Pareto optimal cases due to the fact that none 111
of them is out-performed by other cases. These cases can be grouped together to form 112
a Pareto frontier [23].The Pareto optimality can be defined as follows: for all designs 113
and the corresponding M objectivesf xk( ), where, K= 1, 2, …, N. The Pareto design x* 114
7 meets the condition ( ) ( )*
k j k
f x f x . MOGA’s mission is to find the Pareto frontier whilst 116
maintaining diversity in the results. 117
118
Fig. 1 Definition of Pareto optimums 119
RSM is a technique for performing optimisation based on a approximation model, 120
which was built on a statistical technique of analysing the data generated by DOE [24]. 121
Here, a non-parametric classification and regression method, the k-nearest method, was 122
used to generate the response surface of influential parameters on the dynamic response. 123
The k-nearest method [25] is an interpolation method with non-intensive computational 124
requirements. Therefore, it is suitable for dealing with large data sets. 125
2 Specifications of the baseline injector
126The baseline injector was designed and produced for the application on marine 127
medium-speed diesel engines by an enterprise in China. The specifications of the 128
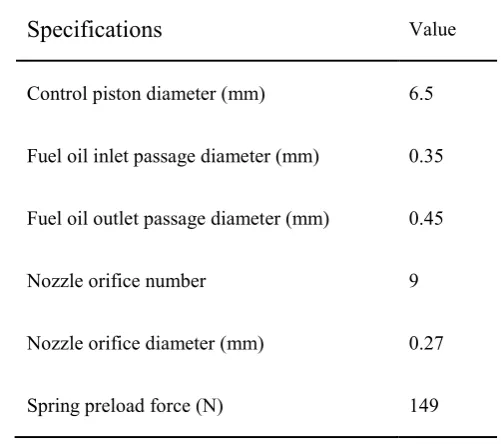
baseline electronic fuel injector given by the manufacturer are reported in Table 1. The 129
control piston diameter, fuel oil inlet passage diameter, fuel oil outlet passage diameter, 130
8 by the CPD, IPD, OPD, NZN, NZD and SPF respectively.
132
[image:8.595.82.333.178.400.2]133
Table 1 Specifications of the baseline electronic fuel injector 134
Specifications Value
Control piston diameter (mm) 6.5
Fuel oil inlet passage diameter (mm) 0.35
Fuel oil outlet passage diameter (mm) 0.45
Nozzle orifice number 9
Nozzle orifice diameter (mm) 0.27
Spring preload force (N) 149
3 Modelling of the electronic fuel injector
135The 1D simulation model of the fuel injector was built in the AMESim software. The 136
whole model was divided into three parts, i.e., the solenoid assembly, the injector body 137
and the nozzle assembly. The detailed modelling process is demonstrated below. 138
3.1 Modelling of the solenoid assembly 139
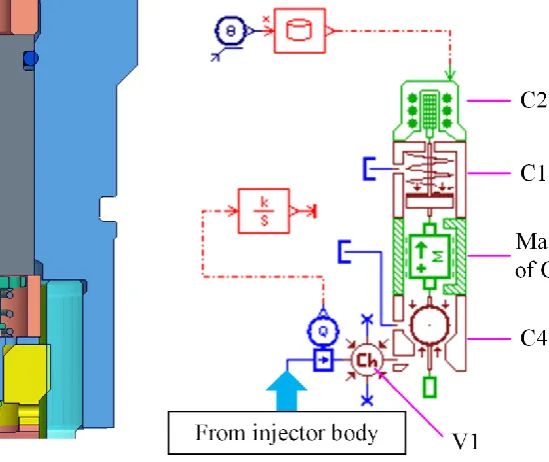
In Fig. 2, C1 is the solenoid spring, C2 is the solenoid coil, C3 is the control valve, V1 140
is the low-pressure chamber and C4 is the ball valve. The left part of Fig. 2 shows a 141
physical sketch of the solenoid assembly. The right part of the figure is part of a model 142
built according to the physical sketch. The control valve C3 is the moving element of 143
9 the ball valve C4 off its seat, thus, opened the fuel oil outlet passage.
145
[image:9.595.203.478.123.354.2]146
Fig. 2 Modelling of the solenoid assembly 147
Table 2 Parameters for the solenoid assembly 148
Element Diameter (mm) Spring rate (N/m)
Volume (cm3) Mass (g)
C1 - 70 - -
C3 - - - 4
V1 - - 0.001 -
C4 1.2 - - -
3.2 Modelling of the injector body 149
In Fig. 3, C5 is the control piston and C6 is the mandrel pushing rod. O1 and O2 stand 150
for the control chamber fuel oil inlet passage and the fuel oil outlet passage respectively. 151
L1-L5 represent oil lines. V0 is the rail volume and V2 is the control chamber volume. 152
153
[image:9.595.58.484.123.579.2]10 pressure in the V0 was adopted to simulate the pressure in the common rail. The 155
common rail is connected to the injector through high-pressure pipes, i.e. L2 and L4. 156
The L2 leads to the control chamber via a short tube L3 and the control chamber fuel 157
oil inlet passage O1. The L4 leads to the nozzle part. The volume V2 represents the 158
volume of the control chamber. It is connected to the solenoid valve via the fuel oil 159
outlet passage O2. The piston model C5 from the AMESim software includes a rod 160
with the piston. In practice, no rod is seen in the control chamber, therefore, the diameter 161
of the rod is set to zero in the model. Moreover, the mass, leakage, piston surfaces and 162
stiffness of the C5 are also included according to their physical characteristics. Lines 163
L5 represent the fuel oil return lines. 164
[image:10.595.63.499.379.753.2]165
Fig. 3 Modelling of the injector body 166
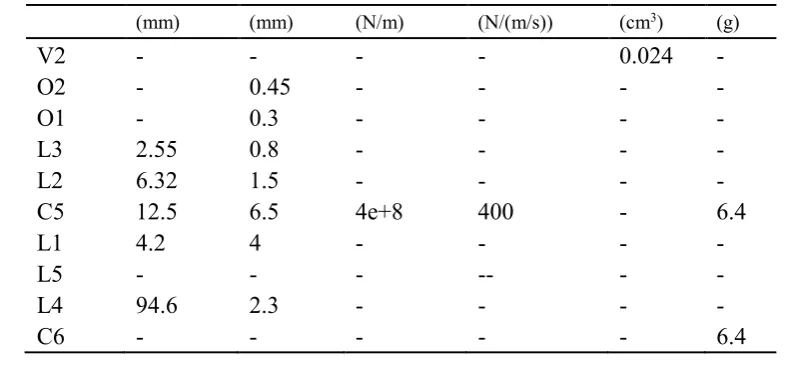
Table 3 Parameters for the injector body 167
11
(mm) (mm) (N/m) (N/(m/s)) (cm3) (g)
V2 - - - - 0.024 -
O2 - 0.45 - - - -
O1 - 0.3 - - - -
L3 2.55 0.8 - - - -
L2 6.32 1.5 - - - -
C5 12.5 6.5 4e+8 400 - 6.4
L1 4.2 4 - - - -
L5 - - - -- - -
L4 94.6 2.3 - - - -
C6 - - - 6.4
[image:11.595.77.470.70.253.2]3.3 Modelling of the nozzle assembly 168
Fig. 4 shows a cross-sectional view of the nozzle assembly and its model, where C7 is 169
the needle valve spring, C8 is the needle valve body, and C9 is the nozzle. V3 is the 170
return oil chamber while V4 is the accumulation chamber. L4 is the inlet of the high-171
pressure fuel to the accumulation chamber V4. The nozzle assembly connects to the 172
injector body both hydraulically and mechanically. The needle valve stiffness and mass 173
are considered in the modelling and simulation. A piston model from AMESim is used 174
to simulate the hydraulic force acting on the lower part of the needle valve in the 175
accumulation chamber. The most import parts in the modelling of the nozzle assembly 176
are the nozzle orifice parameters and their layout. Here, the group of parameters should 177
be set accurately, for example, the needle valve diameter, the valve seat angle, the 178
needle cone angle, the sac volume, the maximum flow coefficient of the orifices and 179
12 181
[image:12.595.84.505.478.589.2]Fig. 4 Modelling of injector nozzle assembly 182
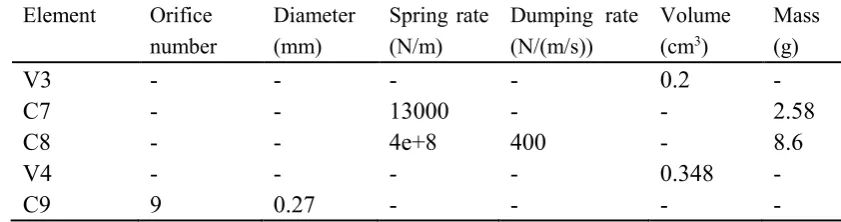
Table 4 Parameters for the injector nozzle assembly 183
Element Orifice number
Diameter (mm)
Spring rate (N/m)
Dumping rate (N/(m/s))
Volume (cm3)
Mass (g)
V3 - - - - 0.2 -
C7 - - 13000 - - 2.58
C8 - - 4e+8 400 - 8.6
V4 - - - - 0.348 -
C9 9 0.27 - - - -
3.4 Integration of the injector model 184
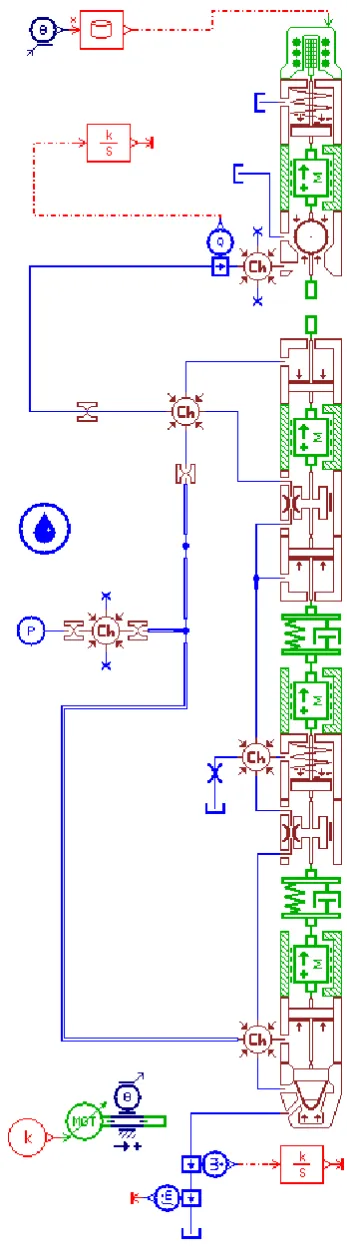
A complete sketch of the injector model is shown in Fig. 5. It is the integration of the 185
solenoid assembly, injector body and the nozzle assembly. In this model, some 186
assumptions were made that all the variations are considered to be isothermal, so, the 187
13 the injector inlet, and the fuel properties were assumed to be constant [26]. Additionally, 189
a constant pressure source was adopted here to simulate the pressure from the high-190
pressure pump, which neglected the pressure fluctuations caused by the cyclical oil 191
supply from high-pressure pumps. Moreover, the pressure wave propagation was not 192
14 194
15
4 Model validation
1964.1 Fuel properties 197
A common used #0 diesel fuel in China was used in the study, the main properties are 198
[image:15.595.80.324.251.476.2]shown in Table 5. 199
Table 5 Physical and chemical properties of the #0 diesel fuel 200
Properties Value
Density at 20 ℃, kg/m3 845
Viscosity at 20 ℃, mm2/s 4.72
Cetane number 57.6
50% distillate at, ℃ 273
90% distillate at, ℃ 339
95% distillate at, ℃ 355
4.2 Experimental facilities 201
The experiments were carried out on a HIL test rig. HIL is a kind of technology for 202
semi-physical simulation, where some components in the loop are replaced by software 203
models. The sketch of the HIL test rig is shown in Fig 6, in which the authentic diesel 204
engine was replaced by a diesel engine model built in LABCAR system. Its working 205
principle is shown as follows: 206
(1) A PID method is adopted to speed governing, i.e., the cycle injection quantity (
○
6 ) 20716 signal (
○
14 ) and crankshaft signal (○
15 ) with a given speed.209
(2) The width of the control signal (
○
8 ) to fuel injectors is decided by the cycle 210injection quantity. 211
(3) Rail pressure (
○
13 ) value is obtained by the ECU and is set as one of the input 212parameters to the diesel engine model. The feeding pumps of the common rail 213
system are controlled by proportional valves to match the fuel quantity ejected. 214
(4) Engine speed is calculated in the diesel model by combining the cycle injection 215
quantity (
○
6 ) and load settings (○
3 ). This engine speed is transformed into signals 216to control the servo motor, which drives the camshaft (
○
20 ) to simulate the engine 217running. 218
(5) All of the signals including temperatures, pressures and I/O status are monitored 219
17 221
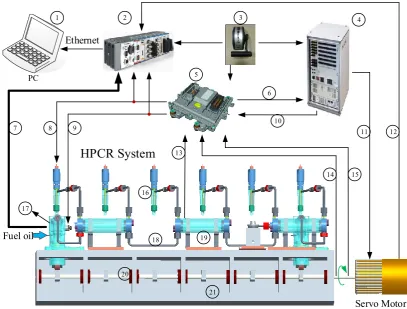
○1 : computer;○2 : Compact RIO (a real-time embedded industrial controller made by National
222
Instruments); ○3: engine telegraph; ○4: LABCAR system (a flexible test system developed by ETAS );
223
○5: ECU; ○6: cycle fuel injection quantity; ○7 : sensor signals of the HPCR system; ○8: ECU injection
224
signal; ○9: ECU control signal for the proportional valve; ○10: correction signal from the LABCAR; ○11:
225
control signal for the servo motor; ○12: encoder speed signal; ○13: pressure signal of rails; ○14: camshaft
226
angle signal; ○15: crankshaft angle signal; ○16: injector; ○17: high pressure pump; ○18: high pressure oil
227
tub; ○19: common rail; ○20: camshaft; ○21: oil pan.
[image:17.595.93.501.78.387.2]228
Fig. 6 Systematic configuration of the HIL test rig 229
4.1.2 Injection quantity measuring 230
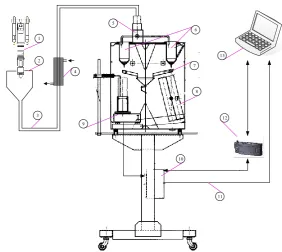
One of the most important parts of the HIL test rig would be the injection quantity 231
measuring device. The sketch of it is shown in Fig. 7. Oil injected from the injector (○1 )
232
flows through the demister (○2 ) and cooler (○4 ) successively, then flows to the oil
233
weighting device. Two weighting methods are available, one measures the fuel volume 234
via a measuring glass (○8 ), the other weights the fuel mass via an electronic scale (○9 ).
235
PC
Ethernet
HPCR System
Servo Motor
7 8 9
18 The two methods can be switched to each other in the control of a PLC (○12) through an
236
electronic three-way valve (○5 ).
237
238
○1: electronic fuel injector; ○2: demister; ○3 : oil tube; ○4: cooler; ○5: three-way valve; ○6: collector;
239
○7: oil baffle plate; ○8: measuring glass; ○9 : electronic scale; ○10: junction box; ○11: cables; ○12: PLC.
[image:18.595.84.367.141.393.2]240
Fig. 7 Fuel oil measurement device 241
4.3 Validation 242
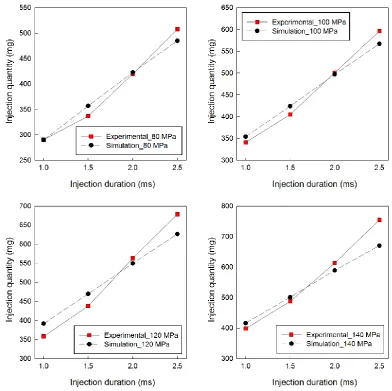
Limited by the experimental conditions, only the injection quantity data could be 243
obtained for validating the electronic fuel injector model from the HIL test rig. 244
Experiments were carried out at room temperature and under 4 different rail pressures, 245
i.e., 80 MPa, 100 Mpa, 120 MPa and 140 MPa. Under each pressure, 4 different fuel 246
injection pulse widths were applied, i.e., 1ms, 1.5ms, 2ms and 2.5ms. The injection 247
mass comparison of simulation results and experimental results are shown in Fig. 8. 248
The average steady-state mass flow rate calculated by the injection quantity data are 249
1
2
3
4
5
6
7
9
10
11 12 13
19 compared with simulation fuel injection rate, as is shown in Fig. 9. The average steady-250
state mass flow rate of the 1ms injection pulse condition is excluded since it is too short 251
for the injection rate to reach a steady state. The average steady-state mass flow rates 252
of 1.5ms, 2.0ms and 2.5ms under different pressures are represented by red circles, red 253
triangles and red squares respectively. 254
[image:19.595.101.494.245.636.2]255
20 257
Fig. 9 Average steady flow rate comparison of experimental data and simulation data 258
It can be seen that the main trend in simulation data for total injection mass and average 259
steady-state mass flow rates show agreement with the experiment data under all four 260
different rail pressures. 261
5 Multi-objective optimisation of the electronic fuel injector
2625.1 Definition of the optimisation objectives 263
21 defined toΔT1, which is the delay between t1 and T2, and the closing delay is defined 265
toΔT3, which is the delay between t3 and T4. In other words, ΔT1=T2-t1 andΔT3= 266
T4-t3. A small opening delay and closing delay mean that a faster and better response 267
can be achieved which offers greater flexibility for developing multi-injection control 268
strategies. Thus, the opening delay and the closing delay are set as the two objectives 269
to be minimised. 270
271
t1: the control signal starts to be energised; t2: the control signal has reached to its maximum amplitude; 272
t3: the control signal begins to be de-activated; t4: the control signal has fully closed; T1: the needle 273
valve starts to open; T2: the needle valve has reached its maximum displacement; T3: the needle valve 274
[image:21.595.76.348.146.471.2]begins to close; T4: the needle valve has fully closed. 275
Fig. 10 Definition of the dynamic response 276
5.2 Optimisation model 277
An optimisation model was built within the modeFRONTIER software for multi-278
objective optimisation, as is shown in Fig. 11. Firstly, a random sequence was adopted 279
in the DOE type. Then, an NSGA-II algorithm was selected. After that, a MATLAB 280
22 orifice number was created. An AMESim node was used to invoke the whole electronic 282
fuel injector model, where the displacements of the control signal and the needle valve 283
were generated. These data was firstly written into a text file, and to do this, appropriate 284
writing and reading rules needed to be developed. The text file is read by the MATLAB 285
node, where the control signal timings (t1, t2, t3 and t4) and needle valve lift timings 286
(T1, T2, T3 and T4) are calculated. The opening delay and the closing delay can thus 287
be obtained from the timings according to the definition shown in section 5.1. 288
Additionally, a constraint was set between the fuel oil inlet passage diameter and fuel 289
oil outlet passage diameter that the former should be smaller than the latter in each run. 290
291
1: DOE type; 2: MOGA Algorithm; 3: MATLAB node; 4: AMESim node; 5: transfer the text files of the 292
control signal and the needle valve displacement synchronously; 6: read the control signal data and the 293
needle valve displacement data from files respectively; 7: MATLAB node; 8: calculation of the objectives; 294
[image:22.595.86.507.359.579.2]9: objectives; 10: input parameters. 295
Fig. 11 Multi-objective optimisation model 296
5.3 Boundaries and settings of input parameters 297
23 for setting boundaries in the optimisation were obtained from parametric study.
[image:23.595.92.373.149.336.2]299
Table 6 Input parameters of the multi-objective optimisation model 300
Input parameter Lower bound Upper bound Resolution
CPD (mm) 5.8 8.0 0.1
IPD (mm) 0.2 0.45 0.01
OPD (mm) 0.36 0.9 0.02
NZN 6 10 1
SPF (N) 60 360 10
301
The range of nozzle orifice diameter (NZD) is set according to the parameter NZN, as 302
shown in Fig. 12. The parameter NZD under each NZN can be set to five values, which 303
are chosen randomly in the MATLAB node. Thus, an approximate total circulating area 304
of the fuel injector nozzle is guaranteed. 305
306
[image:23.595.90.483.515.653.2]24 5.4 Calculation settings
308
Table 7 gives detailed information about the calculation settings for the NSGA-II 309
method. The 100 initial random DOE designs were each coordinated with 20 310
generations runs [27]. Thus, a total number of 2000 runs were carried out. In theory, the 311
larger the numbers, the closer the optimal designs to the real Pareto frontier. Other 312
parameters were set as default values in the modeFRONTIER [28]. 313
[image:24.595.80.346.337.654.2]314
Table 7 Calculation settings for the NSGA-II algorithm 315
Property Value
Number of initial designs 100
DOE scheme RANDOM
Optimization algorithm NSGA-II
Number of generations runs 20
Crossover probability 0.9
Mutation probability for real-coded vectors 1.0
Mutation probability for binary strings 1.0
Crossover type for binary-Code variables Simple
Total number of analyses 2000
25
6 Results and discussion
3176.1 Influential factors analysis 318
The importance of structural parameters and their interactions to the objectives were 319
studied through a second order Smoothing Spline Analysis of Variance (ANOVA) 320
algorithm. Here, structural parameters and their interactions are referred to factors. The 321
relative importance ranking is shown in Fig. 13. All of the weights of factors add up to 322
1 and only the top six influential factors are reported in the figure. The left column and 323
the right column show the relative importance of factors on the opening delay and 324
closing delay respectively. The first row, the second row and the third row demonstrate 325
the results under the rail pressures of 80 MPa, 120 MPa and 160 MPa respectively. 326
327
The left column of Fig.13 indicates that parameters CPD, IPD, OPD and their 328
interactions are the most influential factors on the opening delay of all the three rail 329
pressures. Although the CPD, IPD and their interactions rank as the first three factors, 330
other factors such as the OPD, interactions of the CPD&IPD and IPD&OPD are still 331
not negligible. The right column of Fig. 13 shows that the IPD has a dominant influence 332
on the closing delay, which is nearly two to three times larger than CPD, which is the 333
second largest influential factor. The influences of the NZN and NZO on dynamic 334
response are much less than the IPD and CPD have. 335
336
26 demonstrated by RSM function charts at 160 MPa pressure, which is shown in Fig. 14. 338
These function charts were generated through the RSM function on selected parameters. 339
Only one parameter is changed at a time while other parameters are kept at the same 340
values as the baseline design. Thus, the way in which these important parameters affect 341
the opening delay and closing delay can be easily seen. It can be seen in Fig. 14 that the 342
increase in CPD and IPD leads to a huge rise in the opening delay. However, the 343
increase in OPD reduces the opening delay. As for the closing delay, this decreases with 344
an increase in parameters IPD and SP. When the CPD increases, the closing delay drops 345
accordingly. 346
27
Fig. 13 Importance rank of structural parameters to objectives 348
[image:27.595.74.420.124.495.2]349
Fig. 14 RSM function charts at 160 MPa rail pressure 350
The CPD mainly affects the upper surface area of the control piston. Thus, a larger CPD 351
means a larger upper surface area of the control piston, and a larger pressure force being 352
exerted on it. Since the pressure force working on the lower part of the needle valve 353
remains the same, a smaller net force is obtained when the solenoid valve is energised. 354
However, it is exactly this net force pushes the needle valve upward to start the fuel 355
injection. In this condition, the smaller net force surely slows down the needle valve 356
28 is deactivated, the control chamber regains rail pressure and a larger opposite net force 358
pushes the needle valve downwards quickly, which reduces the closing delay. However, 359
the influence of CPD on the closing delay is much smaller than that on the opening 360
delay, proofs can be seen in the first row of Fig. 14. 361
362
The IPD mainly affects the oil charge rate. A larger IPD brings in a bigger oil charge 363
rate when the solenoid valve is energised. Since the oil discharge rate in the oil outlet 364
passage remains the same, the pressure in the control chamber drops slower than with 365
a small IPD, which slows down the opening velocity at the opening stage and 366
accelerates the needle valve closing velocity at the closing stage. Thus a larger IPD 367
leads to a larger opening delay and a smaller closing delay and vice versa. Proof can be 368
seen in the second row of Fig. 14. 369
370
An interesting phenomenon can be seen from the left column of Fig. 13 that the CPD 371
is the most influential factor in the opening delay at 80 MPa pressure and 120 MPa 372
pressure but its position is replaced by the IPD at 160 MPa pressure. As it is already 373
presented, the CPD affects the area on which the pressure exerts and the IPD affects the 374
fuel oil charge rate of the control chamber. Both of them affects the pressure force on 375
the upper surface of the control piston eventually. At high-pressure condition, a larger 376
oil charge rate can be seen than that at low-pressure condition, even the IPD remains 377
the same. This is the main reason for a more import role the IPD plays at high-pressure 378
29 at low-pressure condition, and the relevance decreases at medium pressure and it 380
increases again at high-pressure condition, as shown in the right column of Fig. 13. The 381
possible reasons which caused this might be the different samples used for the analysis 382
since these different samples were generated by three different runs under three 383
different pressures. 384
385
The OPD determines the oil discharge rate. A larger OPD means more fuel can be 386
discharged from the control chamber into the low-pressure chamber if other conditions 387
are kept the same. Thus, the pressure force exerted on the upper surfaces of the control 388
piston decreases quickly to help the needle valve open. In this case, a smaller opening 389
delay is achieved. 390
391
From the third row of Fig. 14, it can be seen that the closing delay decreases with the 392
increase in SPF. It can be easily construed that a larger SPF helps the needle valve move 393
upwards faster. In other words, a larger SPF increases the downward net force so that 394
the movement of the needle valve is accelerated to shorten the closing delay. From the 395
right column of Fig. 13, the SPF is surprisingly influential on objectives at low-pressure 396
condition but its influence diminishes at high-pressure condition. At low-pressure 397
condition, the pressure forces exerting on the upper surface of the control piston and on 398
the lower part of the needle valve are both smaller than that at high-pressure condition. 399
Since the SPF remained the same, thus, the rates of the SPF to the pressure forces at 400
30 SPF is more comparable to the small hydraulic forces at low-pressure condition, 402
however, it becomes ignorable to the large hydraulic forces when the pressure increases. 403
404
6.2 Response surface analysis 405
Fig. 13 highlights the fact that factors CPD, IPD and their interactions are of greatest 406
significance to the opening delay and the closing delay. Since the response surfaces at 407
80 MPa and 120 MPa are nearly the same as that at 160 MPa, only the response surface 408
at 160 MPa was generated and demonstrated. The RSM contour maps are shown in Fig. 409
15 and Fig. 16. In both figures, the bright points present the performance of the baseline 410
design. 411
412
From Fig. 15, it can be clearly seen that a small CPD together with a small IPD 413
contributes to a short opening delay. However, large CPD and IPD increase the opening 414
delay dramatically. As it is stated in section 6.1, a large CPD diminishes the net force 415
which pushes the needle valve moving upward and enlarges the opening delay. This is 416
especially true when large IPD applied, which slows down the pressure drop in the 417
control chamber to help increase the opening delay. 418
419
Fig. 16 shows that a small closing delay is achieved with a large IPD. A small CPD and 420
a small IPD together lead to a significant increase in the closing delay. A small IPD 421
31 the rail pressure. Thus, a larger closing delay comes along. Combine with a small CPD, 423
which weakens the net force pushing needle valve downward, an extreme longer 424
closing delay shows up. 425
426
[image:31.595.54.382.64.731.2]427
Fig. 15 Response surface of the opening delay under 160 MPa rail pressure 428
429
Fig. 16 Response surface of the closing delay under 160 MPa rail pressure 430
6.3 Pareto optimum 431
Fig. 17 (a), (b) and (c) are the optimisation results for three different rail pressures (80 432
[image:31.595.71.375.197.385.2] [image:31.595.90.377.418.604.2]32 solid triangles. The baseline design is marked with a deep blue square and the selected 434
optimal design is shown as a green hollow reversed triangle. 435
436
A clear trade-off can be seen between the opening delay and the closing delay in each 437
figure. Pareto frontiers are also noted to be closer to the coordinates under a high rail 438
pressure than under a low rail pressure. This indicates that a high pressure contributes 439
to faster opening and closing movements of the electronic fuel injector, and thus to a 440
shorter opening delay and closing delay. 441
442
Table 8 gives the detailed improvements of the selected optimal design. Compared to 443
the baseline design, both the opening delay and the closing delay of the selected optimal 444
design have witnessed a huge reduction in all three rail pressures, specifically, the 445
reduction of 29.82%, 29.19% and 20.86% in the opening delay at pressures of 80 MPa, 446
120 MPa and 160 MPa respectively. Nearly the same reduction scale, i.e., 25.62%, 447
24.54% and 30.11% for the closing delay was achieved under different pressures 448
respectively. Table 8 shows the specific values of the opening delays and closing delay 449
of the optimal design and the baseline design, and comparisons are made in Fig. 18. 450
Table 9 reports the structural parameter details of the baseline design and the optimal 451
design. 452
33 454
34 456
35 458
[image:35.595.85.468.102.497.2](c) Scattering results under 160 MPa rail pressure 459
Fig. 17 Pareto citizens and the selected designs under various rail pressures 460
461
Table 8 Detailed objective comparisons of the optimal design and the baseline design 462
Pressure
(MPa)
Delay Baseline
(ms)
Optimum
(ms)
Status Degree
(%)
80
Opening 1.197 0.840 ↓ 29.82
[image:35.595.89.380.611.736.2]36
120
Opening 0.908 0.643 ↓ 29.19
Closing 0.974 0.735 ↓ 24.54
160
Opening 0.767 0.607 ↓ 20.86
Closing 0.880 0.615 ↓ 30.11
[image:36.595.69.389.73.497.2]463
Fig. 18 Objective comparisons of the baseline design and the optimal design 464
465
Table 9 Comparison of structure parameter values before and after optimisation 466
Parameter Baseline Optimum
CPD (mm) 6.5 6.2
IPD (mm) 0.3 0.39
OPD (mm) 0.45 0.90
[image:36.595.91.294.573.732.2]37
NZD (mm) 0.27 0.23
SPF (N) 149 290
467
Since the selected optimal design reaches the maximum value of the OPD, which 468
implies the upper bound for the OPD might be set too small. Thus, a further study on 469
the OPD was carried out to examine the effects of it on injector dynamic response 470
independently at the three rail pressures respectively. Results are shown in Fig. 19 that 471
the closing delay remained almost the same while the opening delay decreases 472
monotonously with the increases of the OPD but the trend becomes gentle, especially 473
when the OPD is larger than 0.9mm. In this manner, enlarge the upper bound of the 474
OPD would be meaningless. 475
[image:37.595.91.436.451.715.2]476
38 The solenoid valve displacement and needle valve displacements of both the baseline design 478
and the optimal design are compared for three different rail pressures, as shown in Fig. 20. The 479
injection rate is shown in Fig. 21. In both figures, the needle valve displacements of the baseline 480
design under different rail pressures are represented by black lines, while needle valve 481
displacements of the optimum under various rail pressures are shown by red ones. Different rail 482
pressures are distinguished by line types, i.e., 160 MPa, 120MPa and 80MPa are represented 483
by solid lines, dash lines and dot lines respectively. The control signal, marked by blue lines, 484
are also drawn in both the Fig. 20 and Fig. 21 in order to have references. Since the nozzle 485
orifice diameter of the optimal deign is smaller than that of the baseline design, the 486
maximum injection rate is much less under the same energise time, as shown in Fig. 21. 487
[image:38.595.91.505.422.705.2]488
39 490
Fig. 21 Injection rate of the baseline design and the optimal design under various rail pressures 491
7 Conclusion
492The above research concentrated on the modelling and optimisation of structural 493
parameters of an electronic fuel injector. A complete and detailed model of the 494
electronic fuel injector was built using AMESim software according to its physical 495
geometries. The model was validated by the experimental injection quantity data and 496
average steady-state mass flow rate (if test condition permits, the injector model is 497
better to be validated by injection quantity together with transient injection rate) 498
obtained from a HIL test rig. Then, an optimisation model was built using 499
40 method. The importance of the structural parameters of the dynamic response was 501
examined. RSM function charts disclosed how these important structural parameters 502
affect the dynamic response. Then, RSM contour maps were applied to study the 503
interactions between the CPD and IPD. Finally, a Pareto optimal design with the best 504
trade-off between the opening delay and the closing delay was singled out. 505
506
The main conclusions are drawn below: 507
508
(1) The CPD, IPD, OPD and their interactions are influential factors for the opening 509
delay, while the IPD has a dominant effect on the closing delay. 510
511
(2) The increases in the CPD and IPD lead to a huge rise of in the opening delay. 512
However, the increase in the OPD reduces the opening delay. The closing delay 513
decreases with the increase in the IPD and SP. Moreover, it drops along with the 514
increase in CPD. 515
516
(3) A small CPD together with a small IPD contribute to a short opening delay but 517
enlarge the closing delay significantly. To the opposite, a large CPD and IPD increase 518
the opening delay dramatically. A large IPD also minimises the closing delay. 519
520
(4) The effects of the spring preload force on the closing delay are surprising noticeable 521
41 spring preload force.
523
524
(5) The dynamic response of the selected optimal design achieves a huge reduction in 525
3 different rail pressures (80 MPa, 120 MPa and 160 MPa). More specifically, the 526
opening delay reduced by 29.82%, 29.19% and 20.86%, and the closing delay reduces 527
by 25.62%, 24.54% and 30.11% respectively. 528
529
Acknowledgment
530The authors are grateful to the Wuhan University of Technology for providing 531
experimental facilities and test data. We also appreciate the Department of Naval 532
Architecture, Ocean and Marine Engineering of the University of Strathclyde for the 533
calculation support on the project. 534
535
Funding: This work was supported by the project “Engineering Development of a 536
Medium-Speed Dual Fuel Engine (Ministry of Industry and Information 537
Technology NO. (2013) 412, 2)” from China and the project “An Investigation into the 538
Characteristics of High-pressure Common Rail Injection System” from Lloyds 539
Register of Shipping of UK. 540
541
42 [1] Molina S, Salvador FJ, Carreres M, Jaramillo. A computational investigation on the
influence of the use of elliptical orifices on the inner nozzle flow and cavitation
development in diesel injector nozzles. Energy Conversion and Management 2014;
79:114-127.
[2] Benajes J, Pastor JV, Payri R, Plazas AH. Analysis of the influence of diesel nozzle
geometry in the injection rate characteristics. J Fluids Eng. 2004; 126: 63-71.
[ 3 ] Payri R, Garcia JM, Salvador FJ, Gimeno J. Using spray momentum flux
measurements to understand the influence of diesel nozzle geometry on spray
characteristics. Fuel 2005; 84: 551-561.
[4] Han JS, Lu PH, Xie XB, Lai MC, Henein NA. Investigation of diesel spray primary
breakup and development for different nozzle geometries. SAE Paper 2002;
2002-01-2775.
[5] He Z, Zhong W, Wang Q, Jiang Z, Fu Y. An investigation of transient nature of the
cavitating flow in injector nozzles. Applied Thermal Engineering 2013; 54: 56-64.
[6] Moon S, Gao Y, Park S, Wang J, Kurimoto N, Nishijima Y. Effect of the number
and position of nozzle holes on in- and near-nozzle dynamic characteristics of diesel
injection. Fuel 2015; 150:112-122.
[7] Salvador FJ, Martínez-López J, Caballer M, De Alfonso C. Study of the influence
of the needle lift on the internal flow and cavitation phenomenon in diesel injector
nozzles by CFD using RANS methods. Energy Conversion and Management 2013;
66:246-256.
43 modeling to analyze the influence of the use of biodiesels on the dynamic behavior of
solenoid-operated injectors in common rail systems: Results of the simulations and
discussion. Energy Conversion and Management 2012; 54: 122-132.
[9] Wang C, Li GX, Sun ZY, et al. Effects of structure parameters on flow and cavitation
characteristics within control valve of fuel injector for modern diesel engine. Energy
Conversion and Management 2016; 124: 104-115.
[10] Beccari S, Pipitone E, Cammalleri M, Genchi G. Model-based optimization of
injection strategies for SI engine gas injectors. Journal of Mechanical Science and
Technology 2014; 28 (8): 3311-3323.
[11] Cheng Q, Zhang ZD, Xie NL. Power losses and dynamic response analysis of
ultra-high speed solenoid injector within different driven strategies. Applied Thermal
Engineering 2015; 91: 611-621.
[ 12 ] Salvador FJ, Gimeno J, Carreres M, Crialesi-Esposito M. Fuel temperature
influence on the performance of a last generation common-rail diesel ballistic injector.
Part I: Experimental mass flow rate measurements and discussion. Energy Conversion
and Management 2016; 114: 364-375.
[13] Payri R, Salvador FJ, Carreres M, DelaMorena J. Fuel temperature influence on
the performance of a last generation common-rail diesel ballistic injector. Part II: 1D
model development, validation and analysis. Energy Conversion and Management
2016; 114: 376-391.
[14] Seykens XLJ, Somers LMT, Baert RSG. Detailed modelling of common rail fuel
injection process. J Middle Eur Construct Des Cars (MECCA) 2005; 3:30-39.
[15] Rahim R, Mamat R, Taib MY, Abdullah AA. Influence of fuel temperature on
44 226-36.
[16] Payri R, Salvador FJ, Martí-Aldaraví P, Martínez-López J. Using one-dimensional
modelling to analyse the influence of the use of biodiesels on the dynamic behaviour of
solenoid-operated injectors in common rail systems: Detailed injection system model.
Energy Conversion and Management 2012, 54: 90-99.
[17] Salvador FJ, Plazas AH, Gimeno J, Carreres M. Complete modelling of a piezo
actuator last-generation injector for diesel injection systems. International J of Engine
Research 2014; 15 (1): 3-19.
[18] Holland JH. Adaptation in natural and artificial systems. Ann Arbor: University of
Michigan Press; 1975
[19] Gen M, Cheng R. Genetic algorithms and engineering design. London: Wiley;
1997.
[20] D.E. Goldberg. Genetic algorithms in search, optimization and machine learning
Addison Wesley Publishing Company Inc; 1989.
[21] Abdullah K, David WC, Alice ES, 2006. Multi-objective optimization using
genetic algorithms: A tutorial. Reliability Engineering and System Safety; 91: 992-1007.
[22] Deb K, Pratap A, Agarwal S, Meyarivan T. A fast and elitist multiobjective genetic
algorithm: NSGA-II. Evol Comput 2002, 6 (2): 182-197.
[23] DAS I and Dennis JE. Normal-boundary intersection: a new method for generating
the Pareto surface in nonlinear multicriteria optimization problems. Society for
Industrial and Applied Mathematics 1988; 8(3): 631-657.
45 (with discussion). Journal of the Royal Statistical Society Series B 1951; 13(1): 1-45.
[25] Poles S, Lovison A. Shepard’s and k-nearest’s methods in the newly implemented
response surfaces. modeFRONTIER help, Technical Report 2006-004; 2006.
[26] Payri R, Salvador FJ, Carreres M, De la Morena J. Fuel temperature influence on
the performance of a last generation common-rail diesel ballistic injector. Part II: 1D
model development, validation and analysis. Energy Conversion and Management
2016; 114: 376–391.
[27] Shi Y and Reitz RD. Assessment of optimization methodologies to study the
effects of bowl geometry, spray targeting and swirl ratio for a heavy-duty diesel
engine operated at high-load. SAE Int. J. Engines 2008; 1(1): 537-557.