Rochester Institute of Technology
RIT Scholar Works
Theses Thesis/Dissertation Collections
5-1-2011
Distribution patterns of river otters, Lontra
canadensis, within Monroe County, New York
Darren Doherty
Follow this and additional works at:http://scholarworks.rit.edu/theses
This Thesis is brought to you for free and open access by the Thesis/Dissertation Collections at RIT Scholar Works. It has been accepted for inclusion in Theses by an authorized administrator of RIT Scholar Works. For more information, please [email protected].
Recommended Citation
Distribution patterns of river otters, Lontra canadensis, within
Monroe County, New York
by
Darren Doherty
A Thesis Submitted in
Partial Fulfillment of the
Requirements for the Degree of
Master of Science
in Environmental Science
Department of Environmental Science
Rochester Institute of Technology
September 1, 2010
Thesis Committee: Dr. Lei Lani Stelle,
Table of Contents
Abstract………3
Acknowledgements………..4
Introduction………. 5
History and Background Information………..5
Diet/Habitat………..6
Work at RIT……...……….……….8
Project Goals...……….…...9 Materials/Methods………..………...10 Results………...……….………19 Sprainting Activity………...……….……….19 Water Chemistry……….………...………20 Benthic Macroinvertebrates………...23
Land Use/Land Cover(LULC)...24
Discussion………..24 Honeoye Creek………...25 Black Creek………....27 Oatka Creek………....28 Conclusions………30 Limitations………...31 Future Work………...32 References………..34 Appendices Appendix A………37 Appendix B………41 Appendix C………42 Appendix D………43 Appendix E………45
List of Tables Table 1: The number of surveys within the study area………..20
Table 2: Water chemistry data for the three creeks………....………...21
Table 3: Water quality impact of the three creeks……….23
Table 4: Macroinvertebrate indices for the three creeks...23
Table 5: Three highest LULC within the three creeks...25
List of Figures Figure 1: Macroinvertebrate and Water Chemistry Points...……….13
Figure 2: Otter Latrine Sites…….……….15
Figure 3: Water Quality Index Chart……….18
Figure 4: Black Creek Sample Sites ...……….20
Figure 5: Oatka Creek Sample Sites ………...………...22
Abstract:
River Otters, Lontra canadensis were reintroduced to western NY after being extirpated in the early 1900’s. The goal of this project was to understand what environmental
variables influence habitat selection of river otters, within Monroe County, New York. Water chemistry and the use of benthic macroinvertebrates were investigated to assess
the water quality and human impacts. The research area included three tributaries of the
Genesee River: Black, Honeoye, and Oatka Creeks. At identified latrine sites, I collected
macroinvertebrates at 9 sites and water chemistry at 30 sites to provide an index of the
water quality. Geographical Information Systems (GIS) was used to incorporate land use
and determine if there are any relationships between water quality and habitat preference.
A statistical analysis of the chemistry and invertebrate sites showed that there is not
enough evidence to conclude that a significant positive correlation exists between water
quality and river otter habitat selection. However, the data suggest that other possible
parameters are influencing selection or there just isn’t a significant enough difference
between the creeks to deter otter inhabitance. With more confirmed otter sites, more
Acknowledgements:
“Feeling gratitude and not expressing it is like wrapping a present and not giving it." -- William Arthur Ward
This research paper would not have been possible without the generous support of
many people. I would first like to thank my thesis advisor, Lei Lani Stelle, the leader of
the River Otter Project being conducted at RIT. Dr. Stelle’s enthusiasm and guidance
allowed for me to create and complete this significant project. Over the life cycle of my
project she provided wise advice, encouragement and lots of good ideas. I would also
like to express my sincere thank you to Dr. John Waud for his knowledge and insight in
water quality and Dr. Karl Korfmacher for his assistance with the GIS analysis.
In addition to my graduate committee members, I would like to express my
sincere thanks to many others within the RIT community. I am grateful to Gary
Neuderfer from the New York State Department of Environmental Conservation for
providing me with all of the necessary information and methods regarding the benthic
macroinvertebrates. Also Dr. David Mathiason for his quick and decisive input in the
statistical analysis of my project.
I am especially grateful to my river otter lab colleagues and all the staff of the RIT
Science Department assisting me as well as providing a fun and stimulating environment
in which to grow and learn. Barb McElween and Melissa Skyer deserve special mention,
without their help and cooperation with sharing information; my project would not have
been possible.
I cannot end without thanking my family, whose constant encouragement and
love I have relied on throughout my time at RIT. This wouldn’t have been possible
Introduction
:HISTORY AND BACKGROUND INFORMATION
The historic range of river otters (Lontra canadensis) in North America stretches from Alaska to Florida (Reid et al. 1994). River otters inhabit a diverse range of water
bodies, which includes freshwater lotic habitats (Reid et al. 1994). Since the mammal is
semi-aquatic, the otter requires specific habitat features that provide food, shelter, and
secluded areas (Prenda and Granado-Lorencio 1996). Diet requirements are almost
entirely aquatic whereas shelter, toilet sites, and resting areas are located on land (Reid et
al. 1994).
Despite the scarcity of natural predators and fatal diseases, river otters within
many regions of North America were extirpated by the early 1900’s due to human
intervention. Habitat loss through development of land, and the use of chemicals and
other water pollutants in their freshwater habitat has contributed to their decline (NYROP
1994; Kimber et al. 2000). Throughout much of Europe and North America, river otter
populations were once highly abundant. In many cases they were viewed as pest species
to local fisheries. Trapping for both the elimination of otters and fur harvesting was
viewed as one of the most important reasons for population declines in the European
otter, Lutra lutra (Mason and Macdonald 1993). Overall, human intervention has resulted in the destruction of integral habitat necessary for the river otter survival within North
America.
During the 1970’s there was an increased concern about otter declines in North
America. Improvements in furbearer management techniques and water quality
management agencies developed methods for restoring/enhancing otter populations
which included many different reintroduction programs. Within North America alone, 21
States and one Canadian Province have undertaken river otter reintroduction projects
(Pennsylvania Game Commission 2004). A better understanding of the interaction
between freshwater ecosystems and river otters could lead to establishment of new
populations. Because otters are heavily reliant on terrestrial and aquatic ecosystems,
changes such as the improvement in water quality, trapping regulations, and conservation
of otter habitat have been encouraging factors for re-establishment of otter populations
within New York (Pennsylvania Game Commission 2004). In 1996, New York State
adopted its own reintroduction program; the New York River Otter Project (NYROP).
The otter populations throughout western New York were naturally expanding, but the
NYSDEC felt it was necessary to increase the rate of recolonization. Therefore, all river
otters used within the reintroduction project were trapped from remnant otter populations
located within isolated areas of the Adirondacks and Catskill regions and were released to
nine areas deemed suitable by the NYDEC within western New York (NYROP 2004).
With help from numerous collaborators outside of the NYSDEC, the Seneca Park Zoo,
Cornell University, many local schools, and the general public, the NYROP successfully
reintroduced 279 river otters to western New York by the year 2000 (NYROP 2004).
DIET/HABITAT
River otters are known as opportunistic predators; their diets consist mainly of
fish and crustaceans (Blundell et al. 2002; Hanson 2003), but other prey includes reptiles,
amphibians, birds, aquatic insects, small mammals and mollusks (Berg 1999; Erlinge
resources and habitat. Lontra canadensis are known to forage in social groups in some habitats (Blundell et al. 2002), which in turn can impact their home ranges. Wetlands
and other regions with high levels of shoreline diversity tend to be favored by river otters
(Mason and MacDonald 1986). Some studies have established that otters have clear
preferences for specific substrates. For example, sections with riffles, large boulders
and/or with gravel are preferred over areas with sandy or muddy bottoms (Durbin 1993).
This could also be related to the type of prey species that inhabit these areas. Carss
(1990) found that otters were more successful and preferred to hunt/catch large salmon in
riffles as oppose to deeper water. Habitat selection appears to depend on available
vegetation and substrate types.
Anthropogenic activities such as agricultural practices, housing development and
angling have been known to interfere with otter inhabitance (Tuzun et al. 2005) limiting
their available habitat. In many cases, the habitat destruction and degradation includes
water development which alters stream flow and channel morphology, water pollution,
and the loss of important riparian vegetation (Boyle 2003).
Like the river otter, the European mink, Mustela lutreola has encountered declines as a result of anthropogenic pressures. A study completed in France shows that along
with suitable habitat, and food availability, poor water quality is one of three anthropic
habitat modifications that was critical for the European mink’s decline (Lode et al.
2001). Since both species are near the top of the food chain and are piscivorous animals,
WORK AT RIT
Since river otters are semi-aquatic and very elusive, a true understanding of
habitat selection is diverse. In order to generate an understanding of habitat preference,
spraint recovered gives us an idea of habitat usage. The research being conducted at
Rochester Institute of Technology (RIT) involves surveys along creek banks to search for
latrine sites, tracks, and other evidence of river otter presence. A latrine site is defined as
an area where otter spraint is found within one meter of other otter spraint (Kruuk et al.
1986). Other methods of studying river otter populations involve analyzing fur-harvest
data, interviews with local residents, using mark recapture techniques, and tracking river
otter locations with radio transmitters (Breaux et al. 2002). The NYROP surgically
implanted radio transmitters before releasing 28 of the otters to the Genesee River at
Letchworth State Park between 1996 and 2000. It was concluded that 21 of the 28 otters
demonstrated signs of establishing home ranges within the Genesee River and its
tributaries during the two years they were monitored (Spinola 2003). Otters have large
home ranges where the males tend to be larger than those of females. Depending on
location, some home ranges extend from 5 to 71km for males in The Rocky Mountain
National Park, and in Idaho they have ranged from 50 to 80km (Mack 1985; Melquist and
Dronkert 1987). The extent seems to depend on the size and shape of the individual
watershed.
My study used GIS as a tool to map otter sites with comparison to downloaded
roadways and collected water quality data. Benthic organisms (macro-invertebrates) and
some non-bioaccumulative organics have been collected as parameters of water quality.
respond to integrated stresses over time, which reflects fluctuating environmental
conditions(Bode et al. 2002). Community responses to various pollutants (e.g. organics)
may be assessed through interpretation of diversity, known organism tolerances, and in
some cases, relative abundances and feeding types.
In total, 31 river otters were released in 1998 into Black Creek and Honeoye
Creek near the Genesee River within Monroe County, New York (Bruce Penrod, personal
communication, 2006). Since the release, no coordinated effort has been conducted to
analyze the status of the river otter populations within Monroe County. The success of
the reintroduction program within this region is unknown, thus integrating water quality
data with a study of otter distribution patterns and habitat selection would be very useful.
PROJECT GOALS
The purpose of my research is identify otter distribution patterns within Monrow
county through the use of Geographical Information Systems(GIS) and special variables.
GIS was used to help identify otter distribution patterns from Geographical Positioning
Systems (GPS) used to mark latrine sites and other characteristic markings of otter
activity, such as tracks or slides. Water quality data obtained through chemistry and
macroinvertebrate collection has allowed for comparisons to be made. Digital analysis of
environmental features within the study area such as land use/land cover will be obtained
using this technique. Ultimately this method of mapping otter activity will improve otter
research since it will allow for a better analysis of otter population distributions and
Comparisons can be drawn between inhabited versus non-inhabited creeks or
areas along the same creeks, which have similar characteristics outside of water quality.
This approach has enabled me to help answer the question of whether or not the water
quality data that I have collected plays a role in habitat selection by the river otters. It
was expected that otters would avoid human conflict and areas or creeks with poor
quality water. The GIS was used to visualize and map these regions which provide the
best otter habitat based on these two parameters.
The conservation and restoration of native species requires an understanding of
their environment. Determining whether or not populations become established and what
types of habitat they inhabit is an important aspect of reintroduction projects (IUCN
1998). An analysis of factors contributing to habitat selection will allow for a better
understanding of distribution patterns of Lontra canadensis reintroduced into Monroe County, New York, and planning for future reintroduction projects.
Materials/Methods
:The banks of Honeoye Creek, Black Creek, and Oatka Creek in Monroe County
have been scanned for otter latrine sites since January 2001. We search the banks of the
three creeks looking for river otter spraint and any other otter signs, such as slides or
tracks. Surveys are via canoe during the warmer months from May to November to gain
access to both bank sides. Accessible sites were chosen randomly on each bank side, and
were scanned for latrine sites approximately 20 meters in both directions. During the rest
of the year due to inclement weather, surveys were conducted on foot, where researchers
To maintain consistency in the data, each creek was visited in succession and we
tried to survey each of the three creeks once per week. From 2005 to 2007, sites that
have been deemed potential latrine areas and are accessible by foot and canoe have been
mapped as the areas visited. At each potential latrine site, many different environmental
variables are recorded: bank slope, vegetation cover, water current, and signs of human
disturbance (e.g. roads, houses, near by garbage). These will potentially allow for
comparisons to be drawn between sites with otter activity, as opposed to those without.
Comparisons can also be made between those areas with similar environmental
characteristics.
We collect spraint samples for diet analysis and genetic testing for studies
currently being conducted by other researchers. Half of each spraint sample is collected
at the latrine site, since otters are known to use latrine sites frequently (Kruuk et. al
1986), this method allows for minimal disturbance and remnants of spraint ill still be
present. The position of each latrine site is recorded using Garmin Global Positioning
System (GPS) Etrex Vista units and later entered into the compatible software of
Environmental Systems Research Institute Inc. (ESRI) geographic information systems
(GIS) computer software ArcGIS 9.
To be classified as a latrine site, it needs to contain at least one spraint sample; if
there are other indicators, such as slides or tracks which could be identified using field
guides, an area is considered possible otter habitat. If multiple spraint samples were
found within 5 meters of each other, the spraint samples were marked as the same latrine
away was classified as a different latrine site and was marked with as a distinct point in
the GPS database.
In order to analyze the locations marked by the GPS units, the data were entered
into ArcGIS 9.0. The points were saved as DBF 4 (dBase IV) files using Microsoft
Excel. The locations were then loaded into ArcGIS with a geographic reference using the
North American Datum (GCS, NAD) 1983. Cornel University GeoSpatial Repository
(CUGIR) was used to download the Monroe County 2002 hydrography census map and
the road data information (GCS, NAD 1983) and was added as a layer. 2002 Land Use
Land Cover (LULC) data files were downloaded to provide information about the land
use surrounding the study area within Monroe County.
Within the three creeks, ten different sites were chosen for the chemistry
collection (Figure 1). These ten locations are based on previous sampling done by the
Figure 1: Macroinvertebrate and water chemistry sites within the three creeks. The three macroinvertebrate sites were chosen based on wadeable areas located within my study area. The 10 water chemistry sites were originally chosen based on otter latrine sites and potential latrine sites, but with further analysis they were not all confirmed otter spraint sites (McIlween, 2006).
Originally, five of the sites were classified as areas that otters most frequently
used as latrine sites and the remaining five were sites that otter sign has not been found,
the characteristics of otter latrine sites such as relatively low banks, good vegetative
cover (ground and canopy), and low human disturbance. After further genetic and diet
analysis, the original believed otter sites were not all confirmed as river otter spraint.
Based on genetic confirmation and spraint contents, otter latrine sites were identified and
mapped (Figure 2). Without genetic identification, the spraint was classified as otter if
fish scales or crayfish remains were recovered from the spraint. If berries, corn or other
vegetative remains were found in the spraint without the presence of fish scales or
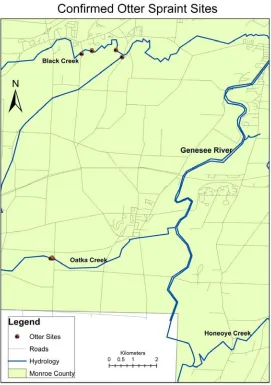
Figure 2: Confirmed otter latrine sites. There were 14 confirmed otter latrine sites based on DNA and spraint species analysis; 10 were located on Black Creek and 4 on Oatka Creek
Water chemistry data was collected once a week for all ten sites per creek
(Appendix E) from June to August, 2006. Invertebrates were collected between June 1st
and June 10th and once more between August 13th and August 19th in 2006, at each of the
three sites per creek (Appendix A). According to Bode et al. (2002), the spring and fall
are the best times for collecting and identifying macroinvertebrates based on life cycles.
habitat for invertebrate collection. These sites are spread out over our study area (Figure
1).
In terms of water quality measurements, dissolved oxygen (DO), phosphates, and
nitrates were measured using an EPA approved Thomas Scientific AccuVac test kits.
The DO was calculated using the dissolved oxygen reagent set method 8166 (HRDO
Method) with a range of 0-15mg/L O2. Phosphorous was calculated using the PhosVer 3
(Ascorbic acid) method 8048 (Orthophosphate Method) with a range of 0.02 to 2.50
mg/L PO43-. The nitrates were calculated using Cadmium Reduction Method Method
8171 with a range of 0.1 to 10.0 mg/L NO3--N. Water temperature and pH were
measured using a Beckman 410 series pH Meter, which had an accuracy of ±0.01 for the
pH and ±0.5°C for temperature.
For the statistical analysis of the water chemistry, Mintab 14 was used to analyze
the data. A general linear model (GLM) was used to compare sites within each creek,
and the overall differences between the three creeks for all the measured chemistry data.
For these tests, if the p-value is greater than 0.05, then the null hypothesis was accepted
and it was classified as insignificant, and for anything below 0.05 the null was rejected
and a significant difference was noted.
Land Use/Land Cover information for the areas surrounding the latrine sites was
downloaded from the USGS website. ArcGIS was used to project the LULC data from
Albersus into UTM Zone 18, NAD83 and then exported as a Geotiff. Once exported, the
Geotiff was then imported into Idrisi. Each creek was digitized and a 30 by 30 meter
buffer was used at each latrine site. Information regarding the LULC is displayed in
Macroinvertebrates were collected following the protocol of the Quality
Assurance Work Plan for Biological Stream Monitoring in New York State (Bode et. al
2002). The traveling kick sample was used to collect the benthic organisms from the
creeks. This method is performed by disturbing the bottom sediments upstream and
catching the dislodged organisms in the standard D-frame dip net held downstream.
Sampling was performed for 5 minutes gradually moving over a 5 meter diagonal transect
of the stream. The net contents were then emptied into a pan and specimens collected
were preserved in the field using 75% ethanol.
The macroinvertebrates collected were later identified to the genus level using
Peckarsky (1990) with the aid of a 10-40x dissecting stereoscope. These values were
used for various biological models (Appendix A) to address the water quality impact
according to the Quality Assurance Work Plan for Biological Stream Monitoring (Bode
et. Al 2002). The models were incorporated using a biological index profile which uses
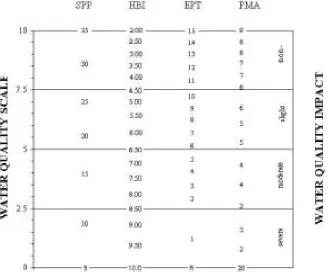
Figure 3: The water quality impact values based on the 0-10 scale created by using the Species Richness (SPP), Hilsonhoff Biotic Index (HBI), EPT Richness, and Percent Model Affinity (PMA) models (Bode et al. 2002).
The four metrics used are (1)Species richness based on the total number of species
present, (2)EPT richness which calculates index based on number of Ephemeroptera
(stoneflies), Plecoptera (mayflies), and Trichoptera (caddisflies) present, (3) Hilsenhoff Biotic Index using individual species tolerance levels, and (4)Percent Model Affinity
(PMA) which compares similarity to a non-impacted model. The values from these tests
were then placed on a scale from 0-10 which provided a single water quality index for
Results
:Sprainting Activity
Within the study area, confirmed otter spraint was located at two of the three
creeks (Table 1). These confirmations were based on diet found within the spraint (i.e.
fish scales and/or crayfish) and DNA identification. Black Creek contained 10 identified
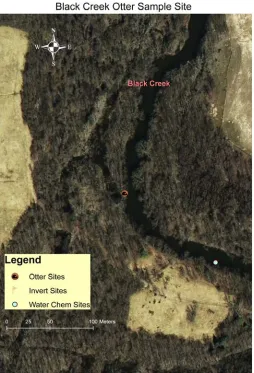
otter spraints distributed over 5 different sites. Figure 4 shows one of the more frequently
visited sites in relation to water quality and invertebrate sampling sites. Oatka Creek had
4 confirmed otter spraints, all located within 105 meters of one another (Figure 3). Using
the general linear model, a p-value of 0.685 was calculated revealing no significant
.
Figure 4: Black Creek sample site showing confirmed otter site, invert site and water chemistry site as a layer on an aerial photo.
Table 1: The number of surveys completed on the three creeks and the total number of confirmed otter spraint recovered from those creeks.
# of times surveyed Confirmed Spraint Recovered
Black Creek 72 10
Honeoye Creek 56 0
[image:21.612.106.509.600.675.2]Water Chemistry
Based on the general linear model, there was no significant difference in any of
the water quality measurements between sites within each creek. As a result, all
chemistry data comparisons were made between creeks, rather than different sites within
each creek. Since there was no difference between seasons statistical tests were then
[image:22.612.83.529.291.354.2]based on the averages for the two collections periods in the spring and fall (Table 2).
Table 2: The following chart displays the averages of the fall and spring data collected in the three creeks in 2006.
Creek DO(mg/l) Temp(°C)
Nitrate(NO3-) (mg/L)
Phos(PO4-3) (mg/L) pH
Honeoye 9.09 *20.10 *1.58 *0.37 8.00
Black 9.18 18.86 1.00 0.20 8.07
Oatka *9.99 16.15 1.33 0.22 *7.92
Dissolved Oxygen was significantly different between creeks with a p-value of 0.00;
Oatka Creek differs from Honeoye and Black, but Honeoye and Black are not different
from each other. Nitrates (NO3-N) were significantly different between creeks with a
p-value of 0.035; Oatka was not significantly different than Black Creek or Honeoye, but
Honeoye is significantly higher than Black Creek. The phosphorous (PO4-3) was
significantly different between creeks with a p-value of 0.00; Black and Oatka Creeks
were significantly lower than Honeoye, but did not differ from each other. For the pH
there was a significant difference between creeks with a p-value of 0.00. Black Creek
Benthic Macroinvertebrates
The three studied creeks were ranked based on the four benthic macroinvertebrate
water quality indices (Table 3). For these measurements the values were calculated and
placed on a 0-10 scale which ranks them according to a water quality impact level. For
example, the average of the four water quality indices for Honeoye was 5.51 on the water
[image:24.612.147.465.278.340.2]quality scale which ranks it as slightly impacted on the water quality scale (Figure 3).
Table 3: Water quality impact of the three creeks
Creek Average Classification
Honeoye 5.51 Slightly Impacted
Black 4.59 Moderately Impacted
Oatka 7.10 Slightly impacted
After using a general linear regression model, there was no significant difference
between any of the measured indices between sites at any of the creeks (P-values all
measured greater than 0.05). Therefore the water quality based on benthic
macroinvertebrates is calculated between creeks.
Table 4: Macroinvertebrate indices for the three creeks
Creek SPP EPT HBI PMA
Honeoye 4.56 8.80 6.61 2.07
Black 3.09 7.61 6.35 1.29
Oatka 1.82 10.00 *8.87 *7.69
Since there was no difference between the spring and fall seasons for any of the
creeks, all comparison were made based on averages of the two seasons. Table 4 shows
[image:24.612.84.527.528.581.2]of 0.553. For the EPT richness, again there was no significant difference between any of
the creeks (p = 0.375). HBI showed a significant difference between creeks (p=0.00).
Black and Honeoye Creeks differ from Oatka, but not from one another. PMA is
significantly different between creeks (p= 0.00). Black and Honeoye Creeks are
significantly lower than Oatka, but not from each other.
Land Use/ Land Cover
Land use and land cover was used to display and determine what major types of
land use were associated within the study area. The LULC was completed for a thirty
meter buffer surrounding the study area within all three creeks (appendix D). Because
riparian vegetation has been identified as one key aspect to river otter habitat selection
(Prenda and Granado 1996), the thirty meter buffer would ensure that the area
surrounding the banks of the creeks was included. Since there were numerous LULC
classifications, only those classifications that made up greater than 10% of the buffer
were used. Table 5 shows the major three LULC types found within the three creeks and
their percentages. Within these top three, it is important to make note that none of them
contain any form of residential or some type of development. In fact, Black Creek is the
only one of the three creeks that has any form of development classified through the
Table 5: The three greatest LULC within the three creeks including there percentage of the 30 by 30m buffer.
Discussion:
This analysis explores some parameters that may influence river otter habitat
selection. The overall objective was to determine whether or not water quality itself was a
factor for selection. After addressing the biological indicators and chemical properties of
the three creeks there was not a clear-cut correlation between water quality and the
presence of river otters.
HONEOYE CREEK
Even though the New York River Otter Project released river otters into Honeoye
Creek in 1994, after 56 creek visits no confirmed otter sites were identified. Of the
three creeks within the Monroe County study area, it was the only creek with no
confirmed sites. Even though it was the least popular creek in terms of the number of
visitations, there was no significant difference (p = 0.245) between the number of times
each creek was visited, thus it is unlikely that the lack of otter detection was due to less
survey effort but instead reflects an avoidance of the creek by river otters.
Using the biological water quality models (Appendix A), Honeoye Creek was
ranked at 5.51 and is considered to be slightly impacted. Ranked in the same category as
Oatka Creek, overall water quality does not seem to be the determining factor as to otter Category Oatka Creek Black Creek Honeoye Creek
Woody Wetlands 25.3% 33.3% --
Mixed Forest 30.6% -- 19.6%
Deciduous Forest 16.1% 13.5% 20.7%
inhabitance. If you look at the chemistry of the creek itself, there are some significant
differences from the other two creeks though. The nitrates measured in Honeoye are
significantly higher than from those of Oatka Creek, and the phosphorous levels are also
significantly higher than both Oatka and Black Creek. The presence of high levels of
both nitrates (N) and phosphorous (P) might be a contributing factor as to a lack of otter
use within Honeoye Creek. Skyer (2006) showed that all three creeks studied provided
sufficient prey species for otter survival, so the high N and P levels do not appear to
impact available prey.
Since very little genetic work, other than that being conducted at RIT, has been
completed on the river otter populations within New York, it would be interesting to
determine whether or not the otter populations are declining, or whether they are
migrating elsewhere. It is interesting to note that the release site (Figure 6) was very
close to the Genesee River, and the otters may have used this as a corridor to relocate
Figure 6: Department of Environmental Conservation River otter release site on Honeoye Creek.
We are currently looking to expanding our research area within the Honeoye
creek basin. Otter tracks and word from local fishermen suggest that otters might still be
using the creek. As it stands, Honeoye might possess other factors that could deter otters
from using this creek. Further research and confirmation of sites will address these
issues.
BLACK CREEK
Of the three creeks used in this study, Black Creek had the largest number of
confirmed otter spraint sites. There were ten confirmed (Figure 1), and they were spread
out over 4 different sampling sites. Although Black Creek was visited the most of the
three creeks, there was no significant difference in visitations between creeks so that
would not account for the greater number of confirmed sites. The sites themselves were HoneoyeCreek
Genesee River
all located within two kilometers of each other (figure1), and each site had more than one
otter spraint collected over the study period. Since home ranges of otters are much
greater than two kilometers and no DNA work has been completed to determine whether
or not different otters have visited these sites, it is not known whether or not the spraint is
a result of more than one otter.
Black Creek was one of the release sites for the NYROP and was viewed as
suitable habitat for otter survival (NYROP 2000). Based on the data that I have collected,
no immediate trends can be linked between water quality and river otter inhabitance. It
could be that the otters have adequate living conditions to continue living in Black Creek,
and it is not necessary to migrate. It is inconclusive whether or not water quality is in fact
a determining factor for otter presence and more work needs to be completed to try and
determine what characteristics influence their presence.
OATKA CREEK
After incorporating the genetics work and diet analysis, there were four confirmed
otter spraint collected. The spraint samples were all recovered within 105 meters of one
another at different points in time, suggesting that this is a preferred otter spraint site.
Since the spraint collected from Oatka were greater than 5 meters apart and located on
different sides of the creek, these were distinguished as four discrete latrine sites.
From the water quality analysis, Oatka creek ranked the highest in terms of the
water quality models at 7.10 and is considered slightly impacted. Chemistry data
showed that nitrates and phosphorous levels are not significantly different from Black
the water chemistry itself is the significantly higher dissolved oxygen levels within Oatka
creek. The average DO levels in Oatka were 9.99mg/L, and these levels suggest
numerous properties that can be associated with the creek. The first obvious
characteristic was the temperature of the water having a significant difference from the
others creeks with an average of 16.1oC. At lower temperatures the water holds more
dissolved oxygen and certain species of fish can only survive within particular levels of
thermal and dissolved oxygen (DO) environments. According to the NYSDEC, Oatka
creek is stocked with brown trout because it is suitable habitat for their survival
(NYSDEC 2007). Elliott (1976) showed that temperature requirements for the
maintenance and optimum energy intake for brown trout range from 3.8-19.5oC. Since
Oatka Creek is cooler in temperature and has sufficient DO levels (Appendix B), it is
suitable habitat for the trout to survive. Thompson and Stelle (in review) demonstrated
that captive river otters prefer Brown Trout over other prey species including sunfish and
crayfish. The otters’ preference is explained by optimal foraging theory, since trout
provide the greatest energetic gain after accounting for caloric content and metabolic
costs associated with chasing and handling each prey. This suggests that the river otters
may have dispersed to Oatka Creek for the food source present. Dubuc (1990) found that
the most important factor that determined river otter habitat was food availability.
Therefore based on the water chemistry data, DO and temperature could be indirectly
influencing river otter habitat selection. Since Oatka Creek offers suitable habitat for a
preferred prey species for river otters, reasons for otter use here could be different from
those of Black Creek.
Prior to completing the project, it was assumed that there would have been a large
enough difference between the three creeks to be able to draw solid conclusions based on
the differences between land use and water quality. Unfortunately, after collecting the
data and completing the statistical analysis there was not significant enough differences
to compare required habitat for the river otters. Based on water quality, the difference
was minimal and none of the creeks were actually listed as being severe or even highly
impacted. Given that the creeks themselves varied in some degree, river otters may
simply have a tolerable range in which they can survive. Since there have been otter
sightings and/or evidence of otters within the three creeks, ultimately it might just be that
the creeks within the Monroe County study area, are tolerable in terms of water quality
for otter inhabitance.
According to Prenda (1996) and Hanson (2003), otters require three habitat
features that are necessary for survival; food, shelter, and secluded areas (Prenda et.al
1996; Hanson 2003). Skyer ( 2007) showed that the prey resources within our three
studied creeks were in abundance to support otter dietary needs, so food availability was
not a limiting factor. After addressing the land use of the study area with GIS through the
LULC, there seem to be sufficient riparian vegetation throughout the three creeks that
provide necessary secluded areas. In a 30 meter buffer surrounding the study area,
woody wetlands, mixed forest, or deciduous forest made up the majority of the land use.
Only one of the creeks showed that development of any sort was greater than 10%, and
even still, it was developed open space (Appendix D). A study completed in the
Humboldt River watershed in Nevada shows that the otters only occupied remnant areas
creeks and the use of LULC data, the results show that there could very well be sufficient
water course quality, and cover through vegetation.
The third parameter necessary for otter habitat is suitable den sites. This would be
a good project in the future to incorporate all three parameters river otters require.
Although no work has been completed thus far in terms of potential den sites, according
to Hanson (2003), sign of beaver activity is a great sign that otters could be present.
Numerous signs of beaver presence have been observed within the study area so this
could provide one source of den sites. Since watersheds can be altered by beaver
activity, beavers provide excellent habitat for otters (Hanson 2003). Both species require
very similar habitat, they also provide den sites through abandoned beaver lodges.
According to Kiesow (2006), river otters use two types of lodges along river banks,
beaver lodges and bank dens. The watersheds of Monroe County appear to provide the
three key habitat requirements necessary for river otter survival.
LIMITATIONS
There were several limitations within this project that may have affected the
outcome. Although the river otter lab at RIT has been conducting work with the river
otters within Monroe County for three years, including research efforts focusing on
genetics and diet analysis, there have been challenges. With very little difference in the
initial identification of the spraint, raccoon and otter can be difficult to differentiate. As a
result, much of the spraint we collected, some of which was originally believed to be
otter, has turned out as raccoon. Without concurrently investigating genetics and diet, it
With more spraint analysis, we will be able to determine larger numbers of confirmed
sites and draw more accurate conclusions as to otter habitat surrounding these sites.
A second limitation is the total area covered in our research efforts. It is
important to consider that otter home ranges can vary vastly. Our study area only
included a few accessible kilometers within some of the creeks. Since home ranges can
be up to 70 miles, the study area might not be sufficient enough for conclusive
comparison to be made between habitat preference and otter presence.
The third restriction was the length of time the experiment covered. Since the
project began in the summer of 2006, two seasons worth of data collection might not
have been the sufficient to address the project goals. Although the analysis of
macroinvertebrates addresses the water quality over time, more water chemistry
collection would have provided a more reliable view of the actual chemical properties of
the creeks.
FUTURE WORK
Several steps can be taken to further investigate this project. Since there have
only been 14 confirmed collections of otter spraint to date, future work is necessary in
order to create a solid understanding of otter habitat selection. With a greater number of
site visits and collection, it will allow or a much better analysis of the river otter habitat
selection.
With more field work being completed, there should be a greater number of
confirmed otter sites. With a better understanding of preferred latrine sites, the
the project can be extended and made more site specific. Toilet sites can be used as the
primary study area and common characteristics can be determined for site selection.
Once common latrine sites have been established you can narrow the focus on more
specific characteristics of these areas.
Additionally, more chemical collection could be done to determine what types of
contaminants are present. Since there have only been 14 total confirmations of river otter
activity, there could be other water chemistry properties that are limiting otter
inhabitance. For example, many other studies have looked at mercury, and
polychlorinated biphenyls as limiting factors to otter and other related species, such as
mink survival (Harding et. al 1999; Kimber and Kollias 2000; Lode et. al 2001; Mason
and MacDonald 1986). Taking a look at the presence of PCB’s within the water column
would allow for a better analysis as to whether or not they play a part in habitat selection.
Since dens are the third key factor listed as habitat necessities for otter survival
(Hanson 2003), work completed in identification of den sites would be particularly
helpful. It is assumed that with sufficient riparian vegetation and beaver activity that lack
of den availabilities is not an issue, it still needs to be addressed. In saying this, a larger
buffer could be used for the LULC within the researched area to determine whether or not
development is inhibiting den availability.
The completion of the suggested future work will provide more accurate results
and should allow for a better understanding of river otter habitat selection. More
References
Berg, J. K. 1999. Final report of the river otter research project on the Upper Colorado River Basin in and adjacent to Rocky Mountain National Park, CO. National Park Service: Rocky Mountain National Park, CO.
Blundell, G, Ben-David, M, and R. Bowyer. 2002. Sociality in river otter: cooperative foraging or reproductive strategies. Behavioral Ecology 13 (1): 134 – 141. Bode, R, Novak, M, Abele, L, Heitzman, D, and A. Smith. 2002. Quality assurance
workplan for biological stream monitoring in New York State. NYSDEC, Albany, New York.
Boyle, S. (2006, September 2). North American River Otter (Lontra canadensis): a technical conservation assessment. USDA Forest Service, Rocky Mountain Region.
Breaux, A, Zielinski, W, and T. Kucera. 2002. Data collection protocol: monitoring river otter (Lutra canadensis). Wetlands Regional Monitoring Program Plan. Carss, D., Kruuk, H., and J. Conroy. 1990. Predation on adult Atlantic Salmon by otters
Lutra lutra within the River Dee system, Aberdeenshire, Scotland. Journal of Fish Biology, 37: 935-944.
Copp, G, and K. Roche. 2003. Range and diet of eurasion otters (Lutra lutra) in the catchment of the River Lee (south-east England) since reintroduction. Aquatic Conservation: Marine and Freshwater Ecosystems 13: 65 – 76.
Dubuc, L, William, K, and R. Owen Jr. 1990. Predicting occurrence of river otters by habitat on Mount Desert Island, Maine. Journal of Wildlife Management 54 (4): 594 – 599.
Durbin, L. 1993. Food and habitat utilization of otters (lutra lutra) in a riparian habitat-the River Don in north-east Scotland. PhD thesis, University of Aberdeen. Elliott, J. 1976. The energetics of feeding, metabolism and growth of Brown Trout
(Salmo trutta) in relation to body weight, water temperature and ration size. The Journal of Animal Ecology. 45 (3): 923-948.
Erlinge, S. 1968. Food studies on captive otters Lutra lutra. Oikos 19: 259-270.
Hanson, H. 2003. Food habits of North American river otters (Lontra canadensis). The River Otter Journal. 12 (2): 1-5.
Harding, L, Harris, M, Stephen, C, and J. Elliott. 1999. Reproductive and
canadensis) in relation to chlorinated hydrocarbon contamination. Environmental Health Perspective 107 (2): 141 – 147.
Hunt, J. 1986. Mink Assessment. Maine Department of Inland Fisheries and Wildlife. Bangor, Maine.
International Union for the Conservation of Nature and Natural Resources (IUCN). 1998. IUCN guidelines for reintroductions. Cambridge, United Kingdom.
Kiesow, A. 2006. River Otter in South Dakota. Wildlife Diversity Program.
.(Accessed May 30, 2007).
Kimber, K, and G. Kollias. 2000. Infectious and parasitic diseases and contaminant-related problems of North American river otters (Lontra canadensis): a review.
Journal of Zoo and Wildlife Medicine 31 (4): 452 – 472.
Knudsen, G, and J. Hale. 1968. Food habits of otters in the Great Lakes region. Journal of Wildlife Management 32 (1): 89 – 93.
Kruuk, H, Conroy, J, Glimmerveen, U, and E. Ouwerkerk. 1986. The use of spraints to survey populations of otters (Lutra lutra). Biological Conservation 35: 187 – 194.
Lode, T, Cormier, J, and D. LeJacques. 2001. Decline in endangered species as an indication of anthropic pressures: the case of European mink, Mustela lutreola
Western populations. Environmental Sciences and Pollution Management
28(6):727 – 735.
Mason, C, and S. Macdonald. 1986. Otters, conservation and ecology. Cambridge University Press.
Mason, C, and S. Macdonald. 1993. Impact of organochlorine residues and PCB’s on otter’s in East England. The Science of the Total Environment 138: 147 – 160. Melquist, W, and A. Dronkert. 1987. River Otter. Wild fur bearer management and
conservation in North America. Ministry of Natural Resources of Ontario.
New York River Otter Project (NYROP). 2000.
New York State Department of Environmental Conservation. 2007. Trout Stocked
Creeks with Eastern New York.
(accessed May 26, 2007).
Pennsylvania Game Commission. 2004. Distribution and abundance of river otters in the Allegheny River drainage.
November 2, 2005).
Pfieffer, P, and B. Culik. 1998. Energy metabolism of underwater swimming. Journal of Comparison Physiology 168: 143 – 148.
Prenda, J, and C. Granado-Lorencio. 1996. The relative influence of riparian habitat structure and fish availability on otter, Lutra lutra, sprainting activity in a small Mediterranean catchment. Biological Conservation 76: 9 – 15.
Raesly, E. 2001. Progress and status of river otter reintroduction projects in the United States. Environmental Sciences and Pollution Management 29 (3): 856 – 862. Reid, D, Code, T, Reid, A, and S. Herrero. 1994. Spacing, movement and habitat
selection of the river otter in boreal Alberta. Canadian Journal of Zoology 72: 1314 – 1324.
Route, W.T. and R.O. Peterson. 1988. Distribution and abundance of river otter in Voyageurs National Park, Minnesota. U.S. Department of the Interior, National Park Service, Research/Resources Management Report MWR-10. Midwest Regional Office, Omaha, Nebraska. 62 pp.
Shackelford, J, and J. Whitaker. 1997. Relative abundance of the northern river otter,
Lutra canadensis, in three drainage basins of southeastern Oklahoma.
Proclamation of Oklahoma Academy of Science 77: 93 – 98.
Skyer, Melissa “Food habits of a Reintroduced River Otter (Lontra canadensis) Population in Western New York”, M.S. thesis, Rochester Institute of Technology.
Spinola, R. 1993. Spatio-temporal ecology of river otter translocated to western New York. Pennsylvania State University, College of Agricultural Sciences.
Swimly, T, Serfass, T, Brooks, R, and W. Tzilkowski. 1998. Predicting river otter latrine sits in Pennsylvania. Wildlife Society Bulletin 26 (4): 836 – 845.
Thompson, L. and Stelle, L.L.(accepted, pending revision) “Prey preference of the North American River Otter (Lontra canadensis) matches predictions of optimal
foraging theory”.
APPENDIX A
:Macroinvertebrate Calculations and values
NOTE: The following information regarding the types of indices and what they are measures of comes directly from the Quality assurance Work Plan for Biological Stream Monitoring in New York State (Bode et al. 2002).
1.
Species Richness:
This is the total number of species or taxa found in the sample. Higher species richness values are mostly associated with clean-water conditions.Species per creek
Creek Number of Taxa
Honeoye 17
Black 12
Oatka 9
Average per site at each creek
Creek Site 1 Site 2 Site 3
Honeoye 9.5 8.5 7
Black 8 7.5 6.5
Oatka 6.5 7.5 7.5
Calculations:
SPECIES RICHNESS
SPP>35 replace with 10
SPP>26 replace with (((SPP-26)/9)*2.5)+7.5 SPP>18 replace with (((SPP-18)/8.5)*2.5)+5 SPP>10 replace with (((SPP-10)/8.5)*2.5)+2.5 SPP<5 replace with 0
SPP<11 replace with ((SPP-5)/5.5)*2.5
Average for each creek
Creek SPP
Honeoye 4.55882
Black 3.08824
Oatka 1.81818
Average SPP for each site within each creek
Creek Site 1 Site 2 Site 3
Honeoye 2.05 1.59 0.91
Black 1.36 1.14 0.68
Oatka 0.68 1.14 1.14
100-organism subsample. These are considered to be mostly clean-water 100-organisms, and their presence generally is correlated with good water quality.
EPT for average between creeks
Creek Ephemeroptera Plecoptera Trichoptera Total
Honeoye 1.83521 0.66666 7.878404 12.60
Black 0 3.00 7.21 10.21
Oatka 35.32 8.81 29.23 73.36
EPT for each site per Creek
Honeoye Creek Ephemeroptera Plecoptera Trichoptera Total
Site 1 5.5 0.0 1.0 17.0
Site 2 0.5 0.0 11.0 12.3
Site 3 0.0 1.0 12.0 13.0
Black Creek Ephemeroptera Plecoptera Trichoptera Total
Site 1 0.0 8.0 5.5 13.5
Site 2 0.0 1.0 8.0 9.0
Site 3 0.0 1.0 10.0 11.0
Oatka Creek Ephemeroptera Plecoptera Trichoptera Total
Site 1 40.5 5.5 12.5 58.5
Site 2 34.0 11.0 35.5 80.5
Site 3 24.5 7.5 31.0 81.1
Calculations:
EPT RICHNESS
EPT>15 replace with 10
EPT>10 replace with (((EPT-10)/5)*2.5)+7.5 EPT>5 replace with (((EPT-5)/5.5)*2.5)+5 EPT>1 replace with (((EPT-1)/4.5)*2.5)+2.5 if EPT = 1 replace with 1.25
if EPT = 0 replace with 0
EPT per creek
Creek EPT
Honeoye 8.80
Black 7.61
Oatka 10.00
EPT for each site per creek
Creek Site 1 Site 2 Site 3
Honeoye 10.00 8.65 9.00
Black 9.25 6.82 8.00
3.
Biotic Index:
The Hilsenhoff Biotic Index is calculated by multiplying the number of individuals of each species by its assigned tolerance value, summing these products, and dividing by the total number of individuals. On a 0-10 scale, tolerance values range from intolerant (0) to tolerant (10). Tolerance values, listed in the species list, are mostly from Hilsenhoff (1987). High HBI values are indicative of organic (sewage) pollution, while low values indicate lack of sewage effects.Creek SITE 1 SITE 2 SITE 3 Average
Honeoye 5.16 5.21 5.25 5.21
Black 5.19 5.61 5.45 5.42
Oatka 3.31 3.19 2.90 3.13
Calculations:
HILSENHOFF BIOTIC INDEX
HBI <2 replace with 10
HBI <4.51 replace with 10-(HBI-2)
HBI <6.51 replace with 7.5-(((HBI-4.5)/2)*2.5) HBI <8.51 replace with 5-(((HBI-6.5)/2)*2.5) HBI >8.50 replace with 2.5-(((HBI-8.5)/1.5)*2.5)
Average HBI for each creek
Creek HBI
Honeoye 6.61
Black 6.35
Oatka 8.87
HBI for each site within each creek
Creek Site 1 Site 2 Site 3
Honeoye 6.68 6.61 6.56
Black 6.64 6.11 6.31
Oatka 8.69 8.81 9.10
4.
Percent Model Affinity:
This is a measure of similarity to a model non-impacted community based on percent abundance in 7 major groups (Novak and Bode, 1992). Percentage similarity as calculated in Washington (1984) is used to measure similarity to a kick sample community of 40% Ephemeroptera, 5% Plecoptera, 10% Trichoptera, 10% Coleoptera, 20% Chironomidae, 5% Oligochaeta, and 10% Other.Creek SITE 1 SITE 2 SITE 3 Average
Spring Fall Spring Fall Spring Fall
Honeoye 37 28 32 35 28 32 32
Black 30 29 23 32 32 19 27.5
Oatka 73 75 66 65 53 64 66
PERCENT MODEL AFFINITY
PMA >90 replace with 10
PMA >64 replace with (((PMA-64)/26)*2.5)+7.5 PMA >49 replace with (((PMA-49)/15.5)*2.5)+5 PMA >34 replace with (((PMA-34)/15.5)*2.5)+2.5 PMA <20 replace with 0
PMA <35 replace with ((PMA-20)/14.5)*2.5
PMA for each Creek
Creek PMA
Honeoye 2.07
Black 1.29
Oatka 7.69
PMA for each site within each creek
Creek Site 1 Site 2 Site 3
Honeoye 2.16 2.33 1.72
Black 1.64 1.29 0.95
Oatka 8.46 7.64 6.97
Water Quality based on the Appendix V. Biological Assessment Profile of Index Values for Riffle Habitats
Creek Average Classification
Honeoye 5.51 Slightly Impacted
Black 4.59 Moderately Impacted
APPENDIX B:
Summary of Results
Summary of averages with significant differences* Represents a significant difference from the other two creeks $ Represents a significant difference from Black Creek # represents a significant difference from Honeoye Creek %represents a significance difference from Oatka Creek
Oatka Black Honeoye
DO(mg/L) *9.99 9.18 9.09
Temp *16.15 #18.86 20.10
pH 7.92 *8.07 8.00
Nitrates 1.33 1.00 %1.58
Phosphorous 0.22 0.20 *0.37
Quality 7.10 (Slightly impacted) 4.59 (Moderately
Impacted)
5.51 (Slightly Impacted)
EPT 10.00 7.61 8.80
HBI *8.87 6.35 6.61
PMA *7.69 1.29 2.07
APPENDIX C: Macroinvertebrate Data
Macroinvertebrate community composition: Macroinvertebrates were collected at three different sites within Oatka, Honeoye and Black Creek. The inverts were classified to the genus level and were used in various water quality models. The following table displays the types and numbers found at each site in the spring and fall combined.
Common Name Genus Honeoye Creek Black Creek Oatka Creek
Site 1 Site 2 Site 3 Site 1 Site 2 Site 3 Site 1 Site 2 Site 3
Scud Gammarus 83 74 82 122 127 118 43 22 15
Mayfly Ephemerella 8 1 0 0 0 0 81 68 49
Mayfly Stenonema 3 0 0 0 0 0 0 0 0
Stonefly Agnetina 0 0 2 0 0 0 11 22 15
Stonefly Perlesta 0 0 0 1 0 0 0 0 0
Stonefly Acroneuria 2 0 0 15 2 2 0 0 0
Caddis fly Hydropsyche 21 22 24 11 16 30 25 59 41
Caddis fly Hydroptila 0 0 0 0 0 0 0 12 21
Riffle beetle Stenelmis 25 29 37 17 25 27 36 13 14
Water penny Psephenus 8 34 30 2 0 3 0 0 0
Alderfly larva Sialis 0 0 0 0 0 0 0 0 1
Hellgrammite Nigronia 7 0 0 18 6 3 0 0 0
Fingernail clam Musculium 19 11 13 7 10 10 0 0 0
Fingernail clam Sphaerium 13 9 6 3 11 6 0 0 0
Snail Pleurocera 3 5 2 0 2 1 0 0 0
Leech Helobdella 0 1 2 4 1 0 0 0 0
Crane fly Tipula 0 0 0 0 0 0 1 1 3
Midge fly larva Coelotanypus 0 0 0 0 0 0 0 0 0
Aquatic worm Oligochaeta 0 0 0 0 0 0 3 3 0
APPENDIX D: Land Use/ Land Cover Information
(Note: LULC info provided by Barb McIlween)
The above figure displays the Land Use/Land Cover surrounding the latrine sites (red dots) located on Black Creek.
The above figure displays the Land Use/Land Cover surrounding the latrine sites (red dots) located on Oatka Creek.
Category Oatka Creek Percentages
Open Water 5 0.2698327
Developed, Open Space 51 2.75229358
Developed, Low Intensity 18 0.97139773
Developed, Medium Intensity 12 0.64759849
Developed, High Intensity 4 0.21586616
Deciduous Forest 298 16.0820291
Evergreen Forest 16 0.86346465
MIXED FOREST 568 30.6529951
Shrub/Scrub 26 1.40313006
Grassland/Herbaceous 7 0.37776579
Pasture/Hay 254 13.7075013
Cultivated Crops 112 6.04425256
WOODY WETLANDS 468 25.2563411
Emergent Herbaceous
Wetlands 14 0.75553157
Total 1853 100
The following table displays the LULC of Honeoye Creek and the percentage they covered within the 30 meter buffer.
Category Honeoye Creek Percentages
Open Water 53 1.49759819
Developed, Open Space 145 4.0972026
Developed, Low Intensity 32 0.90421023
Developed, Medium Intensity 26 0.73467081
Developed, High Intensity 10 0.2825657
DECIDUOUS FOREST 734 20.7403221
Evergreen Forest 21 0.59338796
MIXED FOREST 692 19.5535462
Shrub/Scrub 179 5.05792597
Grassland/Herbaceous 36 1.01723651
PASTURE/HAY 671 18.9601582
Cultivated Crops 419 11.8395027
Woody Wetlands 429 12.1220684
Emergent Herbaceous
Wetlands 92 2.59960441
Total 3539 100
The following table displays the LULC of Black Creek and the percentage they covered within the 30 meter buffer zone.
Category Black Creek Percentages
Open Water 51 0.84507042
Developed, Open Space 619 10.2568351
Developed, High Intensity 19 0.31483016
Deciduous Forest 815 13.5045568
Evergreen Forest 20 0.33140017
Mixed Forest 436 7.22452361
Shrub/Scrub 63 1.04391052
Grassland/Herbaceous 20 0.33140017
Pasture/Hay 1027 17.0173985
Cultivated Crops 666 11.0356255
WOODY WETLANDS 2009 33.2891466
Emergent Herbaceous
Wetlands 38 0.62966031
Total 6035 100
APPENDIX E:
Summary of Water Chemistry Data
Spring water chemistry data: The following chart displays the average of the ten different sites located throughout the three creeks in the Monroe County study area.
Creek DO(mg/l) Temp(°C)
Nitrate(NO3-)(mg/L) Phos(PO4-3) pH
Honeoye 8.66 22.93 2.09 0.44 8.02
Black 8.36 20.64 0.70 0.20 8.11
Oatka 9.69 18.21 1.08 0.19 7.92
Fall water chemistry data: The following chart displays the average of the ten different sites located throughout the three creeks in the Monroe County study area.
Creek DO(mg/l) Temp(°C)
Nitrate(NO3-)(mg/L) Phos(PO4-3) pH
Honeoye 9.52 17.26 1.08 0.30 7.98
Black 10.00 17.09 1.31 0.21 8.04
Oatka 10.28 14.09 1.58 0.25 7.92
Averages of the water chemistry data: The following chart displays the averages of the fall and spring data collected in the three creeks in 2006
Creek DO(mg/l) Temp(°C)
Nitrate(NO3-)(mg/L) Phos(PO4-3) pH
Honeoye 9.09 20.10 1.58 0.37 8.00
Black 9.18 18.86 1.00 0.20 8.07