City, University of London Institutional Repository
Citation
:
Lambrechts, A., Karolis, V., Garcia, S., Obende, J. and Cappelletti, M. (2013).
Age does not count: resilience of quantity processing in healthy ageing. Frontiers in
Psychology, 4, p. 865. doi: 10.3389/fpsyg.2013.00865
This is the published version of the paper.
This version of the publication may differ from the final published
version.
Permanent repository link:
http://openaccess.city.ac.uk/7170/
Link to published version
:
http://dx.doi.org/10.3389/fpsyg.2013.00865
Copyright and reuse:
City Research Online aims to make research
outputs of City, University of London available to a wider audience.
Copyright and Moral Rights remain with the author(s) and/or copyright
holders. URLs from City Research Online may be freely distributed and
linked to.
City Research Online:
http://openaccess.city.ac.uk/
[email protected]
Age does
not
count: resilience of quantity processing in
healthy ageing
Anna Lambrechts1
, Vyacheslav Karolis2
, Sara Garcia3
, Jennifer Obende4
and Marinella Cappelletti2
*
1Autism Research Group, Department of Psychology, City University London, London, UK 2Institute of Cognitive Neuroscience, University College London, London, UK
3
Institute of Ophthalmology, University College London, London, UK 4
Psychology Department, University College London, London, UK
Edited by:
Elise Klein, Knowledge Media Research Center, Germany
Reviewed by:
Stella F. Lourenco, Emory University, USA
Margarete Delazer, Medizinische Universität Innsbruck, Austria
*Correspondence:
Marinella Cappelletti, Institute of Cognitive Neuroscience, University College London, 17 Queen Square, London, WC1N 3AR, UK e-mail: [email protected]
Quantity skills have been extensively studied in terms of their development and pathological decline. Recently, numerosity discrimination (i.e., how many items are in a set) has been shown to be resilient to healthy ageing despite relying on inhibitory skills, but whether processing continuous quantities such as time and space is equally well-maintained in ageing participants is not known. Life-long exposure to quantity-related problems may progressively refine proficiency in quantity tasks, or alternatively quantity skills may decline with age. In addition, is not known whether the tight relationship between quantity dimensions typically shown in their interactions is preserved in ageing. To address these questions, two experimental paradigms were used in 38 younger and 32 older healthy adults who showed typical age-related decline in attention, executive function and memory tasks. In both groups we first assessed time and space discrimination independently using a two-choice task (i.e., “Which of two horizontal lines is longer in duration or extension?”), and found that time and space processing were equally accurate in younger and older participants. In a second paradigm, we assessed the relation between different quantity dimensions which were presented as a dynamic pattern of dots independently changing in duration, spatial extension and numerosity. Younger and older participants again showed a similar profile of interaction between number, cumulative area and duration, although older adults showed a greater sensitivity to task-irrelevant information than younger adults in the cumulative area task but lower sensitivity in the duration task. Continuous quantity processing seems therefore resilient to ageing similar to numerosity and to other non-quantity skills like vocabulary or implicit memory; however, ageing might differentially affect different quantity dimensions.
Keywords: quantity processing, time, space, number, ageing, magnitude system
INTRODUCTION
A central part of our everyday life involves judging quantities, for example which queue at the supermarket has fewer people, or if a parking space is wide enough for our car, or if there is suf-ficient time to pop to a café before our next meeting (Lemaire and Lecacheur, 2007; Gandini et al., 2008, 2009). Collectively these judgments provide rough magnitude estimates in the form of number, spatial extension or temporal duration (Walsh, 2003; Gandini et al., 2009; Bueti and Walsh, 2009; Bonn and Cantlon, 2012; Cantlon, 2012).
A large body of research has recently investigated the develop-ment of numerical, spatial and temporal estimations in humans and primates and their impairment in the lesioned brain. For instance, these studies have shown that different magnitude dimensions have parallel patterns of performance in animals
(Meck and Church, 1983; Breukelaar and Dalrymple-Alford,
1998; Meck, 2005; Beran, 2007; Merritt et al., 2010), and simi-lar rates of development in humans (Brannon et al., 2006, 2007; Van Marle and Wynn, 2006; Feigenson, 2007; Droit-volet et al., 2008; Reynvoet et al., 2009). It has also been shown that there are
associations (Basso et al., 1996; Zorzi et al., 2002) and dissocia-tions between dimensions in the lesioned brain (Doricchi et al., 2005; Cappelletti et al., 2009, 2011). This evidence has supported the idea that magnitude dimensions are mapped onto an abstract analogue scale (Walsh, 2003; Bueti and Walsh, 2009; Gallistel, 2011) such that from early in development individuals apply asso-ciative mappings “more A, more B” across different magnitude dimensions (Lourenco and Longo, 2010).
MAGNITUDE PROCESSING IN HEALTHY AGEING
younger participants in selecting among them (e.g.,Duverne and Lemaire, 2005; Lemaire and Arnaud, 2008), or that they do not equally engage the same brain regions as younger participants when performing arithmetical tasks (El Yagoubi et al., 2005). Moreover,Cappelletti et al. (in press)found that numerosity dis-crimination is resilient to ageing although it is influenced by the decline of inhibitory processes supporting number perfor-mance. In comparison to number, time and space processing have been much less investigated in older adults (OAs). Some evidence in the temporal domain indicates that OAs demon-strate diminished accuracy but intact sensitivity in duration judgments (Baudouin et al., 2006; Block et al., 1998; Lustig and Meck, 2011). For instance, OAs report larger estimates but reproduce shorter durations relative to younger adults (YAs) (Block et al., 1998). However, these group differences might reflect age-related declining of skills required for temporal judg-ments, like working memory storage and executive functions, in which case they would not be suggestive of a pure deficit in temporal processing in ageing. In the domain of spatial pro-cessing, differences in speed (Birren and Botwinick, 1955) but not in accuracy (Verrillo, 1981; but seeSara and Faubert, 2000) have been reported between YAs and OAs in size discrimination tasks.
RELATIONS BETWEEN MAGNITUDE DIMENSIONS FROM INFANCY TO OLDER AGE
One way to probe the integrity of magnitude processing lays in examining interaction effects between magnitude dimensions, and interactions are at the basis of the idea that different dimen-sions are mapped on an analogue scale, and that magnitude processing skills rely on common resources (Gallistel, 1989, 2011; Gallistel and Gelman, 2000; Walsh, 2003; Bueti and Walsh, 2009; Cantlon, 2012). Interaction studies have shown that judgments on a target dimension are sensitive to information from concur-rent task-irrelevant magnitude dimensions. Such studies usually examine the influence of one dimension on the other, unilater-ally (effect of A on B) or bilaterunilater-ally (effect of A on B and effect of B on A). For instance, duration has been recurrently found to be sensitive to task-irrelevant numerical information (both symbolic, like Arabic figures and non-symbolic, like number of dots) following a “more A, more B” pattern: the larger the num-ber, the longer the duration is perceived (Droit-Volet et al., 2003; Dormal et al., 2006; Xuan et al., 2007, 2009; Oliveri et al., 2008; Vicario et al., 2008; Dormal and Pesenti, 2013). Duration pro-cessing has also been shown to be unilaterally sensitive to spatial interaction. The longer the length or size of a stimulus (physical or implicit), the longer its duration is perceived (Xuan et al., 2007; Casasanto and Boroditsky, 2008; Bottini and Casasanto, 2010; Casasanto et al., 2010; Dormal and Pesenti, 2013). In contrast, studies report that duration does not influence numerical judg-ments (Droit-Volet et al., 2003; Dormal et al., 2006; Dormal and Pesenti, 2013). Similarly, although the classic tau effect (Helson and King, 1931) is an example of the influence of duration on spa-tial judgment, this finding has often not been replicated, leading to the suggestion that duration does not influence spatial judg-ments (Casasanto and Boroditsky, 2008; Bottini and Casasanto, 2010; Dormal and Pesenti, 2013). An exception to this pattern
of results has been shown in a few recent studies in which inter-actions between number and duration have been reported to be bidirectional (Arend et al, under review;Javadi and Aichelburg, 2012, 2013). Likewise, spatial and numerical dimensions have been shown to interfere with each other bidirectionally (space affects number perception and number affects space perception), although not always symmetrically (interactions can be stronger in one direction than the other). Most studies report again a “more A, more B” pattern: the larger the numerical (symbolic or non symbolic) magnitude, the longer the length of a line is per-ceived (Dormal and Pesenti, 2007, 2013; De Hevia et al., 2008; De Hevia and Spelke, 2010); reciprocally, the longer the size, the larger the number is perceived (Dormal and Pesenti, 2007, 2013; although seeShuman and Spelke, 2006andTokita and Ishiguchi, 2011).
Interactions between dimensions have been proposed to be the side product of an automatic mapping of number, space and time on an analogue magnitude (Cantlon, 2012; Dormal and Pesenti, 2013). Alternatively interactions could be the manifestation of a statistical relationship between numerical, spatial and temporal information that we extrapolate to refine magnitude estimations (Cantlon, 2012): if we observe consistently that longer distance take a longer time and a larger number of steps to walk, we can correct our estimate of the length path by estimating the dura-tion of the trip and the number of steps we made. In both cases, interactions reflect a tight relationship between the processing of different magnitude dimensions. To the best of our knowledge no research has yet assessed whether OAs present the same pattern of interactions at those observed in younger individuals.
OBJECTIVES OF THE CURRENT STUDIES
to ageing. Alternatively, if magnitude dimensions are differently affected by ageing, the pattern of interactions itself (i.e., direction-ality of the interactions) is expected to differ from YAs’ without necessarily showing weaker or stronger interactions.
PARTICIPANTS
A total of 70 right-handed neurologically healthy participants with normal or corrected-to-normal vision gave written consent and were paid to participate in our study which was approved by the local research Ethics Committee. Participants were selected from the UCL Institute of Cognitive Neuroscience database based on their age. Forty-five participants took part in Study 1: 24 were young participants with a mean age of 24.8 years (SD=3.64; age range 20–35; 9 males); 21 were older participants with a mean age of 65 years (SD=4.8; age range 59–74; 10 males). Thirty participants took part in Study 2: 16 were young participants with a mean age of 25.0 years (SD=4.4; age range: 20–37; 9 males); 14 were older participants with a mean age of 66.9 years (SD=3.4; age range: 63–73; 6 males). Two young and three older participants took part in both studies.
STUDY 1
We first examined whether processing the continuous dimen-sions of time and space may be affected by ageing. We used an established experimental paradigm previously employed to probe continuous quantity processing in young healthy participants and neurological patients (Cappelletti et al., 2009, 2011), whereby in different blocks participants were asked to discriminate dura-tion or spatial extension (length) on one-dimensional stimuli (horizontal lines).
METHODS
Background tasks
Participants in both groups were assessed with standard tests of intelligence (National Adult Reading Test,Nelson and Willison, 1991) and vocabulary (vocabulary subtest of the WAIS-R, Wechsler, 1995). They were also tested on the Attention Network Test (Fan et al., 2002), the color Stroop task (Stroop, 1935) and the number Stroop task (Henik and Tzelgov, 1982) to assess attentional and inhibitory functions (see description of the tasks below); the “Doors and People” test (Baddeley et al., 1994) as well as the digit span and the spatial span (Wechsler, 1995; see description of the tasks below) were administered to test mem-ory performance. In addition, OAs were given the Mini Mental State Examination (Folstein et al., 1975) to screen for cognitive impairment.
The Attention Network Test(ANT,Fan et al., 2002) examines executive and inhibitory processes by asking participants to attend to one target while ignoring others (Posner et al., 1980). Three aspects of performance are measured: alertness, orienting, and conflict. The version used here combined a cueing task and a flanker task (Eriksen and Eriksen, 1974): participants responded to cued or un-cued central targets while ignoring flanking distrac-tors. The stimuli consisted of a target arrow flanked by two arrows on either side, which could point to the same direction as the target arrow (congruent condition, e.g.,→→→→→) or to the opposite direction (incongruent condition, e.g.,→→←→→).
FollowingFan et al. (2002), each arrow was presented at 0.55◦ of visual angle and separated from the adjacent arrows by 0.06◦ of visual angle. The stimuli (central arrow and flankers) mea-sured 3.08◦of visual angle in total. Participants were instructed to attend to the middle arrow and to decide whether it was pointing to the left or to the right. Each trial started with a central fixa-tion cross which was presented for a random durafixa-tion between 400 and 1600 ms, followed by either a 100 ms warning asterisk cue (cued trials) or by a longer fixation (un-cued trials), and by a second 400 ms fixation period after which the target and the flankers appeared simultaneously and centrally at 1.06◦of visual angle either above or below the fixation point. The cue was always valid and could either appear centrally, i.e., in a spatially neutral condition or precede the target and flankers in the same position above or below the fixation point, i.e., in a spatially-orienting con-dition. The target and flankers remained on the screen until the participant responded or for a maximum of 1700 ms. The next trial began immediately after a response was made. A total of 288 trials were presented in 3 blocks of 96 trials each. Responses were made by pressing a left-hand key (or right-hand key) if the central arrow pointed left (or right) as quickly as possible.
The color Stroop task(Stroop, 1935) provides a standard mea-sure of participants’ ability to inhibit task-irrelevant information. Participants are instructed to report as quickly as possible the color of the font in which words are displayed while ignoring their meaning. In each trial, participants saw a centrally presented 500 ms fixation cross, followed by a word stimulus which stayed on the screen until the participant made a response or for a max-imum of 4000 ms. The following trial started immediately. The task consisted of a total of 60 trials. Stimuli were either the words “RED” and “BLUE” or a string of “XXX.” The color of the font was red or blue, resulting in congruent (e.g., the word RED appearing in red), incongruent (e.g., the word RED appearing in blue) and neutral conditions (e.g., XXX appearing in red). There were 20 trials in each condition. Responses were given by pressing the left or right arrow keys for blue or red color of the font, respectively.
on which side was the larger number in either numerical mag-nitude or physical size by pressing either the left or the right arrow. A trial started with a 500 ms fixation cross, followed by the number stimuli until the participant made an answer or for a maximum of 4000 ms. After this, the following trial started immediately. For each task (number or physical size), accuracy and response times were recorded. This experimental paradigm commonly shows a “facilitation effect,” i.e., participants are faster to respond to congruent stimuli (e.g.,
3
vs. 2) relative to neu-tral stimuli (e.g., 3 vs. 3 for physical comparisons or 3 vs. 2 for numerical comparisons), they are slower to respond to incongru-ent stimuli (e.g., 3 vs.2
) relative to neutral stimuli (Henik and Tzelgov, 1982).The “Doors and People” Recognition test (“Doors” stimuli only) was used to assess visual memory (Baddeley et al., 1994). Participants were asked to memorise the images of two sets con-sisting of 12 pictures of doors, which were presented sequentially for 3 s each. Immediately after, participants were asked to indi-cate with no time pressure which image they had previously seen amongst a choice of 4 images, three of which were new. In the first set of pictures, new and old door stimuli differed on general appearance; in the second set, old and new door stimuli differed in finer details (more difficult).
The digit span task (Wechsler, 1995) was used to assess verbal working memory. Here participants were instructed to repeat increasingly longer sequences of number stimuli presented verbally. The sequences increased in length by one item until a participant could not repeat two sequences of the same length without making an error. In a first block, the sequences had to be repeated in the forward order; in a second block, they were repeated in the reversed order.
Spatial span assessed spatial working memory using the “Corsi” task (Wechsler, 1995). Participants observed the exper-imenter touching a series of blocks on a horizontal board in a given sequence. Participants were then instructed to repeat the same steps in each sequence. Sequences increased progressively in length by one unit and were repeated in the forward order only.
Experimental tasks: continuous quantity processing
Stimulus presentation and data collection were controlled using the Cogent Graphics toolbox (http://www.vislab.ucl.ac.uk/ Cogent) and Matlab 7.0 software on a Sony-Vaio laptop com-puter. The dimensions of the display, as rendered on the built-in liquid-crystal screen, were 33.8 cm horizontal by 27 cm verti-cal. The display had a resolution of 1280×1024 pixels and was refreshed at a frequency of 60 Hz. A chin-rest was used to stabilize head position of the participants and the viewing distance from the monitor was 50 cm. During all testing sessions participants sat in a quiet room facing the computer screen under normal room lighting.
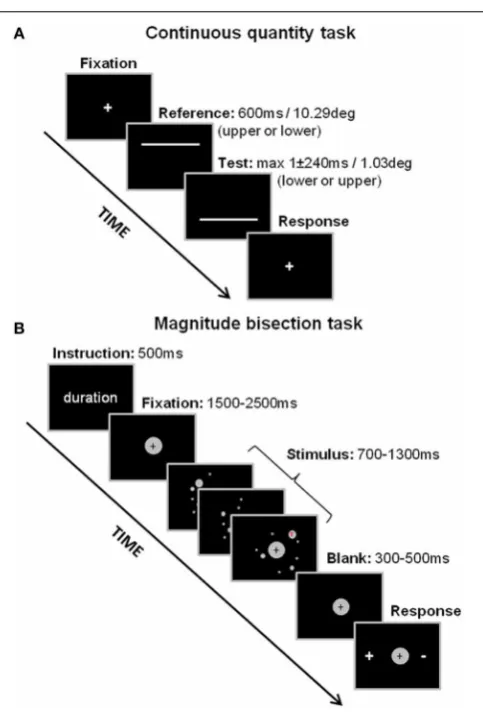
[image:5.595.306.548.56.418.2]Stimuli. Stimuli were two horizontal white lines (thickness 0.153◦) centered on the vertical meridian on a black background. The lines were presented sequentially in a two-interval discrim-ination paradigm, one line 5.07◦ above the horizontal meridian and the other 5.07◦below (seeFigure 1A). The first line stimu-lus in the two-interval sequence (the “Reference”) always had a
FIGURE 1 | Experimental designs for the continuous quantity tasks (A) and the magnitude bisection tasks (B).In the continuous quantity tasks, participants had to compare the length or the duration of two lines presented sequentially on the screen. In the magnitude bisection tasks, participants had to decide whether the number of dots, cumulative area covered by dots or duration of the display was closer to a small/short or a large/long standard.
length of 10.06◦ and a duration of 600 ms. The second line (the “Test”) could vary according to a Method of Constant Stimulip either in length or duration, depending on the dimension to be judged (the irrelevant dimension always matched the Reference). For each dimension the ratio between the smaller and the larger stimulus could vary unpredictably over five levels (steps of 0.201◦ for length and 40 ms for time) with equal frequency: ratio of 1.02, 1.04, 1.06, 1.08, and 1.10 for length and ratio of 1.067, 1.133, 1.20, 1.267, 1.333 for time, selected from previous pilot studies. There were 5 blocks of 40 observations for each level of the test stimulus (total of 200 observations for each task). The length and duration discrimination tasks were run independently from each other in counterbalanced order across participants to avoid order effects (seeFigure 1A).
immediately displayed above (or below) the fixation point fol-lowed by the Test (or the Reference) line below (or above) the fixation, and an inter-stimulus-interval of 100ms. The screen then remained blank until a response from the subject, followed by the central fixation point which stayed on the screen until the partic-ipant pressed the space bar; the next trial followed immediately (seeFigure 1A).
Procedure. In each task, participants were instructed to make un-speeded responses by pressing either the “up” or “down” cursor-arrow keys of the computer keyboard to indicate the ver-tical position of the test line which appeared the longest either in duration or in spatial extent. Correct answers were equally assigned to the “up” or “down” keys in each task.
DATA ANALYSIS
For bothcolor and number Stroop taskswe calculated the differ-ence in RT between congruent and incongruent trials, considered to be a standard measure of participants’ ability to inhibit task-irrelevant information (Stroop, 1935). In further analyses we refer to this index as the Stroop effect.
In theduration and length discrimination tasks, each partic-ipant’s response distributions were used to estimate the preci-sion of the underlying magnitude representation, expressed as the Weber fraction (wf). The magnitude representations were assumed to be Gaussians with standard deviations linearly related to their means. Thewf determines the variation of the standard deviation of the Gaussian random variables in each magnitude. The estimates ofwfwere obtained by fitting cumulative Gaussian function with log-transformed test magnitude as a predictor to the proportions of correct responses for each test level. The data were fitted using maximum likelihood criterion. The fitting func-tion had the standard deviafunc-tion as the only free parameter. The mean of cumulative Gaussian was fixed at the magnitude of Reference along relevant dimension. The standard deviations of the fitted functions were then divided by the square root of 2 to obtain the estimates of individual wf. A larger wf implies a larger overlap between two magnitude representations lead-ing to a lower discriminability and a higher rate of incorrect responses. Therefore, a largewfindicates a worse performance in the task.
In theANTthree indexes of performance were measured based on how response times of correct answers are influenced by alert-ing cues, spatial cues, and flankers: alertness (cued vs. un-cued trials), orienting (central cue vs. spatial cue), and conflict (con-gruent vs. incon(con-gruent trials averaged across cued and un-cued, and central vs. spatial cue).
In all tasks, data were analyzed using ANOVA and t-tests with a p-value <0.05 considered significant for all statistical analyses. For the standardized tasks (with the exclusion of IQ, digit span, spatial span, Doors and People task and vocabulary) non-parametric tests were used (Mann–WhitneyU-test).
In Study 1, a total of 4.84 and 4.86% of the data were missing in the older and in the younger group, respectively. The data sets were completed using expectation-maximization protocol imple-mented in the SPSS package. Only one data point was missing
in the time discrimination in the older group and none in the young group. There were no missing data points for the space discrimination task.
RESULTS
Background tasks
There was a significant group difference in IQ and vocabulary scores, with older participants outperforming the young [t(43)=3.83, p<0.001,p=0.005, andz-score approximation
=2.78, respectively], consistent with results reported in previous studies (Hedden and Gabrieli, 2004). Performance on the Mini Mental State Examination (Folstein et al., 1975) showed no signs of cognitive deterioration in older participants (seeTable 1).
Older participants performed worse than young in tests assess-ing attention (ANT); specifically they were significantly slower at orienting [t(43)=2.07,p<0.044] and alerting attention fol-lowing visual cues [t(43)=2.33,p=0.025]. Older participants were also worse than younger participants in processing stimuli containing conflicting information [t(43)=3.52,p=0.001].
Executive functions measured in the color Stroop task also indicated group differences. Both groups showed reliable Stroop effect [YA:t(23)=3.38p<0.005; OA:t(20)=5.68,p<0.001] but this was stronger in the older group (YA mean RT difference: 21.5 ms, SD=31.1; OA mean RT difference: 111.5 ms, SD=
89.9,t(43)=4.61,p<0.001), indicating a difficulty for OAs to inhibit task-irrelevant information.
In the number Stroop task, an ANOVA with task (number and physical size comparison) and group (older and younger) factors showed a main effect of task [F(1,43)=9.78, p=0.003, η2p=
0.23] and of group [F(1,43)=13.14,p=0.001,η2p=0.31] but
no significant interaction. Across the groups, the effect of phys-ical size on numerphys-ical comparison was stronger than vice versa (mean Stroop effect for size-relevant task: 59.5 ms, SD=37.8; mean Stroop effect for number-relevant task: 87.93 ms, SD=
50.13). Across tasks, there was a greater Stroop effect in the older than in the younger group (mean RT difference for YA: 59.7 ms,
SD=21.5; mean RT difference for OA: 89.72 ms,SD=33.44), consistent with the result of the color Stroop task.
Visual memory function measured with the “Doors and People” task showed a significant group difference indicating a better performance in the younger group (younger vs. older:
p<0.001,z-score approximation=3.99). A marginally signif-icant group difference was observed in the task measuring spatial span (YA vs. OA:p<0.074,z=1.79) but not digit span (YA vs. OA:p<0.79,z=0.26).
Experimental tasks: continuous quantity processing
We first tested whether there was any group difference in any of the continuous quantity tasks. An ANOVA with the logwf
of duration and length tasks as within-subject factor and group (younger and older) as between-subject factor showed only a sig-nificant main effect of task [F(1,43)=356.42, p<0.001, η2p=
Table 1 | Demographic data and descriptive statistics for the younger adult (left) and older adult (right) groups in Study 1.
Task/information Younger participants (N=24) Older participants (N=21)
A. DEMOGRAPHIC INFORMATION
Age 24.8 years (SD=3.6) 65.0 years (SD=4.8)
Gender 9 males 10 males
B. BACKGROUND
Full IQ (NARTa) 114.3 (SD=11.22) 125.7 (SD=8.4)
Mini Mental State Examinationb nt Median=30 (min=28)
Vocabularyc Median=50 (IQR=7) Median=57 (IQR=7.5)
C. ATTENTION AND EXECUTIVE FUNCTIONS AND MEMORY
Attention network test (ANT)d
Orienting 37.3 ms (SD=18.5) 54.0. ms (SD=34.4)
Alerting 24.9 ms (SD=15.9) 3.5 ms (SD=41.8)
Conflict (incongruent-congruent) 85.9 ms (SD=20.5) 116.3 ms (SD=36.1) Word Stroop task (Stroop effect)e 21.5 ms (SD=31.1) 111.5 ms (SD=89.9)
Number Stroop task (Stroop effect)f
Numerical comparison 68.3 ms (SD=36.6) 110.3 ms (SD=54.8) Physical comparison 51.1 ms (SD=35.0) 69.1 ms (SD=39.4) Visual memory (Door recognition)g Median=22 (IQR=2) Median=20 (IQR=4.5) Verbal memory (Digit span)a Median=22 (IQR=8) Median=22 (IQR=6) Spatial memory (Spatial span)a Median=10 (IQR=6) Median=9 ( IQR=4.5)
D. CONTINUOUS QUANTITY PROCESSING
Time discrimination (wf) 0.32 (95% CI: 0.06–1.65 ) 0.30 (95% CI: 0.097–0.92) Space discrimination (wf) 0.043 (95% CI: 0.022–0.084 ) 0.039 (95% CI: 0.012–0.127 )
aNelson and Willison, 1991; bFolstein et al., 1975; max score:30 cWechsler, 1995;
dFan et al., 2002; eStroop, 1935;
fHenik and Tzelgov, 1982; gBaddeley et al., 1994;
SD, Standard deviation; IQR, Interquartile Range; CI, Confidence Interval; nt, not tested; ms, milliseconds; wf, Weber Fraction.
specific for each task show no group difference [Space:t(43)=0.7,
ns; time:t(53)=0.34,ns].
We also used a regression analysis to investigate whether, within the older group, age may predict performance in space and time processing. An analysis based on regressing the logwf
on participants’ age showed no negative effect of age on per-formance (space:t=0.86,p=0.40,R2
adj=0.0; time:t=1.57,
p=0.13, R2adj=0.07; where a negative t-value implies decline with age).
There was a significant correlation betweenwf of length and duration tasks in the older group,r=0.60,p=0.004, but not in the younger group (r=0.16, p=0.46). However, the com-parison of correlations using Fischer’s Z transformation failed to show a significant group difference (z=1.64,p=0.10).
Next, we examined whether both within and across groups continuous quantity processing correlated with other cognitive abilities, especially the inhibitory ones. There was no correlation with measures of IQ, vocabulary, attention (orienting, alerting and conflict separately), spatial, visual and verbal memory across groups. However, in the older group better performance in dura-tion and length discriminadura-tion negatively correlated with the Stroop effect measured in the color Stroop task (Time:r=0.66,
p=0.001; Space: r=0.45, p=0.036). In other words, older participants who could better resolve conflict were also better at discriminating continuous quantities. Length discrimination also negatively correlated with a measure of conflict resolution in ANT task, (r=0.50,p=0.021), but not with orienting and alerting. No correlation with the Stroop effect in the number Stroop task was observed.
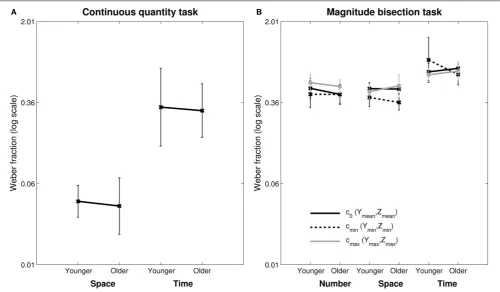
FIGURE 2 | Weber Fractions (wf) for the continuous quantity tasks (A) and the magnitude bisection tasks (B). In the magnitude bisection tasks wf are presented in the three experimental conditions
c0 (Ymean, Zmean), cmin (Ymin, Zmin) andcmax (Ymax, Zmax). Weber Fractions are a measure of sensitivity in discrimination tasks. Error bars show standard deviations.
anatomical links between number and space (Cappelletti et al., in press), but it contrasts with the finding that performance in number and cumulative area discrimination correlates in young adults (Lourenco et al., 2012). The absence of correlation might indicate a stronger link between space and numerosity pro-cessing than between space and time propro-cessing. The fact that performance in duration and length discrimination tasks corre-lates in ageing, however, hints at the possibility that processing of continuous quantities is maintained in ageing but that the link between different dimensions might change with age. We therefore tested a second group of participants with a novel exper-imental design previously used to probe interactions between magnitude dimensions (Lambrechts et al., in press). We reasoned that weaker or stronger interactions between dimensions in OAs may indicate a smaller or larger reliance on common processes for magnitude discrimination, respectively. Alternatively, a pattern of interactions between dimensions which is altogether differ-ent from YAs’ may suggest that age-related changes might be dimension-specific.
STUDY 2
Here we specifically examined whether known interactions between magnitude dimensions (time, space and numerosity) are maintained in ageing. The stimuli, design and procedure used were adapted from a previous paradigm employed in younger participants (Lambrechts et al., in press). Participants judged
the duration, the cumulative area covered by the stimuli, or the number of stimuli (dots) presented in a dynamic display.
METHODS
Stimulus presentation and data collection were controlled using Psychtoolbox 3.0 (Brainard, 1997; Pelli, 1997; Kleiner et al., 2007) and Matlab 7.0 software on a 1024×768 pixels monitor screen with a 75 Hz frame rate. Participants were seated∼60 cm away from the display.
Background tasks
In addition to the experimental tasks participants were also assessed with a standard test of intelligence (National Adult Reading Test, Nelson and Willison, 1991) and two tests of arithmetic performance (arithmetic subtest in the WAIS-R, Wechsler, 1995and Graded Difficulty Arithmetic test, Jackson and Warrington, 1986). The latter two were tested in order to evaluate whether a deficit in arithmetic performance may also be present, should duration and cumulative area perception be impaired.
Experimental tasks: magnitude bisection tasks
they then disappeared progressively after a lifetime of 333–507 ms (all values chosen pseudo-randomly for each trial). Steps during which new dots appeared lasted 40–507 ms. A display was char-acterized by its duration (time elapsed between the appearance of the first dot and the disappearance of the last one), the cumulative area of its dots, and the total number of dots presented. Duration, cumulative area and number were defined according to 3 exper-imental conditions (see Design below). Dot stimuli had a radius comprised within 0.45 and 2.84◦ of visual angle, and could not overlap in space or time. The virtual disk for display had a radius varying pseudo-randomly between 5.7 and 7.7◦ of visual angle. Dot stimuli were constrained not to appear in an inner disk of radius 0.9◦centered on a fixation cross. Luminance of all dots for one trial took one of six values [57, 64, 73, 85, 102, and 128 in the 0(black)-to-255(white) RGB-coded referential] chosen pseudo-randomly. In addition, there was a letter that appeared inside one of the dots, which could be either a red or green, upright or upside-down capital “T” (seeFigure 2A). This was used as a control condition to test for participants’ general alertness dur-ing the task (see below). Participants were asked to discriminate the target (upright red T) from the distracters (upright green T or upside-down red or green T).
Design.The experiment combined a bisection task (on magni-tude dimensions) and a signal detection paradigm (target/non target). The design for both tasks is summarized inTable 2. For the bisection task, participants were first trained to discriminate between a small (“−”) and a large (“+”) standard in each mag-nitude dimension (short/long duration, small/large cumulative area, small/big number of dots). During the test phase they were then asked to judge whether the duration, cumulative area or number of dots in each trial was closer to the “−” standard or
to the “+” standard. Standards were defined as 0.7 (“−”) and 1.3 (“+”) times a mean value set asDmean=1000 ms,Smean= 878 mm2, andN
mean=28 dots for duration (D), cumulative area (S), and number (N) respectively. These values were chosen to produce similar sensitivity in the three tasks based onLambrechts et al. (in press). During the test phase each magnitude dimension took 5 possible values defined as 0.7, 0.9, 1, 1.1, and 1.3 times the mean value (hereafter:X0.7,X0.9,Xmean,X1.1,andX1.3, with dimensionX beingD,S, orN). Three experimental conditions were retained to explore the susceptibility of the target magnitude judgment to irrelevant dimensions (see Figure 2B). In control
condition 0(c0), orthogonal dimensions were set to their mean (Ymean,Zmean); incondition 1(cmin), they were set to their min-imal values (0.7×mean value: Ymin, Zmin) and incondition 2 (cmax), they were set to their maximal values (1.3×mean value:
Ymax,Zmax).
In addition to the magnitude tasks, we also used a target detection control task to measure participants’ attention. This aimed at excluding that any generalized impairment in the mag-nitude tasks could be due to attention-related disorders. For this target detection task a letter appeared inside one of the dots in each trial and could be either a target (red upright T) or a distractor (red inverted T, green upright T or green inverted T).
[image:9.595.44.561.453.660.2]Trials were pseudo-randomized across tasks and conditions. A total of 720 trials were collected in the magnitude bisection tasks (3 dimensions×3 conditions×4 values×20 trials) and 200 in the control detection task (one third with a target and two thirds with distracters equally presented). Trials were pseudo-randomized across tasks and conditions, and blocked by 100 trials (the original experimental design comprehended two additional conditions, with a total of 1400 trials).
Table 2 | Experimental design for Study 2.
Instruction (target magnitude)
Target magnitude value Non-target magnitude value
Magnitude bisection task
Duration (D) Surface (S) Number (N)
Xmin=0.70Xmean
X0.9=0.90Xmean
X1.1=1.10Xmean
Xmax=1.30Xmean
If target magnitudeD
c0= [Smean,Nmean];cmin= [Smin,Nmin];cmax= [Smax,Nmax]
If target magnitudeS
c0= [Dmean,Nmean];cmin= [Dmin,Nmin];cmax= [Dmax,Nmax]
If target magnitudeN
c0= [Smean,Dmean];cmin= [Smin, Dmin];cmax= [Smax,Dmax]
Instruction Letter stimulus Letter stimulus type
Target detection task
Red T search Red upright T Red upside-down T Green upright T Green upside-down T
Target Distractor Distractor Distractor
In the magnitude bisection tasks (top line), one of three dimensions (number, surface, duration) was the target dimension. Four values were tested for the target dimension X (0.7, 0.9, 1.1 and 1.3 * Xmean), while non-target dimensions Y and Z were determined according to three experimental conditions: in c0 non-target dimensions took their middle value (Ymean, Zmean); in cminnon-target dimensions were minimal (Ymin, Zmin); in cmaxnon-target dimensions were maximal (Ymax,
Zmax). In the target detection task (bottom line), participants had to detect a target letter (red upright T) that appeared at each trial within one of the dots and reject
Procedure. Before the test session, participants engaged in the training phase: they were familiarized with the minimum (X0.7) and maximum (X1.3) values for each magnitude dimension (D,
S, N) as well as with the target (red upright T) and distracters (green upright T, red or green upside-down T). The training ses-sion consisted of two stages: a learning and a test stage. During the learning stage, participants passively viewed 10 examples of stimuli for each task (5 minima and 5 maxima or 4 targets and 6 distracters). They then moved on to the test stage in which they were presented with the same 10 examples and asked to per-form a categorical judgment. In the test phase each trial started with one of four instructions: “Duration,” “Surface,” “Number” (magnitude bisection task) or “Red T” (detection task) displayed centrally on the screen for 500 ms. A fixation cross followed for a duration pseudo-randomly chosen between 1500 and 2500 ms after which the stimulus was presented. After the stimulus display and a subsequent 300–500 ms fixation cross, participants were prompted for their response by the simultaneous appearance of “+” and “−” displayed on each side of the fixation cross. In the magnitude tasks (bisection tasks), participants were instructed to judge whether the stimulus displayed was closer to the mini-mum standard (“−”) or the maximum standard (“+”) in a given dimension. In the control task (target detection) participants were instructed to indicate whether they had seen either the target (“+”) or a distractor (“−”), seeFigure 1B. The relative position of “+” and “−” on the monitor was pseudo-randomly assigned throughout the trials. Response keys were “h” and “j” on the com-puter keyboard. Participants were instructed at the beginning to avoid counting and to respond by hunch. In addition, perfor-mance in discriminating durations in this range (700–1300 ms) is unlikely to benefit from using a counting strategy (Grondin et al., 2004). There was no time constraint to respond.
DATA ANALYSIS
Magnitude bisection tasks
The proportions of “+” responses (stimulus estimated as closer to the maximum standard) were computed separately for each task, dimension and condition. Values were individually fitted to a cumulative Gaussian functionfusing Psignifit 3.0.8 (Fründ et al., 2011) in Matlab 7.0. Two indices were computed: the Point of Subjective Equality (PSE, value at 50% of “+” responses) which is a canonical measure of accuracy and thewf, computed as in study 1, which reflect sensitivity.
Data were cleaned as follow: when wf values were negative or outside ±3 standard deviations of the total mean, data for that participant and in that dimension were excluded (10% of the data were excluded across both groups). In the YA group, 2 participants were excluded from the duration task, 2 from the cumulative area task and 1 from the number task. In the OA group, 2 participants were excluded from the duration task and 2 were excluded from the cumulative area task (resulting in a minimum of 12 participants per dimension in each group).
Separate repeated-measure ANOVAs were performed on PSEs and wfs using the IBM SPSS software (Version 19.0). A Greenhouse-Geisser correction was applied when appropriate.
Post-hocBonferroni-correctedt-tests were performed to explore significant main effects or interactions.
Target detection task
Hit and false alarm rate were computed as the proportion of target which were correctly detected, and the proportion of distractors that were detected as targets, respectively. Dprime (d) detection scores were computed by subtracting the z-scores of hit from false alarm (withNthe inverse normal law):
d=N−1(HIT)−N−1(FA)
RESULTS
Background tasks
The two groups differed marginally in the estimate of IQ assessed by the National Adult Reading Test, with OAs slightly outper-forming young adults [t(23)= −2.03, p=0.054]. Participants in the two groups did not differ in arithmetic performance as measured by the Graded Difficulty Arithmetic test [t(27)=
−0.065,p>0.9] and the arithmetic subtest of the Wechsler Adult Intelligence Scale-R [t(27)= −0.613,p>0.5].
Target detection task
Both groups were able to perform the target detection task (dYA =
2.18;dOA =2.18), with no group difference [independent sample
t-test ondvalues,t(28)=0.02,p>0.9]. This suggests that both groups were equally able to attend to the stimuli throughout the task.
Experimental tasks: magnitude bisection tasks
Since our criterion to include or exclude individual participant’s data point was applied separately for each task, some participants were retained in one task and not in others. In order to maxi-mize statistical power we therefore conducted statistical analyses on each task separately.Figure 3shows the psychometric profiles of responses obtained in each group.
Point of Subjective Equality (PSE). Planned mixed-design, repeated-measure ANOVAs with PSE as the dependent variable, condition (3:c0,cmin,cmax) as independent factor and group (2: YA, OA) as between-group factor were conducted for each task separately. Results are presented inFigure 3(right panel).
In every task, the ANOVA revealed a significant main effect of condition [number:F(2,29)=138.64,p<0.001,η2p=0.828;
cumulative area:F(2,26)=156.96,p<0.001,η2p=0.867;
dura-tion: F(2,26)=11.97, p<0.005, η2p=0]. In the number task,
post-hoc paired-sample t-tests revealed that PSE in cmin was smaller than inc0[t(29)=10.93,p<0.001] and PSE in c0 was smaller than incmax[t(29)= −7.22,p<0.001]. Additionally, PSE was smaller in cmin than in cmax[t(29)= −14.51, p<0.001]. Therefore, number was overestimated when duration and cumu-lative area were minimal, and underestimated when duration and cumulative area were maximal.
Similarly, in the cumulative area task, post-hocpaired t-tests showed that PSE incmin was smaller than inc0 [t(26)=10.07,
p<0.001] and PSE in c0 was smaller than in cmax[t(26)=
−9.19,p<0.001]. Additionally, PSE was smaller incminthan in
FIGURE 3 | Performance in the magnitude bisection tasks for the younger adult (Top) and older adult (Bottom) groups. Left panel: psychometric profiles of response for the number, cumulative area and duration tasks. Data points show average responses across participants. Full
lines correspond to the average psychometric fit.Right panel: Point of Subjective Equality for the number, cumulative area and duration task in the three experimental conditionsc0(Ymean,Zmean),cmin(Ymin,Zmin) andcmax (Ymax,Zmax). Error bars show standard error of the mean.
In theduration task,post-hocpaired-samplet-tests showed that PSE in bothc0[t(26)= −3.57,p<0.005] andcmax[t(26)=3.70,
p<0.005] conditions were smaller than PSE in cmin. Duration was therefore underestimated when cumulative area and num-ber were minimal compared to when they had either mean or maximal values.
Critically, a main effect of group was found in theduration task
[F(1,26)=6.70, p<0.05, η2p=0.218]. YAs produced a higher
PSE than OAs, i.e., OAs overestimated duration relative to YAs (PSEYA=1.206,PSEOA=1.038). This results confirms the idea that temporal estimation changes with age (time seems to stretch for longer). However, the absence of a condition×group interac-tion indicates that although the absolute percepinterac-tion of durainterac-tion changes with ageing, the way in which other magnitude dimen-sions interfere with duration judgment is similar in both age groups.
Overall these results confirm that even when they are task-irrelevant, magnitude dimensions interfere with the accuracy of each other’s judgment. In line with previous findings (e.g.,Xuan et al., 2007, 2009; Casasanto and Boroditsky, 2008; Oliveri et al., 2008), cumulative area and numerosity affected duration judg-ment in a positively correlated way (the larger the cumulative area and number, the longer the subjective duration). More surpris-ingly, duration and number, and duration and cumulative area, affected cumulative area and number judgment in a negatively correlated way, respectively; this means that many dots presented for a longer time appeared to have a small cumulative area, and that larger dots presented for a longer time seemed less numerous.
Additionally, while cumulative area and number were perceived similarly by both groups, temporal content was judged shorter in the older than in the YAs group.
Weber fraction (wf). Planned mixed-design, repeated-measure ANOVAs with wf as the dependent variable, condition (3: c0,
cmin, cmax) as independent factor and group (2: YA, OA) as between-group factor were run for each task separately. Results are presented inFigure 2(right panel).
In the number task, the ANOVA revealed a main effect of condition [F(2,29)=10.31, p<0.001, η2p=0.276]. Corrected
post-hocpaired-samplet-tests revealed thatwf was lower incmin [t(29)= −3.88, p<0.005] and in c0 [t(29)= −2.92, p<0.01] than in cmax. Wf was also found to be marginally smaller in
cminthan inc0[t(29)=1.94,p=0.062]. This indicates that both groups were less precise to estimate number when space and time had large values than when they had small values. Critically, no main effect or interaction with group was significant, indicating that older and YAs estimated number equally well.
In thecumulative area task, the ANOVA revealed a main effect of condition [F(2,26)=13.10,p<0.001,η2p=0.353]. Corrected
post-hocpaired-samplet-tests showed thatwf was lower incmin than both inc0[t(26)=6.51,p<0.001] andcmax[t(26)= −3.67,
p<0.005], suggesting that both YAs and OAs were more precise to estimate cumulative area when time and number were mini-mal. Interestingly, the analysis also revealed a significant condi-tion×group interaction [F(2,26)=4.59,p<0.05,η2p=0.161].
difference between YAs and OAs’wf in either of the conditions (c0,cmin, orcmax). Further independentt-tests revealed that the interaction was likely driven by the difference betweenwfincmin andcmax (wfc2–wfc1) which differed in YAs and OAs [t(24)= −2.51, p<0.05]. Paired t-tests indicated that in both groups
wf were smaller incmin than both in cmax [YA:t(14)= −2.84,
p<0.05; OA:t(12)= −3.29,p<0.01] and c0[YA:t(14)=3.86,
p<0.005; OA:t(12)=5.58,p<0.001]. Participants were more precise to judge cumulative area when few dots were presented for a short duration (incmin) than when many dots were pre-sented for a long duration (incmax), and even more so in the OAs than in the YAs group. There was no significant main effect of group, confirming that precision in the cumulative area task was very similar in both participants group, although interaction effects were slightly accentuated in the OAs group.
In the duration task, the ANOVA revealed a marginal main effect of condition [F(2,26)=3.37,p=0.076,η2p=0.123] and
a significant interaction condition×group [F(2,26)=4.87,p< 0.05,η2
p=0.169].Post-hocindependentt-tests revealed thatwf
incminwas larger in the YAs than in the OAs group [t(24)=2.01,
p<0.05]. Pairedt-tests further indicated that in the YAs groupwf
was smaller incmaxand as an index than incmin[t(14)=2.33,p< 0.05 and t(14)= −2.15, p=0.051, respectively] whereas there were no difference between conditions in the OAs group. This indicates that sensitivity for duration increased when cumulative area and number took larger values in the YA group, whereas sensitivity to duration was unaffected by cumulative area and number in the OAs group. There was no significant main effect of group, indicating that overall precision in the duration task was similar in both groups.
Overall our findings indicated that sensitivity to number judg-ment was modulated by task-irrelevant dimensions similarly in both groups. In contrast, in the cumulative area and duration tasks, the fine pattern of interactions differed between groups. In the cumulative area task, OAs’ performance was more sensitive to interaction than that of YAs, whereas in the duration task OAs’ performance was more resilient to interaction than that of YAs. However,wf did not overall differ between age groups in any of the dimensions, suggesting that overall quantity discrimination is preserved in ageing.
DISCUSSION
This research evaluated the integrity of quantity processing in healthy ageing. In the first study, we used a two-choice paradigm to investigate continuous quantity processing (space and time discrimination) along with standard measures of cog-nitive processing. Our results indicate that although elderly par-ticipants showed typical age-related decline in memory, attention and executive functions, the ability to judge space and time remained intact. To further assess quantity processing in age-ing, we explored the relation between magnitude dimensions whose interactions, so far observed in childhood and in young adulthood, have been taken to suggest the existence of shared or overlapping resources for quantity processing (Gallistel and Gelman, 2000; Walsh, 2003; Bueti and Walsh, 2009; Cantlon, 2012). In a second study, we therefore tested whether process-ing of number, time and space also interacted with each other in
older as well as in younger participants. We found that irrespec-tive of age, number, duration and cumulairrespec-tive area estimations were susceptible to concurrent, task-irrelevant magnitude dimen-sions, suggesting that quantity processing may be supported by a shared mechanism throughout adulthood. However, the extent to which task-irrelevant dimensions influence the sensitivity of continuous quantity judgments (cumulative area and duration) differed slightly with age. In addition, the percept of duration was found to be modulated by age as elderly adults judged durations close to their veridical values whereas younger adults tended to underestimate duration.
Our results of preserved continuous quantity processing (space and time) in ageing, despite otherwise typical signs of cognitive decline, is to our knowledge the first evidence of the integrity of continuous quantity discrimination in healthy ageing. Together with recent findings showing that numerosity discrimination is also resilient to age (Cappelletti et al., in press), this suggests that non-symbolic quantity processing is generally preserved in healthy ageing. This finding might appear in contrast to other studies showing that flexibility in arithmetical problem solving tasks (e.g., Geary and Lin, 1998; Duverne and Lemaire, 2005;
Lemaire and Arnaud, 2008) and performance in temporal
esti-mation tasks (e.g.,Block et al., 1998; Baudouin et al., 2006; Lustig and Meck, 2011) decrease with age. However, past research has pointed out that decline in other cognitive functions and pro-cesses such as memory, processing speed, attention or executive functions rather than quantity processing itself might account for reduced performance in some numerical and temporal judgment tasks (Salthouse, 1991; Salthouse and Kersten, 1993; Vanneste and Pouthas, 1999; Perbal et al., 2002; Salthouse et al., 2003; Duverne et al., 2008; Cappelletti et al., in press).
Our evidence of maintained quantity processing adds to other cognitive abilities that have proven resilient to ageing, such as verbal memory (vocabulary), implicit memory and emotional processes (Hedden and Gabrieli, 2004), and as such our find-ing contributes to definfind-ing the profile of preserved and declinfind-ing cognitive abilities in older age (Hedden and Gabrieli, 2004). At present, it is not clear why some cognitive processes are better preserved than others in ageing. One possibility is that quantity-based processes may be more primitive and therefore more robust than later acquired skills such as arithmetic or second-language acquisition. Although quantity processes refine with age, they are in place very early in development (e.g.,Xu and Spelke, 2000; Feigenson et al., 2002; Brannon et al., 2007). Their ubiquity makes them crucial to navigate the environment at any age. Preserving them in ageing, either by maintaining the same strategies or by reallocating resources could allow individuals to remain aware of their environment and able to adapt their behavior accordingly.
We also found that OAs showed patterns of interaction among quantities which resemble those observed in children and young adults and which have led to the hypothesis of a common mecha-nism for time, space and number processing (Walsh, 2003; Bueti
and Walsh, 2009; Cantlon, 2012). Although most studies have
in press) proposed that quantity estimates more likely result from Bayesian-like cue-integration whereby the preferred strategy to estimate quantity is to combine cues not only from the target dimension but also from concurrent dimensions. A similar view was expressed inKarolis (2013)and supported by an analysis of the scales for space and number. Here, we found that interac-tions related to cumulative area and duration (as observed on a measure of sensitivity) were modulated by age. For instance, when judging cumulative area, OAs were more susceptible to task-irrelevant magnitude information than YAs. In contrast, when judging durations, OAs were more resilient to interaction of other magnitude dimensions than YAs. Such observations are diffi-cult to reconcile with the view of aging as a declining evolution. For instance, the Inhibition Deficit theory (Hasher and Zacks, 1988) claims that the ability to inhibit task-irrelevant informa-tion decreases with age and would predict that interacinforma-tions are amplified in ageing. However, this would only account for the group differences obtained in the cumulative area task and not in the duration task. A more parsimonious interpretation would be that the weight with which each dimension affects the oth-ers changes with age. The current design and our relatively small sample size in study 2 do not allow us to conclude on this pos-sibility which should be explored in the future using dedicated paradigms.
Interestingly, irrespective of age, the directions of the inter-actions we observed were different from those often reported in the literature. While space and number positively interacted with time perception (more, larger dots were judged to last longer) similar to previous studies (e.g.,Dormal et al., 2006; Xuan et al., 2007, 2009; Casasanto and Boroditsky, 2008; Oliveri et al., 2008; Chang et al., 2011), space and time negatively interacted with number estimates, and number and time negatively interacted with space estimates. For instance, larger dots presented for a longer time were estimated less numerous and more dots pre-sented for a longer time were estimated as covering a smaller space. Previous studies reported the opposite pattern, namely that concurrent quantities positively interact with each other (e.g., Pinel et al., 2004; Dormal and Pesenti, 2007; Javadi and Aichelburg, 2012). These unpredicted results, which replicate recent findings obtained with a similar paradigm (Lambrechts et al., in press), may be explained by differences in the experi-mental paradigm used here and in past studies. Crucially, in our paradigm information about all three quantity dimensions was designed to accumulate similarly over time to match the intrin-sic continuous property of duration. Therefore, participants had to integrate time, space and number over the course of the stim-uli presentation and could not access the total cumulative area or total number of dots at any single time point before the end. As a result, the stimulus duration affected the amount of dots presented on the screen at a given time. For instance, given the same number of dots, when the stimulus duration was longer (or shorter), less dots were presented on average at a given moment, which could lead participants to perceive them as less (or more) numerous than veridical, arguably misleading them into under-estimating (or overunder-estimating) their number. This contrasts with previous studies in which spatial and numerical information were usually displayed all at once on the screen and stayed for the whole duration of the stimulus presentation (e.g., Xuan et al., 2007,
2009; Oliveri et al., 2008; Chang et al., 2011, but seeCasasanto and Boroditsky, 2008). In these studies, participants could estimate space and number as soon as a stimulus was presented, indepen-dently from its duration, so time did not impact numerical and spatial processing.
Another unexpected result was that older participants produced smaller PSE than younger participants in the duration task in Study 2 estimates of duration were closest to the veridical value for older than YAs. This finding is in disagreement with past research on time perception in ageing claiming that the ratio of estimated duration on objective duration increases with age, i.e., PSE should be getting larger with age (Block et al., 1998). It should be pointed out that most studies used different paradigms such as duration production and reproduction; importantly they tested longer durations (a few seconds or more) than the ones assessed in the present study. The study byLustig and Meck (2011) comes closest to the present methodology by using a bisection task with durations ranging from 3–6 s, and reports—similar to previous studies—that OAs produce a larger PSE than YAs. Based on time perception models, differences between YAs and OAs were interpreted by most authors in terms of decreased attentional span in the older participant group, although attentional skills were not directly assessed in these studies. Instead in our study, we controlled for attentional levels which were very similar in both groups. In addition, the use of shorter durations might have attenuated the load on attentional processes to maintain information throughout a trial.
CONCLUSION
Here we examined the integrity of continuous quantity process-ing and the link between number, space and time in ageprocess-ing. We showed first that discrimination of space and time, much like number, was preserved in ageing. We argued that the resilience of quantity processing skills in ageing may reflect the stability of primitive resources dedicated to quantity processing. Second, extending previous findings obtained with children and young adults, we demonstrated that in older adults, number, space and time interact in discrimination judgments, similar to what is observed in younger participants. However, we found subtle dimension-specific differences in the way concurrent dimensions affected the precision of continuous quantity estimation between younger and older adults which might indicate a change of weight of each dimension within the magnitude processing system.
ACKNOWLEDGMENTS
This work was supported by a Royal Society Dorothy Hodgkin Fellowship, a Royal Society and a British Academy research grants, and by Wellcome Trust scholarships to Jennifer Obende and Sara Garcia.
REFERENCES
Baddeley, A. D., Emslie, H., and Nimmo-Smith, I. (1994).Doors and People: a Test of Visual and Verbal Recall and Recognition. Bury St. Edmunds: Thames Valley Test Company.
Basso, G., Nichelli, P., Frassinetti, F., and Di Pellegrino, G. (1996). Time percep-tion in a neglected space.Neuroreport7, 2111–2114. doi: 10.1097/00001756-199609020-00009