City, University of London Institutional Repository
Citation
:
Andrienko, N., Andrienko, G., Fuchs, G., Rinzivillo, S. & Betz, H-D. (2015). Real
Time Detection and Tracking of Spatial Event Clusters. Lecture Notes in Computer Science,
9286, pp. 316-319. doi: 10.1007/978-3-319-23461-8_38
This is the accepted version of the paper.
This version of the publication may differ from the final published
version.
Permanent repository link: http://openaccess.city.ac.uk/13023/
Link to published version
:
http://dx.doi.org/10.1007/978-3-319-23461-8_38
Copyright and reuse:
City Research Online aims to make research
outputs of City, University of London available to a wider audience.
Copyright and Moral Rights remain with the author(s) and/or copyright
holders. URLs from City Research Online may be freely distributed and
linked to.
adfa, p. 1, 2011.
© Springer-Verlag Berlin Heidelberg 2011
Real Time Detection and Tracking of Spatial Event
Clusters
Natalia Andrienko1,2, Gennady Andrienko1,2, Georg Fuchs1, Salvatore Rinzivillo3, Hans-Dieter Betz4
1
Fraunhofer Institute IAIS, Sankt Augustin, Germany
2City University London, UK
3
CNR ISTI, Pisa, Italy; [email protected]
4
nowcast GmbH, Germany; [email protected]
Abstract. We demonstrate a system of tools for real-time detection of signifi-cant clusters of spatial events and observing their evolution. The tools include an incremental stream clustering algorithm, interactive techniques for control-ling its operation, a dynamic map display showing the current situation, and displays for investigating the cluster evolution (time line and space-time cube).
1
Problem setting
Spatial events are physical or abstract entities with limited existence times and partic-ular locations in space, for example, lightning strikes or mobile phone calls. A spatial event is characterized by its start and end times (which may coincide), spatial coordi-nates, and, possibly, some thematic attributes. We assume that occurrences of spatial events are registered, e.g., by sensors, and corresponding data records are immediate-ly sent to a server. The resulting data stream needs to be monitored.
We consider monitoring scenarios in which each individual event is not significant whereas spatio-temporal event clusters (i.e., occurrence of multiple events closely in space and time) may require observer’s attention. For example, moving vehicles may emit low speed events when their speed drops below a certain threshold. It is neither feasible nor meaningful to attend to every such event, but a spatio-temporal cluster of low speed events sent by several cars may deserve observer’s attention as a possible indication of a traffic jam. After detecting a cluster, the observer may need to trace its further evolution, i.e., changes in the number of events, number of vehicles involved, spatial location, shape, and extent. The task is to support the observer in detecting the emergence and tracking the evolution of spatial event clusters in real time.
2
Approach
of a density-based clustering method capable to process a data stream in real time. However, the existing stream clustering methods are oriented to somewhat different problem settings. The main problem they address is the memory limitation. Assuming that all data cannot fit in the memory, the methods summarize incoming data on the fly and keep only the summaries (micro-clusters) but not the original data items. Many streaming algorithms assume a two-phase approach: micro-clusters are created and maintained during an online phase and post-processed (e.g., merged into larger clusters) during an offline phase. This general framework is instantiated with different approaches to creating micro-clusters. The main representatives are CluStream [1] and DenStream [2] doing partition-based and density-based clustering, respectively.
CluStream partitions an initial portion of a stream into k micro-clusters. When a new data point d appears, it tries to fit d into one of the current micro-clusters, while satisfying the constraints on the maximum number of clusters k and maximum bound-ary R. DenStream identifies micro-clusters with a maximal radius Eps based on the concepts of core object and density adopted in density-based clustering. Unlike in CluStream, the number of micro-clusters is not bounded. Both approaches rely on a following offline phase, in which micro-clusters are merged into macro-clusters.
Our problem setting and requirements differ from those of the existing methods in several respects. First, emerging significant clusters need to be detected in real time and immediately shown to the observer, permitting no reliance on off-line post-processing. Second, clusters may emerge, evolve (grow, shrink, move, change shape, split, merge), and disappear, excluding the approaches assuming a constant number of clusters, like [1]. Third, the main memory limitations is not our primary focus. We assume that the available memory is sufficient for keeping all micro-clusters that may co-exist within a certain time interval T. Fourth, old micro-clusters (where the latest event is older than T) are not of interest anymore and may be discarded.
We propose a hybrid approach in which micro-clusters are built and updated simi-larly to [1], but without limiting the maximal number. They are merged online into larger clusters of arbitrary sizes and shapes by exploiting k-connectivity,as in [2].
In our approach, a micro-cluster consists of events fitting in a circle with a user-specified maximal radius R. Another user-user-specified constraint is the maximal tem-poral gap T that may exist between the events within a micro-cluster. When a new event comes, the algorithm checks whether it fits in one of existing micro-clusters, i.e., whether the event’s distance to the micro-cluster center does not exceed R. If so, the event is added to this micro-cluster, and the position of the center is updated. If not, a new micro-cluster consisting of only this event is created. For effective search of candidate micro-clusters for including new events, we use a spatial index [3].
The algorithm keeps in the memory only events that occurred within the time in-terval [tc-T, tc], where tc is the current moment. Older events are erased from the
micro-clusters, and micro-clusters that become empty are removed from the memory. A connecting event of two or more micro-clusters is an event located sufficiently close to their centers. By default, it means that the distance does not exceed R, but the user may specify a different connection distance threshold Rc. When micro-clusters
AING [4], where analogs of micro-clusters are treated as graph nodes. When a con-necting data point appears, an edge is created between the respective nodes.
A macro-cluster may include an arbitrary number of micro-clusters provided that each of them is k-connected to some other member micro-cluster. Hence, macro-clusters may have arbitrary shapes and spatial extents. As soon as the size (i.e., the number of the member events) of some micro- or macro-cluster reaches a user-chosen minimum Nmin, this cluster is visually presented to the observer on a map display.
The algorithm can additionally account for thematic attributes of the events. Thus, low speed events from moving vehicles may have an attribute ‘movement direction’. The algorithm can ensure that only events with similar directions are put together (the user needs to specify the maximal allowed difference in the directions). Another ex-tension is accounting for the event sources (e.g., the vehicles sending low speed events). For each micro- and macro-cluster, the algorithm can maintain a list of dis-tinct event sources. Clusters where all events come from a single source or from too few distinct sources may be disregarded as insignificant.
The map display used for the event stream monitoring shows the spatial positions, extents, and shapes of the significant event clusters that have been existing during the time interval [tc-TH, tc], where tc is the current time moment and TH is a chosen time
horizon of the observation. The evolution of the clusters, i.e., changes in the number of events, spatial extent, density, and/or other characteristics of the clusters, can be explored using additional time line and space-time cube displays. The parameter set-tings of the clustering algorithm can be interactively modified while the algorithm works. For presenting the tools, an event stream is simulated using real data.
3
Example
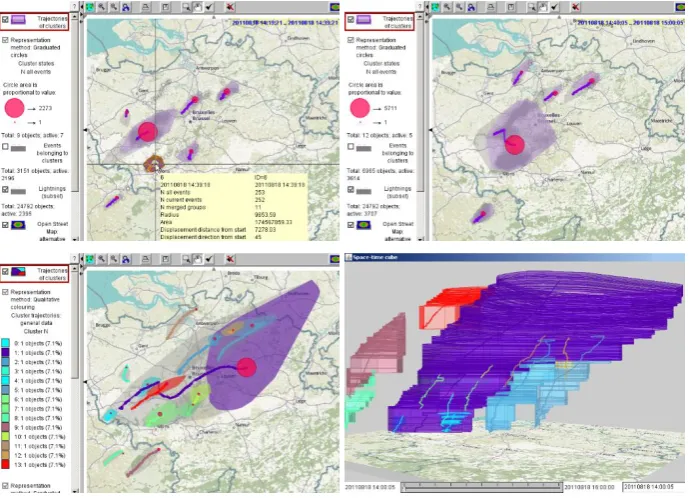
Figure 1 illustrates an application of the tools to a stream of lightning strike events simulated based on real data collected by nowcast GmbH (www.nowcast.de). The following parameter settings have been used: R = Rc = 3 km; T = 20 minutes; k = 1
event; Nmin = 50 events. In the upper part of Fig. 1, two screenshots of the map
dis-play show situations at two different time moments of the stream monitoring process with the time horizon TH = 20 minutes.
The clusters of lightning strike events are visually represented using several com-plementary techniques. The semi-transparent polygons represent the spatial convex hulls of the clusters. The violet-colored polygons show the cluster shapes and extents at the current time moment t. The light gray polygons enclose the cluster states that took place during the interval [t-TH, t]. The cluster sizes (i.e., the total event counts) are represented by proportional sizes of the red circles. The purple lines show the trajectories of the cluster centers. By hovering the mouse cursor over the trajectories, as shown on the top left of Fig. 3, the user can obtain information about the cluster states at different times.
In the lower part of Fig. 3, the cluster histories from a 2-hour time interval are pre-sented on a map (left) and in a space-time cube (right). The clusters are differently colored, to enable easier distinguishability. On the map, the colored polygons show the latest states of the clusters and the light grey polygons enclose all their member events. In the space-time cube, the colored three-dimensional shapes show the spatio-temporal extents and evolutions of the clusters.
Fig. 1. Top: two screenshots of the map display showing the situations in different time inter-vals. Bottom: the final clusters are represented on a map and in a space-time cube.
References
1. Aggarwal, C.C., Han, J., Wang, J., Yu, P.S.: A framework for clustering evolving data streams, in: Proc. 29th Int. Conf. Very Large Data Bases, Berlin, Germany, 2003.
2. Cao, F., Ester, M., Qian, W., Zhou, A.: Density-based clustering over an evolving data stream with noise, in: Proc. 6th SIAM Int. Conf. Data Mining, SIAM, Bethesda, Maryland, USA, 2006.
3. Andrienko, N., Andrienko, G.: Spatial generalization and aggregation of massive move-ment data. IEEE Trans. Visualization and Computer Graphics, 17(2): 205-219, 2011. 4. Bouguelia M.-R., Belaïd Y., Belaïd, A.: An Adaptive Incremental Clustering Method