International Journal of Innovative Technology and Exploring Engineering (IJITEE) ISSN: 2278-3075, Volume-8 Issue-8, June, 2019
3290
Prediction of Liver Disease using Rprop, SAG
and CNN
Deepa H Belavigi, Veena G S, Divakar Harekal
Abstract: Early prognosis of liver disease is very important to save human life and take legitimate precautions to control the disease. The computer cooperated diagnosis of liver disease plays and significant job in convenient detection and medication of liver. Quick and precise prophecy of liver disorder permits early and viable treatments. Experience cleared that numerous patients anguishing from liver disease die day by day because of misdiagnosis of the sicknesses. The work delve into the early prediction of liver disease using deep learning techniques. Artificial neural network model such as Resilient Back propagation Neural Network (Rprop), Stochastic Average Gradient (SAG) model and Convolutional Neural Network (CNN) models are utilized to take care of the issues that are been faced by doctors in diagnosis of liver maladies. The text and image datasets of liver are taken as inputs for the three algorithms. The results of the models are compared and the accuracy is obtained. Comparison emphasis on the type of aspects and models, that one has to rely on for early prediction of defect and medication of the liver. Results using image dataset are more factual than the text datasets.
Index Terms: Liver Disorder, Deep learning algorithms, Rprop, SAG, CNN, K-fold validation
I. INTRODUCTION
The way the medical services conveyed is taking a noteworthy jump and implies to be a promising answer for expanding populace. Both the developing and developed countries are predominantly concentrating on automated computerized calculations and remote human services conveyance answers for giving quality healthcare. Because of debasement of human way of life and sustenance propensities, one of the serious issues the population facing is Liver Disorder. Issues with liver patients are not effectively found in an early stage as it will work ordinarily even when it is halfway harmed. An early detection of liver issues will expand patient’s endurance rate. Liver disappointments are at high rate of hazard among Indians.As indicated by the World Health Organization, liver malignant growth has turned into the second driving reason for death in all malignancies. Computed tomography (CT) is a standout amongst the most usually utilized strategies for the discovery and determination of liver tumors. The segmentation of CT images and the identification of injury zones have been a crucial improvement heading of computer-aided therapeutic consideration. It is normal that by 2025 India may turn the World Capital for Liver Diseases. Across the board event of liver infection in India is contributed because to deskbound way of life, expanded smoking and liquor consumption. There are around 100 kinds of liver contaminations. In this way, building up a machine that will upgrade in the analysis of the
Revised Manuscript Received on June 05, 2019
Deepa H Belavigi, student in Computer Science Department of Ramaiah
Institute of Technology.
Veena G.S, working as an Assistant Professor in Computer Science Department of Ramaiah Institute of Technology.
Divakar Harekal is working as an Assistant Professor in Computer Science Department of Ramaiah Institute of Technology.
disorder will be of an incredible favorable position in the therapeutic field. These frameworks will help the doctors in settling on exact choices on patients and furthermore with the assistance of Automatic characterization devices for liver aliments (most likely mobile empowered or web empowered), one can decrease the patient queue at the liver specialists, for example, endocrinologists.
A standout amongst the most basic features in medicine is finding an infection. Diagnosis is characterized as the examination of the biochemical or physiological reason for an illness. It is a confused errand and includes certain dimension of expertise on some portion of a specialist. A complex framework is expected to assist physicians for treating a disorder precisely and productively. Deep learning algorithms and models incorporate efficient features for aiding the doctors in this case. Three algorithms namely, Resilient Back propagation Neural Network (Rprop), Stochastic Average Gradient (SAG) and Convolutional Neural Network (CNN) algorithms are utilized to treat the liver diseases and also heal the misdiagnosis of liver disorder patients. Two types of datasets are used in this work to anticipate the liver disease. One is text based dataset and the other one is image based dataset. Text based dataset is taken as input for Resilient Back propagation Neural Network and Stochastic Average Gradient Algorithms. Image based dataset is considered as input for Convolutional Neural Network Algorithm. The liver disorder dataset used for Rprop and SAG modelling consists of attributes like total bilirubin, direct bilirubin, age, gender, total proteins, albumin, globulin ratio etc. And the dataset used for CNN includes ultrasound images of liver. The image dataset gives the best accuracy.
II. LITERATURE SURVEY
Determination of liver disorder at an essential stage is significant for better medicine and treatment. It is an extremely requesting task for restorative scientists to envision the disease in the preliminary stages attributable to unobtrusive side effects. Often the symptoms become apparent as time passes. To defeat this issue, some deep learning models are utilized as a conclusion.
Earlier machine learning approaches were used to detect the liver disorder. There are many classification algorithm that could be utilized to classify liver disorders from the patient’s datasets. These listed algorithm could be considered namely Support Vector Machines, Naïve Bayes classifier, Back propagation Neural Network algorithm, and C4.5. These algorithms are evaluated on the basis of 4 criteria: Sensitivity, Specificity, Precision and Accuracy. Case-based reasoning (CBR) and Classification and regression tree (CART) techniques are used to obtain an inventive and an intelligent
diagnosis model to achieve a framework that will enrich the accuracy of the diagnosis methods.
diagnosis of liver diseases. There are few steps to be followed for applying the model: (1) CART should be adopted to check that the patient is suffering from liver disease (2) if the patient is been diagnosed with the disease, CBR should be employed to analyse the type of the disorder. To obtain higher accuracy novel decision tree based algorithm should be enforced.
The advanced methodology makes use of deep learning techniques. Resilient Back propagation (Rprop) is a deep learning algorithm that is used to train a neural network and it is equivalent to back-propagation algorithm, but this algorithm is superior to back-propagation algorithm because of its 2 main reason: First, the training rate of Rprop is fast as compared to that of back-propagation. Second, there is no necessity to stipulate any parameter values for Rprop, but back-propagation requires values for learning rate. The major drawback of Rprop is that it’s more complex and complicated than back propagation algorithm.
On other hand Stochastic Gradient Descent (SGD) performs a parameter update for each of the training example. This technique is much faster and it performs one update at a time.
θ=θ−η⋅∇J(θ;x(i);y(i)) , where {x(i) ,y(i)} are the training examples.
Now due to these frequent updates, parameters updates have high variance and causes the Loss function to fluctuate to different intensities. This usually aids us to better and new local minima, on the other hand we could see that Standard Gradient Descent will converge to the minimum of the basin.
CNN get issues of low accuracy. A technique dependent on improved CNN and Random Forest (RF), which has a higher accuracy than traditional CNN is enlightened here. Convolutional Neural Network (CNN), a typical depth learning model that captures complex non-linear mapping between inputs and outputs, provides a best performance in solving computer vision problems, including visual recognition and image segmentation. CNN multi-layer structure that can automatically learn a numerous number of hierarchical features. Shallow layer learns the characteristic of local area, and deep layer learns the statistical characteristic. The characteristic of deep layer has more abstract and deep information, and therefore is more suitable for image classification.
III. PROPOSED SYSTEM
The text based dataset has been obtained from Indian Liver Patient Dataset (ILPD) from UCI Repository. 580 instances and 10 attributes are present in this dataset. Disease, TB, ALB, Age, Alkphos, Sgot, DB, TP, AGR and Sgpt are the attributes available. The Image dataset Contains Fifty one ultrasound images of liver and it’s obtained from the same repository.
The attributes values present in the text based data set have different values i.e. they are not at a comparable range therefore transformation of the values into comparable range is required, by making the attribute value ranges from 0 to 1. This process is known as Normalization. Normalization is achieved by dividing sample of particular attribute by its maximum value.
The below flow charts depicts the implementation steps for
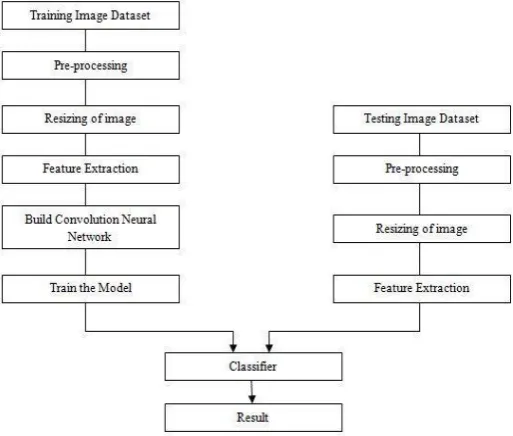
both text based datasets and image dataset. Figure 1 shows the processing of text based datasets using Resilient Back Propagation and Stochastic Average Gradient Algorithms. The dataset is segmented into training and testing dataset. Similarly, image based dataset is processed using CNN which is depicted in figure 2. Here also the dataset is divided into train and test data as in text based dataset. After pre- processing of data method is applied for feature extraction. In image based dataset before feature extraction image is resized. Then the classification is done followed by enforcing the proposed algorithms.
A. Requirements
Hardware requirements:
Intel Core 2 Duo Processor is used. Minimum 2GB RAM and 80GB Hard Disk are required.
Software requirements:
[image:2.596.321.562.309.473.2]Windows 7 and above operating system is needed. The IDE required are Anaconda navigator and Rstudio.
Figure 1: Flow diagram for processing text based dataset
[image:2.596.302.559.503.721.2]International Journal of Innovative Technology and Exploring Engineering (IJITEE) ISSN: 2278-3075, Volume-8 Issue-8, June, 2019
3292 IV. RESULTS
Two GUI’s are created to display the results of implementation, one GUI is to analyse the results of Rprop and SAG algorithm and another GUI is to analyse the result of CNN algorithm. The GUI’s are created using R.Shiny package in R.
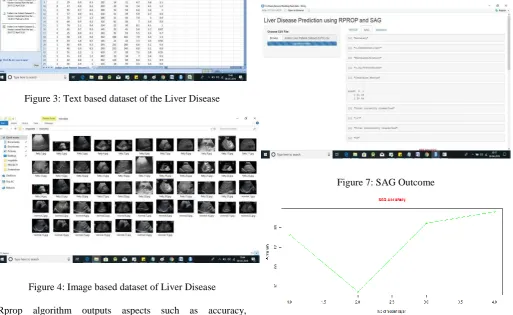
[image:3.596.313.559.55.169.2]The text based dataset used for Rprop and SAG is shown below in figure 3. And the image dataset used for CNN is shown in figure 4. The images taken are ultrasound images. Both the text and image datasets are taken from Indian Liver Patient Dataset (ILPD) from UCI Repository.
Figure 3: Text based dataset of the Liver Disease
Figure 6: Rprop accuracy graph
SAG algorithm outputs the same aspects as Rprop such as accuracy, misclassification, confusion Matrix, classifying the instances correctly, classifying the instances incorrectly, precision, sensitivity, specificity and accuracy graph. SAG outputs are represented in figure 7 and figure 8.
Figure 7: SAG Outcome
Figure 4: Image based dataset of Liver Disease
[image:3.596.43.557.250.565.2]Rprop algorithm outputs aspects such as accuracy, misclassification, confusion Matrix, classifying the instances correctly, incorrectly classified instances, precision, sensitivity, specificity and accuracy graph. The Rprop output is displayed in figure 5 and figure 6.
Figure 5: Rprop Outcome
Figure 8: SAG accuracy graph
[image:3.596.40.289.626.768.2]Figure 9: Comparison graph between Rprop and SAG
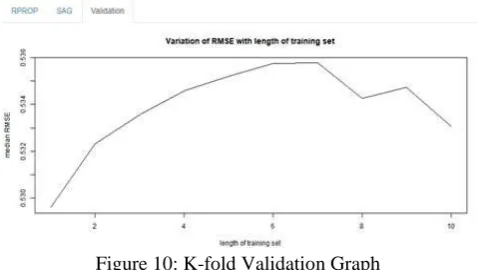
[image:4.596.59.283.53.164.2]Finally Validation for text based dataset using RPROP and SAG is done using K fold Validation. K fold Validation splits the samples into K equal sub samples. Suppose if there are n samples in the dataset then k fold validation selects random k value, then samples in each subsample is n/k. Algorithm will run for each subsamples by keeping one as validation dataset and calculates the error. Figure 10 shows the validation graph. In the below graph, k=10(10 iterations) and n=580 (because we have 580 samples in dataset) are taken. Therefore n/k=580/10=58. Hence in each iterations validation of 58 samples are processed.
Figure 10: K-fold Validation Graph
[image:4.596.313.554.238.385.2]The second GUI displays the CNN results for image based dataset consisting of the following details: prediction result, accuracy, confusion matrix, precision, sensitivity, specificity, misclassification details and graphs. CNN outcomes are displayed in figure 11 and 12. Figure 13 shows the detection of liver disorder that is in figure, 1 represents abnormal or fatty liver and 0 represents normal liver.
Figure 11: CNN Outcome
Figure 12: CNN result analysis graph
Figure 13: Abnormal (1) and normal (0) liver detection
Confusion Matrix helps in the visualization of performance of the algorithm. Each row in the matrix represents: instances in predicted class and each column represents: instances in actual class. For all the three algorithms confusion matrix isobtained which is shown in result screenshots.
The whole outcome values are displayed in below table 1for clear understanding of which gives best accuracy. The image based approach using CNN produces high accuracy.
V. CONCLUSION
Classification is important deep learning technique that is normally used in healthcare sectors for medical analysis and predicting illnesses. The classification Algorithms namely Resilient Back propagation Neural Network, Stochastic Average Gradient and Convolution Neural Network are used for predicting the liver disease in
[image:4.596.51.290.342.477.2] [image:4.596.304.547.532.682.2]International Journal of Innovative Technology and Exploring Engineering (IJITEE) ISSN: 2278-3075, Volume-8 Issue-8, June, 2019
3294 that is classification accuracy the comparison of algorithms is done. From the experimental consequences, this work concludes, Resilient Back propagation Neural Network algorithm because of its single hidden layer gives more accuracy than stochastic average gradient for text based dataset. Rprop produces better results if the number of hidden layers is less. Conversely SAG outputs appropriate outcomes if the hidden layers is increased. But CNN is considered as best algorithm as it uses image based dataset and gives highest classification accuracy.
Now a day’s getting correct healthcare is a big concern due to unavailability of skilled clinicians. Especially the liver diseases are increasing and it is estimated that enormous number of the world populace is suffering from lever disease. Due to unavailability of the skilled sonographers and doctors, the quality of diagnosis offered is being affected severely. To address this problem, algorithms to detect the fatty liver disease are proposed here using two parameters such as Liver disease text data and ultrasound images. The performance analysis of the proposed framework shows that the fatty liver disease in ultrasound images and liver disorder text dataset can be detected with an accuracy of 96.078% using CNN, 69.411 % using Rprop and 68.823 % using SAG respectively. As a future extension of this work, the developed algorithm on the hardware platform is ported to make it more useful and GUI can be created such that user can also enter details and get the predictions of getting liver disease.
REFERENCES
1. Xin-Yu Jin, Zhen-Hua Du, Ting Zhang, Lan-Juan Li, ―A Disease detection Method of Liver Based on Improved Convolution Neural Network‖,10th International Symposium on Computational Intelligence and Design 2017. 2. D Santhosh Reddy, R Bharath and P Rajalakshmi, ―A Novel Computer-Aided
Diagnosis Framework Using Deep Learning for Classification of Fatty Liver Disease in Ultrasound Imaging‖, IEEE 20th International Conference on e-Health Networking, Applications and Services 2018.
3. Rong-Ho Lin, ―An intelligent model for liver disease diagnosis‖, Artificial Intelligence in Medicine 47, 53—62 2009.
4. Moloud Abdar, Mariam Zomorodi-Moghadam, Resul Das, I-HsienTing, ―Performance analysis of classification algorithms on early detection of Liver disease‖, Expert Systems with Applications 2016.
5. Sana Ansari, Imran Shafi, Aiza Ansari, Jamil Ahmad, Syed Ismail Shah, ―Diagnosis Of Liver Disease Induced By Hepatitis Virus Using Artificial Neural Networks‖, IEEE 2011.
6. Joel Jacob, Joseph Chakkalakal Mathew, Johns Mathew, Elizabeth Issac, ―Diagnosis of Liver Disease Using Machine Learning Techniques‖, International Research Journal of Engineering and Technology (IRJET) 2018.
7. Ebenezer Obaloluwa Olaniyi, Khashman Adnan, ―Liver Disease Diagnosis Based on Neural Networks‖, Advances in Computational Intelligence-2017. 8. Gunasundari S, Janakiraman S, ―A Study of Textural Analysis Methods for the Diagnosis of Liver Diseases from Abdominal Computed Tomography‖, International Journal of Computer Applications, Volume 74– No.11, July 2013.
9. Bendi Venkata Ramana, Prof. M.Surendra Prasad Babu, Prof. N. B. Venkateswarlu, ―A Critical Study of Selected
10.Classification Algorithms for Liver Disease Diagnosis‖, international Journal of Database Management Systems (IJDMS), Vol.3, No.2, May 2011.
AUTHORS PROFILE
Deepa H Belavigi is a student in Computer Science Department of Ramaiah Institute of Technology.
Veena G.S. is working as an Assistant Professor in Computer Science Department of Ramaiah Institute of Technology.