International Journal of Innovative Technology and Exploring Engineering (IJITEE) ISSN: 2278-3075, Volume-8 Issue-12, October 2019
ABSTRACT: The approach in this paper is to analyze the propagation features of three distinct bands above 6GHz (i.e. 19, 28 and 38GHz) in an indoor corridor setting. The performance of 3GPP, NYUSIM channel models, Floating Intercept (FI), Frequency Attenuation (FA) path loss models are assessed using propagation features. Most of the available bands are now being used in the microwave band are below 6GHz. For the 5G system, the microwave band above 6GHz and mm-Wavebands can be used as bandwidth needed for all 5G applications. The analysis of LOS scenarios, channel Eigen values and spectral efficiency analyzes the channel model for the propagation of 5G mm-Wave bands.
Index Terms: Mm-Wavebands, Channel Modeling, 3GPP, NYUSIM Models AND LOS Models
I. INTRODUCTION
Millimeter wave bands can also be referred by the International Telecommunications Union (ITU) as exceptionally high frequency (EHF) or very high frequency (VHF) [1] wave bands and can be used for high-speed wireless broadband communication. mm-Wave can benefit from a tiny wavelength enabling the design of compact, huge antenna arrays with very narrow beams and therefore the strong beam forming techniques[5] (i.e. Hybrid beam forming) are used to that deliver optimum spatial reuse spectrum and continuously elevated interference signal ratio. Millimeter wave is a band of spectrum that is not fully developed and can be used in a broad range of components and services such as high speed, point-to-point local area networks (WLANs) and broadband access. Millimeter wave is used in telecommunications for various services on paper in both email address. Mobile and wireless networks [5], allowing for greater information rates of up to 10 Gbps.
Millimeter-wave (mm-Wave) communications is a key technology for 5G. The use of higher frequencies (e.g. beyond 6 GHz) for access communications in 5G has been creating excellent concern recently. The interest in these bands is increasing with the most number of customers increase in using wireless information combined with the restricted spectrum at the low frequencies (e.g. below 6 GHz). However, the path loss (PL) models must be determined for these higher frequency bands before they are used for the propagation done at lower frequencies.
Revised Manuscript Received on October 05, 2019.
Srinivas Nagula, Perusing M.Tech computer and communication Engineering, University College of Engineering Kakinada-JNT University, Kakinada
Leela Kumari B, Assistant Professor in JNT University.
The MNOs (mobile network operators) use different path loss models to assess the radio propagation capabilities of different spectrum bands or the different radio propagation models. That’s why the path loss models and propagation channel models plays an important role to construct the efficient channel for the propagation of 5G mm-Wave bands.
3GPP and NYUSIM MODELS:
There are different channel models to establish the 5G networks in mm-Wave bands. There are some models of channels that have been established around the globe by distinct organizations. And they are 3rd Generation Partnership Project model, WINNER II, International Telecommunications Union Radio communication Sector (ITU-R), METIS (Mobile and wireless communications Enablers for the Twenty-twenty Information Society), COST 2100,MiWEBA(MillimeterWave Backhaul and Access Evol ution) channel models, the statistical spatial channel model NYUSIM developed by New York University[1]. Among these channel models in this paper consider two channel models 3GPP and NYUSIM channel models to analyze the path loss and spectral efficiency. These models are accommodating the spectrum above 6GHz upto 100GHz and these 3GPP and NYUSIM models are developed in the mm-Wave band frequency.
II.PATH LOSS MODELS IN MM-WAVE BANDS
There are different types of path loss models used in
various types of propagation channel models. In this paper presents the two path loss models; they are Frequency Attenuation (FA) model and Floating Intercept (FI) model. These apply to any form of terrain (urban, suburban, or rural) and the coefficient of propagation, be it line-of-sight (LOS), expressed [4] through the exponent of path loss. The latter takes into consideration the distance of separation between the transmitter and receiver and their corresponding antenna heights. Usually, the path loss PL (d) (in dB) can be expressed asPL (d) = PL ( ) +10n + ……….. (1)
A. Floating-Intercept (FI):
The Floating-Intercept (FI) model used in the propagation model of WINNERII and 3GPP [4]. This model is not a physically based model and can be adjusted with certain bands and environments where the parameters of floating-intercept (α) is close to the FSPL at 1 m and the line of slope (β) is similar to the PLE. The FI model is defined as
……… (2)
Where is the zero-mean dB
random Gaussian variable with a normal dB deviation.
Implementation of an Efficient Channel Model
for 5G mm-Wave Bands
This path loss model also known as “αβ model” α is the intercept in dB, β is the slope.
In interpreting channel models,a popular mistake made by te chnicians is to believe that β is the same as PLE. It is not, β simply serves as a specific slope value that provides the best fit for a data scatter plot and β has only a physical significance, such as PLE, If α is set to the reference range of the free space very close to the antenna. When using (2) instead of using (1) with =1 m, the standard deviation is decreased by only 1 dB to 2 dB, yet there is no physical basis for (2).
B. Frequency Attenuation (FA) Path Loss Model: The path loss model of Frequency Attenuation (FA) is used [4], where the smallest measured frequency is used as the reference frequency in a specific situation. The FA path loss model is described as
( )+10 +
……… (3)
Where (𝑓ref, ) is the path loss in dB at the close-in distance of 1m and 𝑓ref is reference frequency. The in this model is characterized with the same calibration setting as the smallest measured frequency ; is PLE at .The factor (𝑓) is the frequency attenuation factor in dB, which reflects the signal fall with frequency, and is indicating the shadow fading term with a standard deviation of 𝜎 dB. The FA path loss model is a physical-based model and is easy to understand, as the CI model [4].
III. LOS PROBABILITY MODEL IN MM-WAVE BANDS
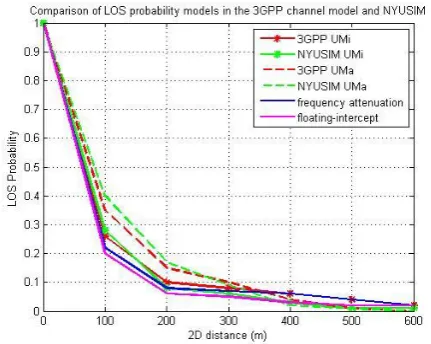
LOS probability relates to the probability that a particular user terminal (UT) or UE will be in a LOS BS situation [4]. LOS probability models for urban microcell (UMi) and urban macro cell (UMa) scenarios are analyzed in 3GPP, NYUSIM channel models, and Frequency Attenuation (FA) model and Floating Intercept (FI) model. Fig.1 shows the 3GPP, NYUSIM, Frequency Attenuation (FA) model [4] and Floating Intercept (FI) channel models of LOS probability models [4] in UMi and UMa situations at an UE height of 1.5 m. As fig. 1 shows, the 3GPP LOS probability model obviously has a non-zero long distance tail (several hundred meters), which is unlikely to be true in urban settings where there are numerous big structures, whereas NYUSIM demonstrates initially zero long distance LOS probability in urban regions which is distinct from the 3GPP model, Frequency Attenuation (FA) model and Floating Intercept (FI) model. On the other side, NYUSIM predicts a greater probability of LOS compared to 3GPP, Frequency Attenuation (FA) model and Floating Intercept (FI) model for T-R separation ranges lower than about 120 m (for UMi) or 160 m (for UMa).
Over 1000 random channel simulation runs for the indoor corridor circumstances over the distances from 10 m to about 300 m (where cell size was based on the condition that 95% of the area within a cell has an SNR ≥ 5 dB), the simulated LOS probability is 9.1%, 17.2%, 8.1% and 7% using 3GPP, NYUSIM models, frequency attenuation model and floating intercept models respectively. The difference in the LOS probability is a cause of spectral efficiency in 3GPP,
NYUSIM models, FI and FA path loss models also. These simulations result analysis used to select the efficient channel for the 5G propagation in the above 6 GHz upto 100 GHz wave bands which are called mm-Wave bands.
[image:2.595.317.533.111.283.2]
Fig .1 Performance analysis of the 3GPP, NYUSIM, FA and FI LOS probability models in UMi and UMa
situations for an UE height of 1.5 m.
The LOS models gives stronger mm Wave propagation (i.e., higher SNR), there will be effective signal transmission. In this approach the distance between the transmitter and receiver is taken as 200mts as reference point and then a the LOS probability of the channel models are analyzed to identify an efficient channel model.
IV. CHANNEL EIGENVALUES IN MM-WAVE
BANDS
Channel eigenvalues is a measure of number of eigen channels in a MIMO system for spatial multiplexing. The downlink NR×NT MIMO channel matrix H using 3GPP, NYUSIM [2] channel models, Floating Intercept(FI), Frequency Attenuation (FA) are generated for a system which is operating at 28 GHz with 100 MHz RF bandwidth, and 256 BS antennas and 16 MS antennas by composing a URA(uniform rectangle array) in the xz plane on each side. Simulation settings are detailed in Table I. The eigenvalues of
are calculated by using the following expression (4).
……….. (4)
International Journal of Innovative Technology and Exploring Engineering (IJITEE) ISSN: 2278-3075, Volume-8 Issue-12, October 2019
Fig 2 . CDFs of the largest four channels of 28 GHz in 3GPP, NYUSIM, frequency attenuation model and floating intercept channel m for eodels ach individual
user in the UMi situation in a single-cell MIMO three-user system
From Fig 2, it is evaluated, that In NYUSIM, the highest two eigen values are larger than those in 3GPP, while the third and fourth eigen values are usually smaller. This suggests that NYUSIM only produces a few but powerful dominant eigen modes, while the 3GPP model produces more eigen modes [1] with inefficient powers.
The number of dominant eigen channels (i.e., the channel rank) in NYUSIM is statistical and can vary over the range of 1 to 5, where 5 is the maximum number of spatial lobes, with an typical and average value of 2. The average standardized eigenvalue magnitude of as a function of the eigenvalue index for 3GPP, NYUSIM models, Floating Intercept(FI), and Frequency Attenuation (FA) models where the eigen value is achieved by separating the eigen value by the sum of all the channel matrix's eigen values in linear scale. As Fig.2 shows, the first two main eigen channels [1] of the 3GPP and NYUSIM channel models are approximately equivalent and the Floating Intercept (FI) and Frequency Attenuation (FA) channels are approximately distinct in normalized magnitude. In addition, all the eigenvalues of the 3GPP channels are within 25 dB of the largest eigenvalue. On the contrary, only four standardized eigen values are greater than -25 dB for NYUSIM and the non-dominant eigen-value magnitudes are rapidly decreasing. This shows the sparse function of the mm-Wave channel so that there is a comparatively large amount of accessible spatial multiplexing channels.
[image:3.595.49.288.50.246.2]Here the eigen values are used in the specified spectrum to spread mm-Wave to boost the channel efficiency. Analyze from fig.2 that NYUSIM model has more authority of its own compared to other designs such as 3GPP models, Floating Intercept (FI) and Frequency Attenuation (FA).
Table-I : Simulation settings for comparing channel eigenvalues and spectral efficiencies between 3gpp,nyusim channel models, frequency attenuation
model and floating intercept models
Parameter Setting
Carrier Frequency 28GHz Base Station Transmit +46dBm
Power
95% cell-Edge SNR 5Db
BS Antennas
Uniform rectangular array consisting of
cross-polarized elements in the X-Z plane
BS Antenna Spacing Half wavelength BS Antenna Element Gain 8dBi
BS Antenna Element Pattern
Model2, Page 18 in 3GPP TR 36,873 Release 12[1]
MS Antennas
Uniform rectangular array consisting of
cross-polarized elements in the X-Z plane
MS Antenna Spacing half wave length MS Antenna element gain 0dBi
MS Antenna element Pattern
Omni directional Reciver Noise figure 10dB
V.SPECTRAL EFFICIENCY STUDIES
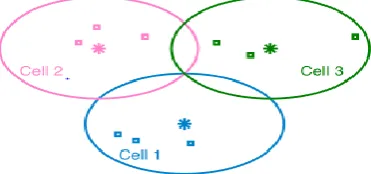
The single-cell situation (with single or multiple customers) gives a comparative benchmark; the multi-cell multi-user situation is nearer to what is used in practice. In this subsection, HBF [5] is used to investigate the spectral efficiency of a multi-cell MUMIMO [3] system. It is assumed that three neighboring cells with one BS and three UEs per cell are present in the system. Fig.3 illustrates an instance of the design of three cells. The radius of each cell is 300 m, which is achieved by assuming that 95% of the region in a cell has an SNR greater than or equal to 5 dB, and the upper limit of the T-R separation range is calculated on this basis and rounded to 300 m [1]. The UEs [3] are evenly and randomly distributed in each cell with T-R separation ranges varying from 10 m to 300m as shown in Figure3.
Figure.3An instance of the three-cell design where MATLAB generates one BS and three UEs per cell. Each
cell's radius is 300 m. The UEs in each cell are allocated evenly and randomly with ranges between 10 m and 300
m of T-R separation.
[image:3.595.335.521.447.534.2].
(a)One Data Stream
(b)Four Data Stream
(c) 16 Data Streams
Fig.4SUMIMO spectral efficiency CDFs using the HBF a lgorithm suggested in [ 2 ] for distinct RF chain numbers using 3GPP and NYUSIM, FA and FI channel models.
The legend's amount of RF chains indicates the transmission as well as receiving RF chains. The number of BS-UE data streams is one, four, and 16 in (a), (b), (c)
respectively.
The simulation results ensures that the 3GPP channel model has higher spectral efficiency when compared to
NYUSIM , Floating Intercept(FI), Frequency Attenuation ( FA) as shown in fig4(a). From fig.4(b) , it is observed that the spectral efficiency (through 4 data streams) the NYUSIM model gives more spectral efficiency when compared with other channel models. The spectral efficiency of different channel models, with 16 data streams are analyzed and the results showed that the NYUSIM channel model has higher efficiency when compared with the 3GPP, NYUSIM models, Floating Intercept(FI), Frequency Attenuation ( FA) and has been shown in fig4(c).The NYUSIM channel model is most efficient channel model for the implementation of the efficient channel model.
VI. CONCLUSIONS
The propagation features of the channel are described in this paper for three distinct frequency bands: 19 GHz, 28 GHz and 38 GHz. The performance is analyzed for the channel models viz., 3GPP model, the NYUSIM model, Frequency Attenuation (FA) and Floating Intercept (FI) model. From the results of the simulation, it is found that the choice of channel models has a huge impact on deployment choices and on different channel performance metrics such as spectrum efficiency, probability of path loss and channel eigen values. In an indoor LOS 4] setting, the Floating Intercept(FI), Frequency Attenuation (FA), 3GPP model, NYUSIM models were used to investigate the path loss behavior for the three frequency bands. The signal power obtained at the greater frequency band is found to be more sensitive to the variability of the AOA. In this approach the best channel models for the propagation of 5G mm -Wave are identified though the simulations.
Table-II: simulation results and comparison of channel models and path loss models
Propagation
3GPP Nyusim
Frequency
Floating Intercept
Models
Attenuatio n
Characteristic
s
LOS 9.10
%
17.20
% 8.10% 7%
probability Channel
eigen values 7% 7.46% 2.80% 2.50%
Spectral efficiency
6.70
% 7% 1.80% 2.20%
It is observed that the propagation models are efficient when compared to path loss models Viz., Floating Intercept (FI), Frequency Attenuation (FA).Therefore, it is concluded from the results and from Table-II, By comparison with the 3GPP and path loss models, the NYUSIM channel model has better features for the propagation of mm-Wave bands with frequencies above 6GHz up to 100GHz.
International Journal of Innovative Technology and Exploring Engineering (IJITEE) ISSN: 2278-3075, Volume-8 Issue-12, October 2019
1. shu sun, Theodore s. Rappaport , mansoor shafi , pan Tang, jianhua Zhang” Propagation Models and Performance Evaluation for 5G Millimeter-Wave Bands”, IEEE Transactions ,Year:2018 Pages:8422-8439
2. J. Medbo et al., “Radio propagation modeling for 5G mobile and wireless communications,” IEEE Communication. Mag., vol. 54, no. 6, pp. 144–151, Jun. 2016.
3. S. Rangan, T.S. Rappaport, and E. Erkip, “Millimeter-Wave Cellular Wireless Networks: Potentials and Challenges,” Proc. IEEE., vol. 102, no. 3, pp. 366–385, Mar. 2014
4. T. A. Thomas et al., “A prediction study of path loss models from 2-73.5 GHz in an urban-macro environment,” in 2016 IEEE 83rd Vehicular Technology Conference (VTC Spring), May 2016, pp. 1–5. 5. W. Roh et al., “Millimeter-wave beam forming as an enabling technology for 5G cellular communications: theoretical feasibility and prototype results,” IEEE Communications Magazine, vol. 52, no. 2, pp. 106–113, Feb. 2014.
6. Mohammed Bahjat Majed ,Omar Abdul Aziz and Tharek Abd Rahman “ Channel Characterization and Path Loss Modeling in Indoor Environment at 4.5, 28 and 38 GHz for 5G Cellular Networks” International Journal of Antennas and Propagation
AUTHORSPROFILE
Srinivas Nagula received B.Tech degree from Kakinada Institute of Engineering and Technology which is affiliated to Jawaharlal Nehru Technological University, Kakinada in Electronics and Communication Engineering. At present, Perusing M.Tech in University College of Engineering Kakinada-JNT University, Kakinada with computer and communication Engineering specialization. .
Leela Kumari B received B.Tech from JNT University, M. Tech from Andhra University, Ph.D from JNT University. She has 16 years of teaching experience and is Assistant Professor in JNT University. She has published more than 60 technical papers in National/International Journals/Conference proceedings. Her research interests include Signal processing, State Estimation, tracking and particle filters.