Abstract: Cloud computing is a technology in the field of computing which offer services to the customer from anywhere at any time [1]. In the cloud, resources are shared all around the work for quick servicing to the customer. The aggregation of two terms is referred as cloud computing. The term “cloud” is a pool of different resources offers services to the end customers and “computing” is done based on the Service Level Agreement (SLA) to make the resources efficiently to the customers. Load balancing is an important challenge in the environment of the cloud to increase the utilization of resources [3]. Here we proposed an algorithm which is based on load balancing and service broker policy. We user two representative thin the proposed approach local representative and global representative Local user representative is used to predict the parameters of user task and based on priority it allocate the task to the Virtual Machine (VM). Then for scheduling the task and provide the services to the users based on the available cloud brokers global user representative used Dynamic Optimal Load-Aware Service Broker (DOLASB).we used two scenario with different no. of user requests , in these scenario result of our proposed method is better as compared with the other existing methods in terms s of Execution Time, Makespan, Waiting Time, Energy Efficiency and Throughput.
Index Terms: load balancing, service broker policy, cloud computing, cloudsim
I. INTRODUCTION
Cloud developer, provider and cloud user are three important stake holders of the cloud. Consumers or the customers of the cloud are referred as end customers. The service provider offer resources based on privacy policy, type of instance and type of interface. They utilize the services that are offered by the cloud and infrastructure service, software service, and platform services are used most frequently. User of the cloud services must agree to the service level agreement (SLA) defined by the cloud provider before utilizing the services. There is a requirement of cloud service broker as interface between the cloud resources and cloud service broker in order to share the resources dynamically. Cloud providers offer the private, public and
Revised Manuscript Received on August 05, 2019
Amrita Jyoti (Phd scholar, Janaradan Rai Nagar Rajasthan Vidyapeeth University ,Udaipur), Computer Science & Engineering, ABES Engineering College, Ghaziabad, India.
Dr Shiv Singh Saragdevot, Computer Science, Vice Chancellor of Janardan Rai Nagar Rajasthan Vidyapeeth University, Udaipur, India.
Dr Munesh Chandra, Computer Science & Engineering, National
hybrid cloud to the customers. Private clouds are used by business for their internal purposes. Public clouds are utilized by both the individuals or an organization based on their needs. Hybrid cloud is the integration of both the private and public cloud. It is used for both the internal and external purposes. Finally, the cloud developer organizes and convince the requirements of both the customers and the providers [5]–[8]. It is used for balancing the load in the entire system, scheduling and allocating the resources effectively [10].
II. CLOUDPERSPECTIVES A. Challenges
The challenges in the environment of cloud includes allocation of resources, load balancing, availability and management of data, scalability, interoperability, performance, security, privacy and compatibility. The challenges that are faced is optimization of provisioning virtual network while increasing the revenue in data center network resources. The challenges in load balancing is based on download performance and utilization of storage [11].
B. Technologies
CMLB approach [12] is an efficient load balancing technique for the multimedia application related with cloud. CMLB fully reviews the load of all servers and the conditions of the network and thus attaining reasonable allocation of resources and scheduling. Even though this method is effective, it is not able to use the maximized resources very efficiently in order to maximize the throughput. LBACO [13] is an algorithm which powerfully balance the load of the whole system and the tasks cannot accommodate the heterogeneous processing. Cluster-based load balancing method [14] implement good in heterogeneous nodes and [15] effectively improves the utilization of resources and allocate the resources . Ant colony and network theory [16] method balanced the load efficiently in the distributed system and reviewed the complex networks. This method was used in the open cloud computing.
C. Design Issues
Cloud computing provide several services to the customer. The cloud customer requests
their requirements to the cloud which can be represented in the form of
Efficient Load Balancing and Service Broker
Policy Using Local and Global Representatives
in Cloud Computing
International Journal of Innovative Technology and Exploring Engineering (IJITEE) ISSN: 2278-3075, Volume-8 Issue-10, August 2019
resources. Then the cloud provider will schedule the resources to the server.
There are several design issues related with such systems. Some of them are resource allocation [17], network scalability [18], dynamic allocation of resources [19], maximization of profit and discrimination of price [20], cost [21], scheduling [22], provisioning of resources [23], load balancing [24] etc. Load balancing ensure that the allocation of all computing resources are effectively and fairly , which make sure that not a single node is overloaded. It has become challenge for the cloud provider for solving the issues with the large number of cloud customer [26]. To allocate the resources effectively and properly and to convince the expectation of the customer, several algorithms are used for resource allocation [27].
III. MOTIVATION
Cloud computing is an information technology model which offers high-level efficient services to the cloud customers. The provider of the cloud offers the requested to the customers in the form of pay as you go, model. However, there are several issues in cloud computing like utilization of resources, throughput maximization, decreasing response time, overloading etc. This proposed work mainly focusing on Load balancing and Resource Allocation to overcome these issues. In our work, we are proposing a new algorithm for distribution of the load to improve the performance.
IV. PROPOSEDMETHODOLOGY
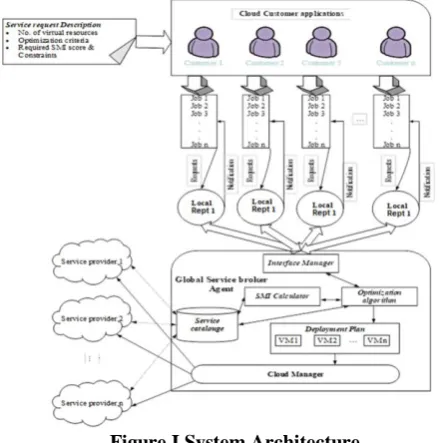
[image:2.595.314.536.51.273.2]In this work, dynamic resource allocation scheme that predict the value of customer requests and selects the best QoS measured host for allocating several resources to a set of tasks so as to minimize task execution times. The proposed cloud brokering architecture consists of customer, multi representative system (local customer representative and global broker representative), and cloud provider. First a multiple Representative system is designed. This system includes a local user representative and global broker representative. The local user representative will organize all the resources using Multi-Representative Deep Reinforcement Learning. The global broker representative will allocate the task for resource utilization using Dynamic Optimal Load Aware Service Brokering scheme. Fig 1 shows the architecture of the proposed method.
Figure I System Architecture A. Local User representative
The prediction will be done at the customer level in local user representative without burdening the global broker representative. The customer will provide a service request description consists of Quality-of-Service (QOS) parameters like accountability, agility, etc and number of VMs required. The local user representative calculate the amount of resources actually used. Every representative has assigned a customer and it used a function to monitor the all requests by that particular customer and after that it creates a resource utilization table and this table is updated after getting the new request.
B. Initial Setup
The cloud computing process contains two sections such as local user representatives, and global user representatives. Local user representative section use multi representative deep reinforcement learning (MRDRL) algorithm. This algorithm is used for predicted the customers information. Than the global user representative section use AIMMS algorithm is used to provide the optical development for the virtual resources in multi clouds. In the local user representative, we reviewed n number of customers, first, the consumers send request to the local user representative section for virtualized infrastructure with service request description. In local representative, number of representative be used i.e.) multi representative. So we use multi representative reinforcement learning algorithm to allocate the resource.
C. Multi Representative Deep Reinforcement learning The Multi representative deep reinforcement learning algorithm is used for Prediction the customer level in local user representative without burdening the global broker representative. This algorithm contain two main components namely primary prediction component, and pattern change detection and matching
D. Primary Prediction and Pattern change Detection Component
The primary prediction component uses the latest recent historical values, both previous environmental behaviour and key environment variables. This enabled the environmental history to provide an estimate future behaviour. These is a hybrid model, it comprising the ANN and ARIMA techniques for strength the time series prediction. The general concept of this techniques achieving higher accuracy consistently than the other type of time series. Then forecast the particular set of length of data’s to the pattern change detection and matching component. For example, the energy demand of the prediction data, the ANN performed in nonlinear data and ARIMA performed in the linear data. This prediction component is mainly used to continuously monitor the different type of data, and switch as appropriate time interval and calculate their accuracy values.
Pattern change detection component is mainly used to detect the forecast predicted data, if the predicted data is failed it provide the accurate predicted data’s. These detection and matching function is performed by two type of techniques such as virtual machine (VM), and energy efficacy of the data’s. The virtual machine detect the data’s based on the priority value. The priority value is measured by how much time the customer data’s run faster than the other customer. The scheduled task of the virtual machine is based on SLA objectives and produce the new predict data. These schedule (PSH) is performed by using three sub algorithms namely VM monitoring, Load balancing, and Pre-estimation. This schedules are used for proper performance and also reduce the SLA violations. In cloud computing the energy efficiency is classified in to power and energy model in the cloud data center. The power consumption is mainly concentrated on the CPU utilization. THE energy consumption is measured based on the power reduction. So, the energy and the power are related to each other to minimize the energy efficiency.
E. Power and Energy Model
The power consumption is measured by the CPU utilization. If the utilization is increased the total power value also increased. The percentage of the power is compared to the server full CPU utilization. Due to these utilization condition, off all the ideal server to increase the power consumption. It contain maximum amount of power consumption, if the CPU. The total energy consumption is measured by adding the data intensive, computation intensive, and communication intensive.
Mainly the energy consumption is reduced by the virtual machine (VM) and the SLA violation is reduced. From this value the percentage of the energy saving is measured.
F. Global Broker Representative
When a task arrives from local user representative outside the Cloud system, Task allocation platform (TAP) decides to allocate it to some host. The steps carried out in the global broker representative:
Cloud providers are ranked based on the SMI attributes using weighted sum model.
Global broker representative selects those providers who convince the minimum SMI score.
An optimal deployment scheme is implemented by the broker representative in order to reduce the infrastructure cost.
Once the best host is selected, then the tasks are assigned in a round robin scheduling fashion. A whale optimization algorithm that selects probabilistically the host who’s measured QoS is the best to minimize the average response time for all tasks. The Global service broker representative section consist of some major issues like Optimization algorithm, SMI calculator, service catalogue, Deployment plan, Cloud provider. The result of the local user representative section is given to the interface manager part. These part will control all the information, unwanted activities, and data’s. The service catalogue is used to filters the data’s and detect the location, dynamic prices and availabilities of cloud services.
G. Optimization Algorithm
In the cloud computing the physical resources of the multi clouds are addressed by using mixed integer programming (MIP). This multi integer programming is also used to minimizing the cost of resource in the multi-cloud. To solve the specified optimization problem, modelling language is used that is AIMMS. The Multi integer programming specification is used in the AIMMS modelling language.
Modelling languages and solutions can be a meeting Specific optimization should be used to solve the problem. Benders decomposition are an approach to solving complexities is dividing them into mathematical programming problems.
H. SMI
The Service Measurement Index is an associated attributes, and critical characteristics are applied to the comparison of cloud services is available in the cloud provider. The SMI is a standard method for calculating any kind of cloud service, the service is based on the technical requirement and critical business. The SMI is divided into seven categories, each categories are refined by three or more attributes. Some attributes are service only in particular clouds, the others are financial and security in the cloud service.
V. EXPERIMENTANDRESULS
International Journal of Innovative Technology and Exploring Engineering (IJITEE) ISSN: 2278-3075, Volume-8 Issue-10, August 2019
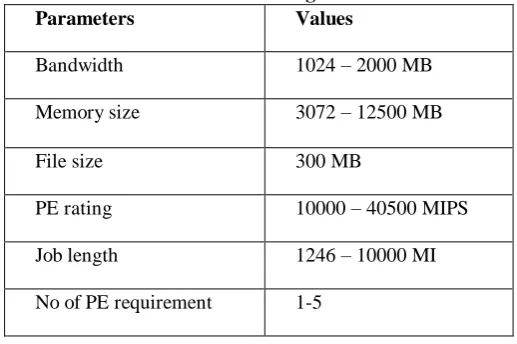
[image:4.595.315.543.47.234.2] [image:4.595.39.298.201.373.2]parameter with roundrobin algorithm and other existing algorithms . System parameter setting is shown by Table 1 and we used two functions Local user representative function and Global broker representative function in our proposed approach and compare with round robin approach by changing the scenarios like here we take two scenarios in one scenario we are taking 10 requests and in other scenario we are taking 100 requests and in both scenario we are using two locations.
Table 1 Parameters Settings For Simulation
Parameters Values
Bandwidth 1024 – 2000 MB
Memory size 3072 – 12500 MB
File size 300 MB
PE rating 10000 – 40500 MIPS
Job length 1246 – 10000 MI No of PE requirement 1-5
Each task carries the information under some attributes, Local user representative have to work on these type of user tasks. Firstly it have to predict user demand based on the history data for this it used MADRL algorithm. Table 2 shows the VM request by the user for scenario 1.
Table 2 The Parameter Of User Request (VM) Number of
VM
Location Sub location
1 1 46
2 1 57
3 1 87
4 1 43
5 1 76
6 2 65
7 2 33
8 2 62
9 2 80
10 2 50
We used seven parameter for each request like accountability, agility etc. Here Table 3(a) and Table 3(b) shows the request generated by the user includes all parameter values.
Table 3 (a): Generated Request With Parameters
request
accoun
tability
agility
assura
nce
Financial
VM1 9.44 0.65 0.33 0.14
VM2 2.54 0.59 0.65 0.96
VM3 3.22 0.17 0.93 0.6
VM4 7.32 0.93 0.81 0.66
VM5 6.21 0.68 0.78 0.5
VM6 1.9 0.92 0.93 0.38
VM7 1.73 0.12 0.64 0.24
VM8 8.25 0.21 0.25 0.68
VM9 1.58 0.86 0.62 0.64
VM10 1.2 0.38 0.86 0.88
Table 3 (b): Generated Request With Parameters request performance security privacy
VM1 0.65 0.22 0.83
VM2 0.72 0.52 0.87
VM3 0.25 0.47 0.47
VM4 0.1 0.97 0.88
VM5 0.52 0.67 0.38
VM6 0.93 0.37 0.53
VM7 0.23 0.46 0.54
VM8 0.76 0.27 0.9
VM9 0.3 0.26 0.94
VM10 0.75 0.3 0.54
[image:4.595.316.543.272.417.2]Local user representative function used the MADRL to predict the customer request and make a list on priory bases. This list works as an input for the global user representative function. Then it used the DOLASB for minimizes the cloud customers cost and then . Table 4 shows the output of the bender decomposition optimal solution in both static and dynamic variables environment.
Table 4: Output Of The Global User Representative For Scenario 1
Number of
VM
Lo catio n (m)
Static Dynamic
iqm
a
CPa
iqm CPVM 1 1 33 442 33 442
VM 2 1 33 442 47 445
VM 3 1 33 442 21 377
VM 4 1 33 442 27 357
VM 5 1 33 442 37 372
VM 6 2 38 445 18 408
VM 7 2 38 445 42 408
VM 8 2 38 445 19 397
VM 9 2 38 445 31 358
VM10 2 38 445 15 395
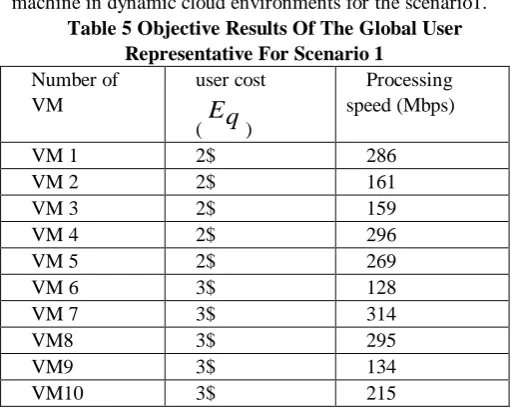
[image:4.595.291.555.521.830.2]machine in dynamic cloud environments for the scenario1. Table 5 Objective Results Of The Global User
Representative For Scenario 1 Number of
VM
user cost (
E
q
)Processing speed (Mbps)
VM 1 2$ 286
VM 2 2$ 161
VM 3 2$ 159
VM 4 2$ 296
VM 5 2$ 269
VM 6 3$ 128
VM 7 3$ 314
VM8 3$ 295
VM9 3$ 134
VM10 3$ 215
VI. COMPARISINWITHEXISTINGTECHNIQUES In this section, we compare the resource utilization, throughput, energy consumption, makespan time, energy efficiency and waiting time of proposed algorithm with other existing algorithms.
A. Makespan
Makspan is also known as completion time which is taken by set of jobs for its complete execution. In the proposed approach it is equal to maximum completion time among all tasks.
Makespan = final execution time –Starting time (1)
589.25
800
0 200 400 600 800 1000
proposed ETVMC
m
a
k
e
s
p
a
n
(s
e
c
)
[image:5.595.314.555.87.273.2]makspan
Figure 2: Comparison Of Makespan Of The Proposed With The Existing Method.
The Fig 2 shows the comparison of makespan for proposed method with existing algorithm. For this figure we used scenario 2 and in these cases, the proposed makespan value (589) is better than the existing method of ETVMC with 800 sec [28]. Here, we can also find that the proposed algorithm performed better when compared with the ETVMC algorithm for all types of workload.
B. Resource Utilization
The cloud infrastructure promises to offer efficient resource utilization for the datacenters, it includes CPU and memory utilization . obviously the workloads increases, as well source utilization also increased. The equation of
resource utilization (ru) is given below:
(2)
99.56
70 73
0 20 40 60 80 100 120
proposed Min-Min Max-min
a
ve
r
a
g
e
c
lo
u
d
u
ti
iz
a
ti
o
n
(%
)
Rresource Utlization
Figure 3: Comparison Of Resource Utilization For The Proposed With The Existing Methods.
Fig 3 shows that that resource utilization of proposed algorithm is 99.56% which is obviously better than the existing roundrobin, Min-Min and Max-Min approach of 79.65%, 70% and 73% respectively[25]. In the scenario 1 resource utilization for roundrobin is 79.89% and for proposed method is 99.86% , which is better.
C. Energy Efficiency
Data center is the most prominent in cloud computing, it contains number of servers servers, cables, air conditioner, network etc. and consumes power and releases huge amount of Carbon-di-oxide (CO2). One of the most important challenge faced in cloud computing is the Optimization of Energy is the most important challenge in cloud computing. Energy efficiency equation is given below,
EnergyEfficiency=
n
i Totalenergyconsumedtoexecutedthoseworkload datacenter a
in executed workload
of Number
[image:5.595.58.295.451.588.2]1 (3)
Figure 4: The Energy Efficiency Of Proposed With The Existing Algorithms.
[image:5.595.310.558.503.693.2]International Journal of Innovative Technology and Exploring Engineering (IJITEE) ISSN: 2278-3075, Volume-8 Issue-10, August 2019
efficiency of proposed method is 32.49% and 27%, 10% and 8% for methods such as ORRA, OLS-OSPE, and EAR-OSPE respectively [9].
D. Waiting Time
A task includes the number of activities, every activity has some waiting time and the average of theses waiting time is known as the waiting time of the task as shows in the Equation (18). Waiting time =
n
j m
j WQ j WP
1 (4) Where WPj is a workload execution starting time, WQj denotes the workload submission time, and m represent the number of workloads.
98.71
182.62
301 297
0 100 200 300 400
proposed RR Min-Min Max-Min
w
a
it
in
g
ti
m
e
(
s
e
c
)
[image:6.595.317.557.54.193.2]Waiting Time
Figure 5: Waiting Time Of Proposed Comparison With The Existing Method.
The waiting time of proposed method is 98.71 sec and roundrobin is 182.62, Max-Min is 299 sec, Min-Min is 301 sec. Performance of the waiting time is varied with the number of tasks increases for three types of algorithms. [4]. Figure 5 shows that the proposed method is better than the existing method in respect of waiting time. In the scenario 1 waiting time is 98.86 sec for proposed and 182.89 for roundrobin.
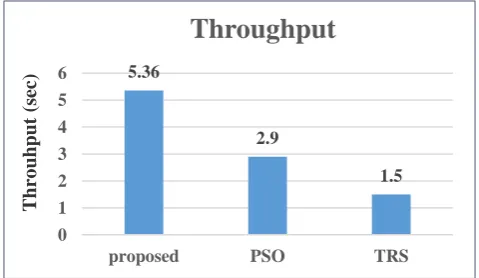
E. Throughput
Work efficiency is same as throughput. The throughput is a performance of tasks by a computing specific period. It can be evaluated by the Equation (11).
Throughput = total execution time/total no. of workload (5)
5.36
2.9
1.5
0 1 2 3 4 5 6
proposed PSO TRS
T
hro
uh
pu
t
(s
ec
)
Throughput
Figure 6: Comparison Of Throughput For The Proposed With Existing Methods.
Figure 6 shows the throughput performance of proposed work which is 5.36 sec comparison with 2.9 sec and 1.5 sec , throughput performance of the PSO (Particle swarm optimization) and TRS (thermal residual stresses) respectively.
F. Execution Time
As increase the throughput of the activity planning, execution time of the proposed model is decreased. This metric is analyzed by the Equation (20).
[image:6.595.59.294.257.395.2](6) Where the m represents is the number of workloads, WAj represent the completion time of workload and WQj is a submission time of workload.
Figure 7: Execution Time Of Proposed Method Compared With Some Other Existing Methods. Fig 7 shows the execution time of the proposed with existing method HYSARC and CMMS (Computerized maintenance management system). In this, the average execution time of HYSARC is 480 sec, CMMS is 500 sec, roundrobin is 120.70 and the proposed method is 121.09. cy. G. Energy Consumption
With the workload increased, the energy consumption is affected. The energy consumption is calculated by equation (32).
[image:6.595.313.560.444.592.2]
PCPmax PCPmin
Ut PCPmin [image:7.595.57.301.125.276.2](7) Were PCmax represent the extreme power consumption at the high load, PC denotes the lowest power consumption in idle mode.
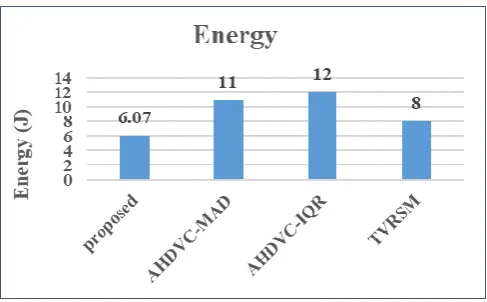
Figure 8: Comparison Of Energy Consumption For The Proposed Method With Existing Methods. Figure 8 shows the energy efficiency comparison of proposed method with the AHDVC-MAD (Adaptive Heuristic for Dynamic VM Consolidation-Medium Absolute Deviation), AHDVC-IQR (Adaptive Heuristic for Dynamic VM Consolidation-Interquartile Range)and TVRSM. The value of DRA is decreased 3.8*10^7 J and the existing method is increased to 5.0*10^7 [2]. The energy consumption value of of proposed method is 6.07 J, and 11J for AHDVC-MAD and 12 J for AHDVC-IQR and 8 J for TVRSM.
VII. CONCLUSION
There are number of parameter used in the local broker representative as the performance metrics for calculation and it used MADRL-DRA algorithm to forecast the activities of the user's request based on the service request description area. Global Broker representative used the output of the local user representative to schedule available tasks between the CP and CU. We used CloudSim platform as simulator for the results and experimental analyses for both the scenarios. We used 10 request in scenario-1 and 100 request in scenario 2 . we can easily find by the Fig [2] to Fig[7] that proposed algorithm is better that the existing methods.
REFERENCES
1. Xu M, Tian W, Buyya R, “A survey on load balancing algorithms for
virtual machines placement in cloud computing, ” Concurrency and Computation: Practice and Experience. vol.29, no.12, 2017.
2. Zhu, W., Zhuang, Y., & Zhang, L. (2017). A three-dimensional virtual
resource scheduling method for energy saving in cloud computing. Future Generation Computer Systems, 69, 66-74.
3. Muthulakshmi B, Somasundaram K, “A hybrid ABC-SA based optimized
scheduling and resource allocation for cloud environment”. Cluster Computing. pp. 1-9, 2017.
4. Jiang, D., Xu, Z., Liu, J., & Zhao, W. (2016). An optimization-based
robust routing algorithm to energy-efficient networks for cloud computing. Telecommunication Systems, 63(1), 89-98.
5. M Katyal, A Mishra, "A comparative study of load balancing algorithms in
cloud computing environment". arXiv preprint arXiv:1403.6918, 2014.
6. Q Zhang, L Cheng, R Boutaba, "Cloud computing: state-of-the-art and
research challenges". Journal of internet services and applications, vol.1, no. 1, pp.7-18, 2010.
7. Kaneria, RK Banyal, "Analysis and improvement of load balancing in
Cloud Computing", InICT in Business Industry & Government (ICTBIG), International Conference, IEEE. pp. 1-5, 2016.
8. S Ray, A De Sarkar, "Resource allocation scheme in cloud infrastructure",
In Cloud & Ubiquitous Computing & Emerging Technologies (CUBE), 2013 International Conference, IEEE. pp. 30-35, 2013.
9. Gupta, I., Kumar, M. S., & Jana, P. K. (2018). Efficient Workflow
Scheduling Algorithm for Cloud Computing System: A Dynamic Priority-Based Approach. Arabian Journal for Science and Engineering, 1-16.
10. C McMillen, KN Stubbs, PE Rybski, SA Stoeter, M Gini, NP
Papanikolopoulos, "Resource scheduling and load balancing in distributed robotic control systems". Robotics and Autonomous Systems. Vol.44, no.3-4, pp.251-9, 2003.
11. FF Moghaddam, M Ahmadi, S Sarvari, M Eslami, A Golkar, "Cloud
computing challenges and opportunities: A survey". In Telematics and Future Generation Networks (TAFGEN), 2015 1st International Conference, IEEE. pp. 34-38, 2015.
12. H Wen, Z Hai-ying, L Chuang, Y Yang, “Effective load balancing for
cloud-based multimedia system". In Electronic and mechanical engineering and information technology (EMEIT), 2011 international conference, IEEE. Vol. 1, pp. 165-168, 2011.
13. Lal A, Krishna CR, “Critical Path-Based Ant Colony Optimization for
Scientific Workflow Scheduling in Cloud Computing Under Deadline Constraint”. In Ambient Communications and Computer Systems, pp. 447-461, 2018.
14. Guddeti RM, Buyya R, “A Hybrid Bio-Inspired Algorithm for Scheduling
and Resource Management in Cloud Environment”. IEEE Transactions on Services Computing. 2017.
15. Z Xiao, W Song, Q Chen, "Dynamic resource allocation using virtual
machines for cloud computing environment". IEEE transactions on parallel and distributed systems, vol.24, no.6, pp.1107-17, 2013.
16. Z Zhang, X Zhang, "A load balancing mechanism based on ant colony and
complex network theory in open cloud computing federation". InIndustrial Mechatronics and Automation (ICIMA), 2010 2nd International Conference, IEEE, Vol. 2, pp. 240-243, 2010.
17. ST Maguluri, R Srikant, L Ying, "Stochastic models of load balancing and
scheduling in cloud computing clusters", In INFOCOM, 2012 Proceedings IEEE, pp. 702-710, 2012.
18. X Meng, V Pappas, and L Zhang, "Improving the scalability of data center
networks with traffic-aware virtual machine placement,” In INFOCOM, 2010 Proceedings IEEE, pp. 1-9, 2010.
19. YO Yazir, C Matthews, R Farahbod, S Neville, A Guitouni, S Ganti, Y
Coady, "Dynamic resource allocation in computing clouds using distributed multiple criteria decision analysis, " In Cloud Computing (CLOUD), 2010 IEEE 3rd International Conference, IEEE, pp. 91-98, 2010.
20. K Tsakalozos, H Kllapi, E Sitaridi, M Roussopoulos, D Paparas, A Delis,
"Flexible use of cloud resources through profit maximization and price discrimination," In Data Engineering (ICDE), 2011 IEEE 27th International Conference, IEEE, pp. 75-86, 2011.
21. U Sharma, P Shenoy, S Sahu, A Shaikh, "A cost-aware elasticity
provisioning system for the cloud, " In Distributed Computing Systems (ICDCS), 2011 31st International Conference, IEEE, pp. 559-570, 2011.
22. Yang J, Jiang B, Lv Z, Choo KK, “A task scheduling algorithm considering
game theory designed for energy management in cloud computing, ” Future Generation Computer Systems. 2017.
23. S Khatua, MM Manna, N Mukherjee, "Prediction-based instant resource
provisioning for cloud applications, " In Proceedings of the 2014 IEEE/ACM 7th International Conference on Utility and Cloud Computing, IEEE Computer Society, pp. 597-602, 2014.
24. J Grover, S Katiyar, "Agent based dynamic load balancing in Cloud
Computing,” In Human Computer Interactions (ICHCI), 2013 International Conference, IEEE, pp.1-6, 2013.
25. Somu N, Kirthivasan K, VS SS. A computational model for ranking cloud
service providers using hypergraph based techniques. Future Generation Computer Systems. 2017 Mar 1;68:14-30.
26. R Kaur, P Luthra. "Load balancing in cloud computing,” In Proceedings of
International Conference on Recent Trends in Information,
Telecommunication and Computing, ITC, 2012.
27. Tafsiri SA, Yousefi S. Combinatorial double auction-based resource
allocation mechanism in cloud computing market. Journal of Systems and Software. Vol.137, pp.322-34,
International Journal of Innovative Technology and Exploring Engineering (IJITEE) ISSN: 2278-3075, Volume-8 Issue-10, August 2019
28.Mishra SK, Puthal D, Sahoo B, Jena SK, Obaidat MS. An adaptive task
allocation technique for green cloud computing. The Journal of Supercomputing. 2018 Jan 1;74(1):370-85.
AUTHORSPROFILE
Amrita Jyoti ,Ph.D. research scholar Janaradan Rai nagar Rajasthan Vidyapeeth, Udaipur, Rajasthan India and presently working as Associate professor in ABES Engineering College, Ghaziabad Uttar Pradesh, India. She received her B.Tech. degree in Information Technology from Kurukshetra University, India in 2003 and M.Tech. in Computer Science & Engineering from the Dr. A. P. J. Abdul Kalam Technical University, Uttar Pradesh, Lucknow, India in 2011. In 2005, she joined the Department of Computer Science & Engineering, ABES Engineering College, Uttar Pradesh, India as a lecturer and became an associate professor in 2015. She is the author of a Book ‘‘Title: Data compression’’ which has covered all the techniques of compression in text, audio and video. Her current research area include software Engineering, software testing, data compression, data structure, JAVA and cloud computing. She published many research paper in National and International Journals and presented many papers in various National and International Conferences.
Prof. Shiv Singh Sarangdevot is the Vice Chancellor of Janardan Rai Nagar Rajasthan Vidyapeeth University, Udaipur and Executive President, All India Association of Vice Chancellors and Academicians. He has an experience of more than 30 years in teaching and more than 20 years in research. His current research areas include software Engineering, Internet and E-commerce, networking, Artificial Intelligence , ERP and SAP. He has published 10 text books and many research papers publications in different International Journals and in Proceedings of International Conferences of repute. He has guided more than 35 PhD candidate and more than 50 MCA, M. Tech. and M. Phil candidates. He has received numerous awards including Honoured by Vidya Pracharini Sabha in the year 2010 and 2013 for academic contribution and Best Teacher Award by “Dainik Bhaskar” in the Year 2007-08. He has delivered numerous invited and plenary conference presentations and seminars throughout Country and chaired the technical sessions in International and national conferences in India.