1-1-1980
Development of a helium-neon laser based flow
cytometer for evaluation of particulate matter
Sham Persaud
Iowa State University
Follow this and additional works at:https://lib.dr.iastate.edu/rtd Part of theEngineering Commons
This Thesis is brought to you for free and open access by the Iowa State University Capstones, Theses and Dissertations at Iowa State University Digital Repository. It has been accepted for inclusion in Retrospective Theses and Dissertations by an authorized administrator of Iowa State University Digital Repository. For more information, please [email protected].
Recommended Citation
Persaud, Sham, "Development of a helium-neon laser based flow cytometer for evaluation of particulate matter" (1980).Retrospective Theses and Dissertations. 18739.
"X
SU.
1q 0
f
~ 3c .3
by
Sham Persaud
A Thesis submitted to the
Graduate Faculty in Partial Fulfillment of the Requirements for the Degree of
MASTER OF SCIENCE
· Major: Biomedical Engineering
Signatures have been redacted for privacy
Iowa State University Ames, Iowa
1980
TABLE OF CONTENTS
INTRODUCTION LITERATURE REVIEW SYSTEM DESCRIPTION
Overview Flow Chamber Light Source Input Beam Optics
Photomultiplier Tube and Associated Electronics Power Supply and Associated Circuitry
Anode Circuit
EXPERIMENTAL MATERIALS AND METHODS RESULTS
DISCUSSION
SUMMARY AND CONCLUSIONS
Flow cytometry, using laser illumination, is becoming an increasingly popular tool in cel l research and clinical medicine for measuring parame-ters such as cel lul ar DNA content, RNA content, cell and nuclear size, light scatter, and fluorescence anisotropy. These parameters are usually displayed as either one or two dimensional histograms. In many patholog-ical conditions, neoplastic cells may be recognized by optpatholog-ically measur-able changes in constituent substance and not the presence or absence of a parti cular substance. For instance, malignant cells show an increase in nuclear fluorescence due to the increase in DNA material. From an experi -mental viewpoint, flow systems utilizing light scatter technique, are par-ticularly attractive, since neither staining nor fixation is required, thus requiring a minimal amount of preparation time. From a clin ical standpoi nt, flow systems offer the advantages of high speed analysis, uni que statistical precision and sensitivity, routine measurements not previously possible on large number of cel l s within a population, the re-duction of slide-relat ed artifacts, and t he capability of studying viabl e cells which can be reused.
how many parameters are measured. Much information about the size and internal structure of unstained and unfixed biological cells and other mi -croscopic particles can be obtained from the light-scattering properties alone (1,2).
In most flow systems, some type of sheath flow configuration is used to align the cells for exposure to the exciting light. Sheath-flow is generally established within a suitable flow-cell with the carrier or sheath fluid representing the bulk of the flow. The cell suspension i s injected along the axis of a converging and accelerating sheath of cell -free fluid at a point where the fluid velocity is low. Just prior to en-tering the illuminating and viewing area, the entire flow moves through a constriction orifice which narrows the total flow and core (cell stream) such that the cell stream is small (usually about 20 micrometers) as it intersects the laser beam.
This thesis describes the development of an economical sheath-fl ow chamber made almost entirely out of Plexiglas (Rohm and Haas,
LITERATURE REVIEW
Over the years, many attempts have been made at automating cytologi -cal examination of human exfoliative material, all geared towards clini-cal diagnosis. Through the use of automation, normal samples can be screened and the ever- increasing workload of the cytotechnologists and pathologists who are primarily responsi ble for these diagnostic evaluations can be re-duced, thus leaving them with more time to spend on the proper evaluation of the abnormal samples which may dictate treatment or surveillance of the patients by their clinicians.
Image analysis and flow system analysis are the two main approaches to automation in cytology. In the first instance, cells are affixed to micro-scope slides, stained, and examined optically by trained human observers or by pattern recognition computers which have the capability of providing large amounts of information on each individual cell in a population. The power of thi s method lies in the ability of the computer software to ex-tract sufficient information to make important and unique distinctions be-tween cells. In flow systems analysis, the emphasis is on speed. This consequently decreases the resolution compared with the slower, high reso-lution image analysis. In flow systems, cells in a constrained stream are made to flow at relatively high speeds past one or more detectors arranged strategically at different angles with respect to the incident illumination
beam. In the case of fluorescent studies where the specimen is labelled with a fluorescent stain specific for the cell or organel le of interest, the detectors are often placed at 90° with respect to the exciting
from the main beam-trap, and to minimize blocking requirements of barrier filters. The fluorescent light emission occurs at a longer wavelength than the incident light, whereas in light scatter studies, the incident light experiences no appreciable change in wavelength, thus the detectors are placed at various angles depending upon the parameter being measured.
The scattering of light by cells in flow systems has been used to de-termine their size (1,4), to differentiate viable from nonviable cells (5) and to distinguish between cell types (6). The total light scattered by a cell and the angular distribution of this light are related not only to the cell and nuclear diameters but also to smaller organelles, and to the re-fractive indices of the various cellular constituents (7). Cells with axial syrrunetry about the direction of flow will yield the same signal upon rota-tion around that axis; however, asymmetrical cells, such as epithelial and red blood cells, may produce a scatter signal that is dependent upon their orientation (8,9).
Whenever light impinges upon a cell, it may not be completely absorbed but partially deflected (scattered) by the processes of reflection, refrac-tion and diffracrefrac-tion with the observed light dependent upon the size and refractive index distribution of the cell, the refractive index of the me-dium, the wavelength of the incident light and the angle of observation.
effect on scattering .
Refraction is the phase shifting and bending of the rays due to the different relative index of refraction for t he nucleus, cytoplasm and the surrounding medi um .
The presence of a particle in the beam of light perturbs the elec-tromagnetic fi eld of the light wave . This disturbance at the edge of the particle is called diffraction. This spreads light to some extent into the region that i s not directly exposed to the oncoming wave . The general features of diffraction are described by Huygens' principle (10) .
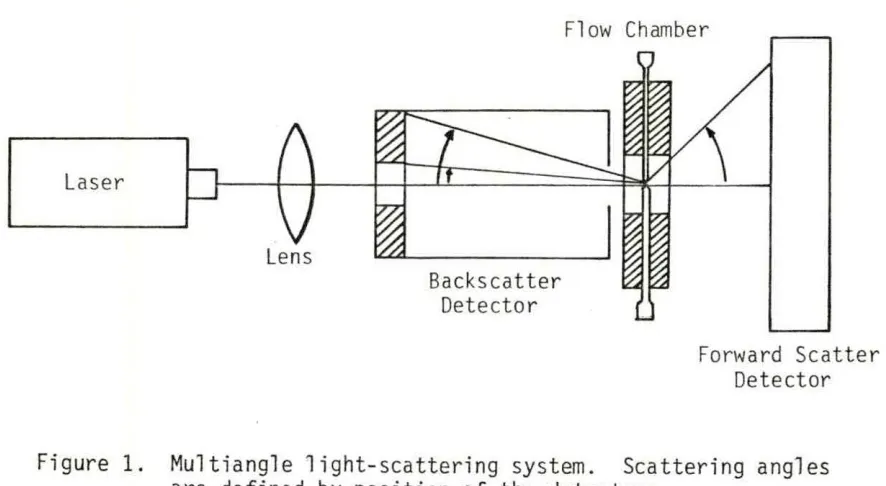
The angle of measured light-scatter is determined by the position of the detectors. In the multiangle light scattering system shown in Figure 1 (11), light scattered from single cell s can be col l ected simultaneously at up to 32 angl es in the forward direction between 0° and 21° , and i n the backward direction between 175° and 177° .
Laser
Lens
Backscatter Detector
Flow Chamber
Forward Scatter Detector
[image:9.560.53.496.442.685.2]Light scattered in the forward direction is dominated by diffraction processes; thus, the intensity of light scattered at small angles (0.5-2°) dominates the observed intensity distribution, and is indicative of the size of the scattering particle (1). Scattering at intermediate angles
(5-80°) is principally due to refraction and to a lesser extent diffraction and yields information about internal architecture, while very large angle scattering (90-180°) is mostly reflection from the surface or from internal surfaces where the index of refraction changes. For a thorough treatise on the complex phenomenon of light scattering, the interested reader is re-ferred to the text by Kerker (12) and review articles by Wyatt (13) and Brunsting and Mullaney (2).
Flow cytometry has been under development since the middle 1950s from an effort initially intended to count and later to size particles. Many of these prototype systems evolved into sophisticated analytical tools for rapidly quantitating multiple chemical and physical properties of the in-dividual cells or cellular constituents of inhomogeneous populations. During most of this time, efforts were directed primarily toward the devel-opment of new and improved instrumentation . A brief historical review of the significant developments in automated cytometry follows.
An early attempt to count cells in suspension started in the 1930s
and 1940s (14). This method, known as 11turbidimetry11 used a photoelectric
device to measure light transmission through a suspension of cells. The major limitation was that the measurements were influenced by anisocytosis
(variation in cell size).
suspen-sion were forced through a fine capillary tube located on a microscope stage and each passing cell was counted by a photoelectric apparatus at-tached to the ocular. The experiment was unsuccessful due to difficulties encountered in focusing of cells in the capillary tube, cell clumping, and lack of sensitivity in the phototube system.
A few years later, Gucker et al. (16) developed a photoelectronic counter utilizing flashes of light scattered by colloidal particles trav-ersing a small space under dark-field illumination. The apparatus con-sisted of (a) a chamber in which a stream of very dilute smoke passed through an intense light beam, scattering flashes of light forward onto a photomultiplier tube, (b) a pulse amplifier and (c) a trigger circuit which actuated a mechanical counter. The device was successfully tested with uniform particles (dioctyl phthalate) of diameter down to 0.6 micrometer and with aerosols of ellipsoidal spores (Bacillus sp . ) averaging about 0.8 x 1.2 micrometers.
A year later, Lagercrantz (17) constructed a photoelectric apparatus for counting individual microscopic cells in fluid suspension by using the capillary tube method (15) and dark-field illumination. It was unsuccess-ful due to light reflection from the capillary tube into the microscope objective lens, causing loss of dark background and thus creating a low signal-to-noise ratio in the optophotoelectric measurement system. It was also difficult to force cells through the capillary tube which had the same size as the cells to be counted. By increasing the capillary tube size, the probl em encountered was focusing of the cells (as seen in the work of Moldavan in 1934). Even though the experiment was unsuccessful,
dilute suspension of cell, was moved with respect to the objective, dis-tinct light signals were obtained. This observation was the initiation of the scanning method from which numerous automatic scanning techniques have evolved .
In 1953, Crosland-Taylor (3) applied the laminar sheath flow principle first described by Reynolds (18) in 1883 to design a chamber for optical counting of red blood cells. An aqueous suspension of cells was slowly injected into a faster stream of fluid flowing in the same direction; the latter provided a laminar sheath surrounding and aligning the particles. This system pennitted the single-fil e alignment of cells in a rapidly flowing fluid, and it did not use a "mi nute" orfice which tended to clog very easily. It was not until a decade later that the potential of this device was recognized and utilized . Almost all flow cytometry instruments today make use of the sheath-flow principle described by Crosland-Taylor.
An electri cal technique for high speed cell counting and sizing of microscopic particles was reported by Coulter (21) in 1956 . Th is became the basis for the first viable flow analyzer. Individual particles sus-pended in an el ectrolyte, typically saline, were made to flow through a constricted orifice by a suction pump . Depending on the particle size, the orifice diameter ranged from 30 to 300 micrometers . An adjustable constant current source was connected on either side of the orifice . Each particle passing through the orifice momentarily impeded the flow of current, there-by creating a voltage change between the electrodes. After suitable ampli-fication, these voltage pulses were amplified and tallied electronically as cell counts. Since its invention, the Coulter automatic cell counter has been used extensi vely by different groups of researchers for volume deter-minations of cells ranging from bacteria (22) to various cell types (23,
24,25). These researchers concluded that the amplitude of the voltage pulses generated by the passage of a particle through the Coulter aperture was linearly related to the particle volume as proposed earlier by
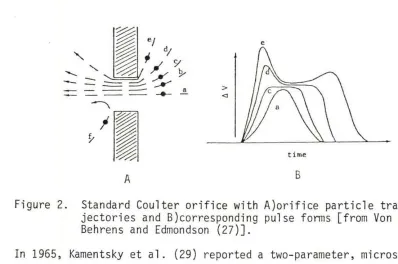
Kubitschek (22) . About a decade later, Kachel (26) found that the height and shape· of the voltage pulses were dependent on the applied constant current, the geometrical dimensions of the orifice, el ectrical conductivity of the suspending medium and the particles, the shape of the particles and lastly, the trajectory of the particles in the orifice. Identical spheres having different trajectories gave voltage pulses of different shapes and durations (27) as shown in Figure 2. Axially focused particles (trajectory a of Figure 2 A) were subjected to the highest accelerations, had the
Figure 2 B). Relative to these pulse forms, those particles with more peripheral trajectories (the edge trajectory e) were distorted and resulted
in overestimation of relative particle volume (pul ses c to e). Similar results were obtained by an optical time-of-flight cel l sizing method (28) . This is probably due to the Gaussian nature of the intensity across the
incident laser beam.
%
~
e/ e"'
~
d;, / Y'
'
~
"'-. / Jr
-
- - -
::: ..::::::= ::::::::.:_...---+- ~ >
-
-- --
<l~
I
~
y
~
~
timeA B
Fi gure 2. Standard Coulter orifice with A)orifice particle tra-jectories and B)corresponding pul se forms [from Von Behrens and Edmondson (27) ] .
[image:14.560.57.455.227.491.2]arc light source focused on the flow chamber by a condenser. Two photo-multiplier tubes were arranged to measure light absorption and light
scatter from the stream. The oscill oscope display pattern of neoplastic cel l s showed considerable variation from nonnal cel l s. Cancer-cell sus-pensions from tumors consistently showed cell s with higher absorption at 253. 7 nm when plotted against the light scatter signal.
a Coulter Counter {Coulter Electronics, Inc., Hialeah, FL) and by direct measurements of cell size by light microscopy. However, in cases where
it was necessary to fix cells, light scatter results were more reliable than Coulter distributions due to the fixative which altered the electrical properties of the cell without producing a significant cell size change . They also found that small angle light scattering from several opaque samples showed no difference in observed scatter signal from transparent spheres of the same diameter, confirming that diffraction was the main scattering mechanism .
Fluorescent techniques, which paralleled the development of light scatter, had their beginning in the early 1950s with the development of a scanning apparatus for the differential detection of cancer cells prepared on microscope slide (32). The potential of thi s technique was not realized until approximately two decades later . In many biological applications to date, the emphasis is on fluorescent technique coupled with light scattering signatures to identify different cell types. For example, acridine dyes, especially acridine orange, have been widely accepted as fluorescent stains for nucleic acids in fixed plant and animal cells. Since this research study involves light scatter rather than fluorescence, the author will not delve into the theory of fluorochrome stains nor the detailed development of fluorometers. However, the avid reader is referred to the multiauthored text, FLOW CYTOMETRY AND SORTING (33) for more specific information on the cytochemistry of fluorochromes and its myriad of applications in cell biol -ogy, immunol-ogy, hematology and oncology.
improve-ment of the system described by Van Dilla et al. (30). The chamber design was basically the same but the light focusing and collecting optics were different from those used by Van Dilla et al . (30) . Instead of a simple 20 cm focal length lens, the laser beam was focused to an elli ptical cross section at the cel l stream by two cylindrical l enses of focal length 2 and 20 cm. The collecting optics consisted of a f /1 .6 projection lens, a glass filter to block scattered light, followed by a similar second pro-jection lens to focus the fluorescent li ght on a 200 micrometer pinhole. After passing through the pinhole, the li ght was made parallel by a small collimating lens and a prism was used to reflect the light on the phot o-cathode of the photomul tiplier. Single-cell suspensions were stained with a fluorescent dye speci fi c to the cel lul ar component of interest. Instru-mental quality was demon strated by measuring the fluore scence distribution of uniform 12 micrometer fluorescent plasti c microspheres and was found to be capabl e of resolving two populations of microspheres differing in fluo-rescent intensity by 10%.
Later that year, Mullaney and West (35) reported a dual-parameter flow microfl uorometer to simultaneously measure the l ight scattering and
fluo-rescence of stained mammalian cell s. The flow chamber was of the same design reported previously by Mullaney et al. (31). Fluorescent light was detected at 90° to t he incident beam by a photomultiplier tube, and light scattered in t he forward direction was focused onto a phototube. The in-strument offered t he possibility of improved signa l -to-noise ratio on weak-ly fluorescent sampl es such as t hose occurring in immunofluorescent
cell identification.
Identification of discrete classes of normal human peripheral lympho-cytes by multiparameter flow analysi s was reported by Steinkamp and Romero
(36) . Human leukocytes stained with acridine orange were separated into four groups consisting of granulocytes, monocytes and two types of lympho-cytes. Identification was on the basis of green/red fluorescence ratio measurement which characterized nucleus and cytoplasmic staining proper-ties.
A new high speed instrument for multiparameter analysis and separation of cells and subcellular particl es under computer control was reported by Arndt- Jovin and Jovin (37) . Like previous instruments, the new instrument
incorporated a laser source for excitation of fluorescence and scattered light, a coaxial flow of particles and sheath fluid and the process of drop generation. However, the electronics enabled the multiparameter usage of up to 10 simul taneous signal s. Five independent analog channels with a corresponding number of totally i nterchangeable sensors (detectors) were avai labl e for observation of particle fluorescence, light scattering, light absorpti on and excitation i ntensity. Finally, the i nstrument incor-porated on-line computer control of data acquisition and analysis, data storage and di splay, and drop charging for five sorting categories .
Mansberg et al . (38) reported the commercially available Hema log
D
(Technicon Instruments Corp., Tarrytown, NY) system which performed auto-matic different ial whi te cell counts utilizing the principles of
sample compared to conventional manual methods of 100 leukocytes per sample by trained technicians. The decision logic classified i ndividual cells based on size and intensity of staining as they flowed past detec-tors designed to measure light loss and light scattering simultaneously. The flow cell was fabricated of stainless steel components and optically flat glass windows. Sheath flow was used to constrain the stream from the effluent man ifold from 250 micrometers to 60 micrometers. The system in-corporated three flow chambers with separate optical configurations. How-ever, there was a single tungsten halogen lamp acting as a common light source for the three optical systems. Thi s system has the advantage of processing large number of cell s in a short time span . The precision makes acquisition of sequential data on a single patient (as in cancer patients undergoing chemotherapy) more meaningful and diagnostically valuable.
In 1975, Salzman et al. (39) found that unstained leukocytes can be classi fied into distinct morphologic types based on a measurement of li ght scattered by each cell at two different angles. A phototube was positioned one degree from the laser beam to measure the intensity of light scattered by a cell in the forward direction, and a photomultiplier tube was used to collect light scattered from a cell at 90°. The data were analyzed by a two-parameter pu l se-height analyzer. Three distinct cell types consisting of lymphocytes, monocytes and neutrophils were identified .
to the laser beam axis. Because the detection rings span 180° in azimuth-al angle, the rings were not sensitive to cell rotation about the detector axis. The scatter pattern for each cell was transferred to a computer. The data indicated that a gynecological specimen diagnosed as invasive carcinoma could be distinguished from a normal gynecological specimen based only on the angular distribution of light scattered ·by individual cells.
In 1975, Eisert et al. (40) developed a simple particle analyzer using a modified, high speed, fl ow-through technique and absorption measurements of a continuous helium-neon laser beam. Size distributions of stained and unstained eel 1 s were derived from the pulse-shape analysis and the inte-gration of absorption pulses. Cells ranging from 5 to 300 micrometers could be analyzed without altering or changing the flow chamber.
A flow cytometer for high efficiency light collection was reported by Skogen-Hagenson et al. (41). The chamber, an ellipsoid of revolution, was machined in two halves from solid brass and nickel-plated with a flash of gold for increased reflectivity. With this type of design they were able to collect ·about 60% of the total cell fluorescence for analysis compared to about 2.5% for conventional flow systems. Orientation and shape of particles apout the flow axis were not as crucial as in earlier flow sys-tems.
focusing. A photomultiplier tube was mounted on the eyepiece of the bin-ocular of the microscope. Sample flow rates on the order of 103 cells] second could be analyzed. Pulses from the photomultiplier tube were fed to a multichannel analyzer which consistently yielded DNA histograms with a coefficient of variation below 1.0%.
A new flow cytometer for detection and discrimination of individual viruses based on differences in their light scattering was reported ·by Hercher et al. (43). The chamber was of an orthogonal configuration with the sample flowing downward along the vertical axis and with illumination and collection optics along the horizontal axis. The light employed was a 1 watt continuous wave argon-ion laser which was focused such that the beam was 10 times greater in diameter than the cell stream in order to ex-pose particles regardless of their position within the stream. A tapered quartz capillary tube served as the chamber and the sample stream, which was driven by a microliter syringe pump, was confined to a small stream by deionized water which served as the sheath fluid. The sample stream
diameter could be varied between 2 and 20 micrometers. The capillary was enclosed by a water-filled chamber having a single drain outlet directly below the capillary tip. Both fluorescent and scattered light signal~ .. :~ou.ld
by a fluorescent signal, better discrimination could be made between
SYSTEM DESCRIPTION
Overview
The most crucial part of the system is the flow chamber which is used to confine cells in the central part of the flow stream for exposure to the laser beam which is focused to a point source on the cell stream by means of a spatial -filter and-a spherica-1-lens. Cells traversing the fo-cused beam cause the light to be scattered in all directions. Light scattered in the forward direction is captured by a photomultiplier tube which has its photocathode in close proximity to the chamber. The pulses are amplified and fed into an oscilloscope for observing and photograph-ing. A diagram of the entire system appears in Figure 3.
Fl ow Chamber
Flow chambers are classified as either "closed" or "jet-in-air" flow systems. The earlier flow chambers described by Van Dilla et al. (30), Mullaney et al. (31) and Holm and Cram (34) were "closed" systems wherein
the measurement region is completely surrounded by a liquid medium. Sim-pler jet-in-air flow systems have become popular as a result of work by Bonner et al. (44) using a single laser beam to intercept the stream in air. Since their introduction, jet-in~air systems have been used
exten-sively to rapidly identify and separate functionally distinct groups of viable cells based on their 1 ight scattering characteristics or fluores-cence intensities or a combination of both.
25]1m
, .... I __
~~-~-~~
_
_.p-1--10
"\...I
Microscope ' Objective
E.M.I. 9502B PHOTOMULTIPLIER
TUBE k:~=----+-1 Amp 1 i fi er
Anode
o I
l-3ocm-i---55cm--- ·Beam-trap
Fiqure 3. Schematic diagram of the flow system.
The he 1 i um-neon (He-Ne) 1 as er is focused by an
achromatic lens to a roint source whjch was slightly defocused in the flow chamber. Light scatter is ... co 11 ected by the photomu lti p 1 i er tube and the
its suggested superior sensitivity and resolution over a cell stream jetted in air (45). The chamber des i gn was a variation of the coaxia1 flow system originally developed by Crosland-Taylor (3) for counting red blood cell s . By hydrodynamic focusing, cells are confined to the flow stream without mixing with the surrounding sheath of distilled water or saline solution . This helps to keep particlul ate material away from the walls, minimizes clogging of the aperture, and forces the cel ls to move in almost identical trajectories at uniform speeds through the focal spot of the intense beam. In this way, each cel l can receive uniform illumi-nation during its transit time across the beam.
The chamber is fabricated almost entirely of Plexiglas with stain-less steel hypodermic needl es used for stream ports . It consists of three sections, namely front, middle and back plates, all of which are made from 3/8 inch (approximately 9.0 mm) thick Plexiglas . The front plate (5 .2 x 5. 2 cm) has a wi ndow (5 x 10 mm) in the center to permit the laser beam to intercept the cell stream. The inner side of this plate was machined to accommodate a glass microscope slide over the window to prevent attenuation and diffusion of the beam, and of course, loss of fluid from the chamber.
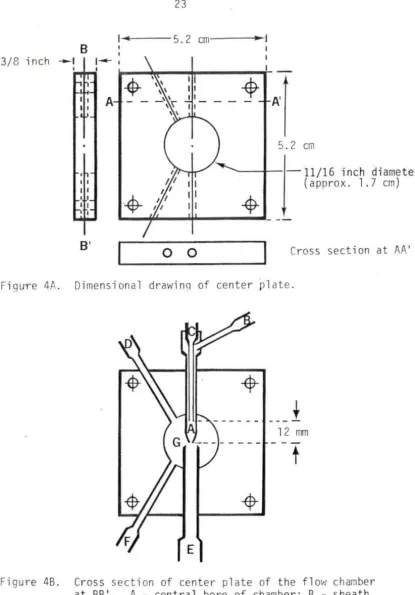
The center plate (5.2 x 5.2 cm) diagrammed in Figure 4 represents the main component of the chamber; i t houses the sample-sheath coaxial assembly, debubbler, exit and cleaning ports . The center of this pl ate was drilled out to a 11/16 inch (approximately 1.7 cm) diameter .
5. 2 cm
B
3/8 inch
___
,
II I A
-+
A'l
-It
5. 2 cm
1-11/16
inch diameterI I (approx. 1 .7 cm)
I I
~
B' 0 0 Cross section at AA '
Fi gUTe 4.A .. Dimensional drawinq of center plate.
12 mm
t
Figure 4B. Cross section of center plate of the flo111 chamber at BB '. A - centra l bore of chamber ; B - sheath entry port; C - sample inl et port; D - debubbler;
[image:26.560.76.491.44.639.2](A in Figure 4) is swaged at the tip to reduce the internal diameter (0 .8. mm).. .. In thi·S· case ,.-theAnterna l·--diameter>ilfter~swaging-measures-~-,
approximately 200 micrometers with the tip tapered for approximately 4 mm from the end of the needle. The other 18 ga. needle (sheath-entry port, B in figure 4) was epoxied to the plastic holder of the swaged needle at an angle of approximately 45°. Finally, the 27 ga. needle (sample-inlet port, C in Figure 4) is inserted into A until both needle holders were in close contact, and were epoxied. The distance between the tip of A and the tip of C is 12 mm as shown in Figure 4. On the same side of and adjacent to the coaxial assembly is the debubbler (D in Figure 4) posi-tioned at approximately 45° to the tip of the coaxial assembly. The debubbler is used to remove air bubbles from the chamber by applying slight negative pressure with a small tuberculin syringe. The exit port (E in Figure 4) is carefully aligned on the side of the chamber, opposite the coaxial assembly such that the 2 mm space between the input and exit ports is in the center of the chamber. To facilitate cleaning and drain-ing of the chamber, another drain (E in Figure 4) positioned at approxi-mately 45° to the main exit port is installed such that the tip is at the periphery of the chamber. All of the ports are held in position with 5-minute Devcon (Devcon Corp., Danvers, MA) epoxy.
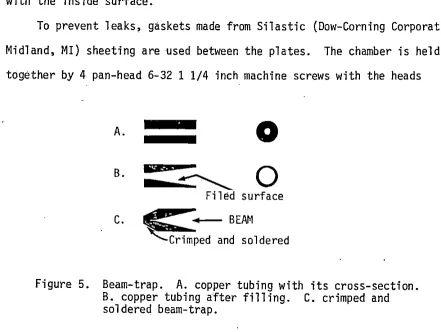
The back plate (10.4 x 5.2 cm) serves as the viewing window for the photomultiplier tube and the mounting bracket for the chamber. In addi-tion, it houses the beam-trap which is made from 1/8 inch (outside diam-eter) copper tubing.
scattering angle detectable, which in this case is approximately 23°, it is made as small as possible. Flaring the tubing obviously increases tube size which consequently, was found to decrease the collection angle and the amplitude of the detected signals. Instead of flaring, the inside
of the 1/8 inch copper tubing was filed with a tapered file,as shown in Figure 5. The entrance of the beam-trap after filing measured 3 mm. The narrow end of the 8 mm long tubing was crimped and soldered, and the
inside was sprayed with flat black paint to reduce reflections from the beam. A partialholeto accommodatethebeamtl"ap was drilled in the -center-of the-inside-back plate in the center of the space between the sample entry and exit ,ports of the center plate. The beam-trap was then carefully tapped into the snug fitting clearance hole until it was level with the inside surface.
To prevent leaks, gaskets made from Silastic (Dow-Corning Corporation, Midland, MI) sheeting are used between the plates. The chamber is held together by 4 pan-head 6-32 1 1/4 inch machine screws with the heads
A.
0
B.
•r-.~.
0
Filed surface [image:28.561.39.480.378.710.2]countersunk on the outside back plate to facilitate mounting of the phot6-multi'pFier· tuoe'in -clos·e proximity-to-the-chamber as depicted in Figure 3.
Both the chamber and the photomultiplier tube with its associated voltage divider network are mounted on an aluminum block which in turn is mounted on a micromanipulator stage to allow precision alignment of the sample stream and laser beam. The photomultiplier tube is enclosed in a light-tight box made from Plexiglas and sprayed with flat black paint. Light can enter only by way of the flow chamber. To prevent accidental electrical shock, the dynode chain at the base of the tube is enclosed in an aluminum box which has BNC connectors for the high voltage supply and the anode signal.
To avoid movement of the chamber once positioned, a manifold with three 2-way valves is placed directly above the flow chamber. The valves are connected to the inlet ports of the sample, sheath and debub-bler by flexible tubing.
Referring again to Figure 4, filtered distilled water or saline enters the central bore of the chamber (A) by the sheath entry port (B) and laminar ("smooth") flow is established in the 0.8 mm diameter cylin-drical bore section of the sample-sheath needle. The flow then enters the tapered portion of the swaged needle which has an exit diameter of approximately 200 micrometers. The sample inlet port (C) on the axis of the main flow serves to introduce the particle suspension into the faster flowing sheath fluid. Cell-free sheath fluid flows around the sample
diameter of approximately 20 micrometers across a smooth transition region {G) where it is intersected by the focused beam. The combined flow leaves the chamber through the exit port (E). To prevent droplet formation at the outlet of the exit port, a wick is inserted in the neck of the exit needle and lies within the connecting tubing.
The relative flow rates of sheath and sample fluids are determined by differential pressures established by the relative heights of the re-spective supply reservoirs. Gravity feed was used to establish the flow rates,- and_a sheath._hydrauli.c head_of .approx.imately 70 cm above the exit port produced a sheath flow rate of 1.3 ml/minute. The head of the sample reservoir was approximately 15 cm above the exit port, and it produced a sample flow rate of 0.1 ml per minute.
Light Source
Both coherent (laser) and incoherent (arc or incandescent) light sources are currently used in flow cytometers. The most obvious differ-ences between these light sources are their spectral output and the spa-tial distribution of the radiation. Each is advantageous for specific flow cytometric applications.
Lasers emit monochromatic light of the' same wavelength and phase in a highly collimated beam with a typical diameter less than 2 mm. Thus simple optical arrangements can be used to collect the light and to shape the beam. The principal advantage of lasers is their high energy output ranging from 2 milliwatts to several kilowatts.
spontaneously emit atoms at random times. Consequently many continuous, broad spectral bands with several regions of high intensities exist. With the proper choice of filters, light with a range of wavelengths can be selected. ·Moreover, mercury arc lamps are common, relatively inexpen-sive source of fluorescence excitation. The major disadvantage of mercury arc lamps is the relatively low luminous intensity obtained when focused to cell-like dimensions. For an in-depth comparison between laser and mercury arc lamp as sources of illumination for flow cytometers, the
reader.. is referred to the article.by Peters (46).
In this research, the light source was a Spectra-Physics (Spectra-Physics, Inc., Mountain View, CA) Model 146 helium-neon gas laser with a specified power output of 4 milliwatts at 632.8 nm and a beam diameter at the 1/e2 points of 0.922 mm. In the TEM00 mode (transverse electric and magnetic modes of oscillations in which there are no transverse nodal 1 ines) the .intensity profile across the laser beam is in the form of a bell-shaped or Gaussian distribution which may be expressed by the equation (47):
(1)
where I0 is the peak intensity at the center of distribution, R is the radius at which I(R) is calculated and W is the beam radius at the 1/e2 point (0.136I0).
Input Beam Optics
than the cell stream. Focusing is usually accomplished by using spherical or cylindrical lenses or a combination of both. Where focusing along one axis is needed, cylindrical lenses are used. Crossing two cylindrical lenses with axes at 90° allows independent focusing in the horizontal and vertical planes. Thus focusing to a spot size with specific major and minor axes can be accomplished with relative ease. In contrast, spherical
lenses collimate light to a point source only.
The red light emitted by the helium-neon laser was centered into a lOx microscope objective _(N.A. ='0.25) which focused the beam to a point source through a 25 micrometer pinhole which was mounted in a spring loaded, two-way adjustable diameter holder. Both the microscope objec-tive·and the pinhole were mounted on the same steel mount with the ob-jective in a fixed position and the pinhole on a stage movable in the horizontal position along the axis of the beam. Thus, fine adjustments could be made via the adjusting screw. The beam coming out of the pinhole was focused onto ah achromatic spherical lens (diameter 5.2 cm) approxi-mately 30 cm away from the pinhole. The focal point on the cell stream was found to be approximately 55 cm away from the spherical lens as shown
in Figure 3.
The diffraction limited spot diameter can be obtained mathema_tically by the Airy disc method in which about 80% of the beam energy will be con-tained in a diameter (47):
d
TEMoo
=
2.44f A/D (2)With D measuring 5 cm , the beam diameter is calculated to be approximately 17 micrometers, which is smaller than the cell stream (approximately 20 micrometers) . To make certain that the beam spot covers the entire flow
stream, the beam was defocused slightly by moving the chamber with its detector in the hori zontal plane toward the l aser .
Photomultiplier Tube and Associated Electronics
In selecting a photomultiplier tube for a particular appl ication, there are a few noteworthy considerations. For exampl e, in low light
level applications such as in fluorescence observations, the most important consideration is the effective dark current , which in a photomultiplier tube, is determined by the type and area of the photocathode. When the photomultipli er is operated in complete darkness, electrons are still emitted due to thermionic emission (a function of temperature) which is responsi ble for the largest component of the dark current. The resulting dark current is amplified by the multiplier system, and therefore sets a limit to t he lowest intensity of li ght that can be detected directly .
.
For applications requiring the maximum signal - to-noise ratio, the darkcurrent can be reduced by cooling t he tube or reducing the effecti ve photocathode area by the use of a magnetic l ens (48).
Another cons ideration i s the quantum efficiency (Q.E . ) defined as the number of photoelectrons emitted from the photocathode per inc ident photon . The quantum efficiency given in percent at any wavel ength can be calculated from the following equation {49):
where E(A) is the photocathode radiant sensitivity expressed in milli-amperes per watt and A is the wavelength in nanometers. Note: E(A) is obtained from the spectral response curve for a particular tube at a specific wavelength. Most Q.E.'s are less than 30% due to imperfect col-lection and transfer efficiency.
The overall gain (G1) at a specified voltage (V1), taking into account losses due to imperfect collection and transfer efficiency, is determined by dividing the anode luminous sensitivity by the cathode luminous sensi-tivity. Since _the photomu.l tip 1-i er. tube-functions -as-a photoel ectron
--(current) amplifier with the anode current being a linear function of the input light energy in lumens or watts, it is very sensitive to variations in the applied voltage to the dynode chain. To determine the current gain
(G) at some other voltage (V), the following relationship can be used
(49):
where n is the number of stages of amplification (dynodes).
In this study, the pulses generated by the passing cells were col-lected by an E.M. I. 95028 (E.M. I. Gencom Inc., Plainview, NY)
photo-multiplier tube which has a cesium-antimony cathode. The 95028 is'a head-on, 50 mm tube with a 10 mm diameter cathode. It is a high gain
13~stage "venetian blind" type tube (designed for low light level
radiant sensitivity is about 3 milliamperes/watt (typical 58 milliamperes/ watt, a t"390 ·nm}~which makes ··the··Q. E.; as ·foand··from-Equation· 3 ;·1 ess than
1% (0.59%). Despite the low Q.E., signals for the smallest test particle were well above the noise level (10 millivolts peak-to-peak) with Rf set at 100 kilohms and the photomultiplier tube voltage operated at -860 volts.
Power Supply and Associated Circuitry
To operate a photomultiplier tube, it is necessary to provide inter-stage voltages to the tube electrodes. This voltage may be supplied by individual sources or by a resistive voltage divider network placed across the high voltage power supply. The value of the resistors is limited at low values by heat dissipation in the divider and the current capacity of the power supply. Generally, resistor values between 20 kilohms and 5 megohms are practical.
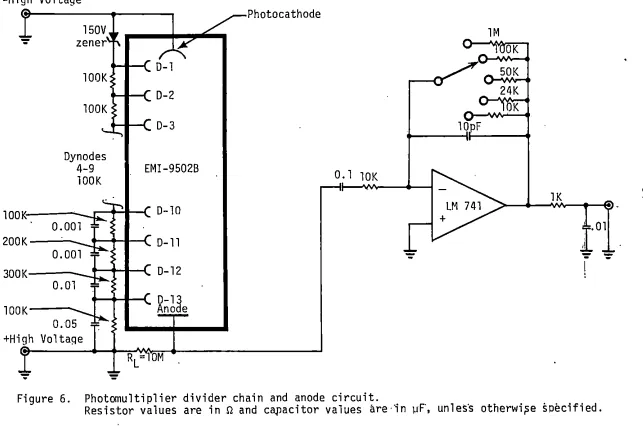
Interstage voltages were provided by a nonlinear dynode chain which is particularly suited for pulse counting (48). The divider chain shown in Figure 6 provided sufficient current by using decoupling capacitors in the latter stages to maintain the i"nterstage voltages during the pulse. To maintain the specified cathode to first dynode (K-Dl) voltage of 150 volts, a 150 volt Zener diode was employed as the stabilizer which also provided a better signal-to-noise ratio. All of the components for the divider network were mounted at the base of the teflon socket. The chain was operated with the cathode at a negative potential. Consequently, power supply ripple was not injected into the anode circuit.
which was maintained at cathode potential and therefore served as an electrostatic as well as a magnetic shield.
The power supply was a HP-6516A (Hewlett-Packard, Palo Alto, CA) which provided a constant, highly stable d.c. voltage. It is wellregulated with low ripple (5 millivolts peaktopeak). The voltage is also -continuously adjustable (0 volt to 3 kilovolts).
Anode Circuit
The-output-of-a photomul-t-iplier--is electric charge,-and in-most applications, this charge is allowed to flow through the load resistor
(RL) while the voltage across it is measured. In this case, the anode was capacitatively coupled to a current-to-voltage transducer using a general purpose operational amplifier (741-type), with the output voltages a direct function of the input currents. Variable gains were provided by feedback resistors of 10 kilohms, 24 kilohms, 56 kilohms, 100 kilohms and 1 megohm. The output from the operational amplifier was coupled to a passive low-pass filter with a cutoff frequency of 15.9 kilohertz to the input of the Tektronix 5103N (Tektronix Inc., Beaverton, OR) oscillosccipe which has a bandpass filter that was set from DC to 10 kilohertz. The circuit diagram of the photomultiplier divider network and its anode circuitry appears in Figure 6.
Figure 6.
R L
=
OMOK
lK
.01
,,
Photomultiplier divider chain and anode circuit.
[image:37.786.94.737.61.487.2]c
.,....
~
(.!)
10
9
8
7
-6
5
4
3
2
1 700 vo1ts
600 volts
2 3 4
Intensity (µWatts )
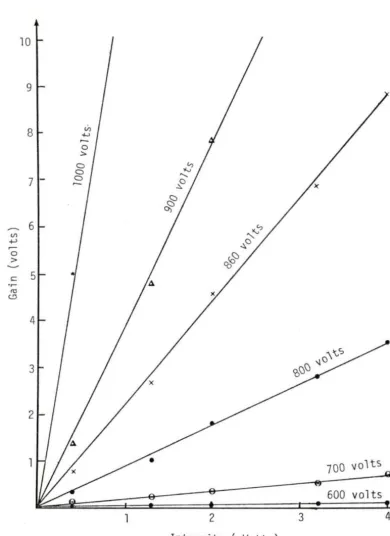
Figure 7. Gain-linearity of PMT with amplifier removed and RL~lOOkn .
[image:39.567.73.464.81.618.2]EXPERIMENTAL MATERIALS AND METHODS
Whole blood samples collected from dogs and a calf by venipuncture using ethylenediamiiletetraacetic acid (EDTA) as an anticoagulant were selected to evaluate the flow chamber described in the previous section. The blood samples were obtained from the Veterinary Diagnostic Laboratory,
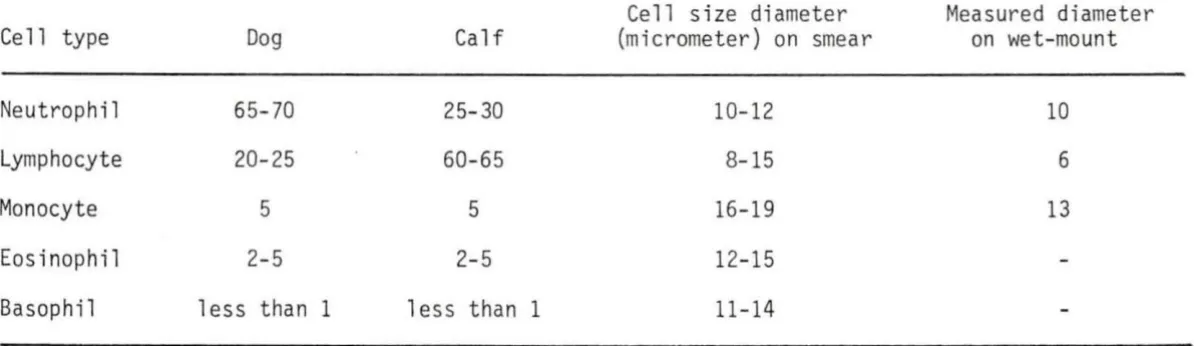
Iowa State University, Ames, IA after routine differential leukocyte counts and other hematologic determinations such as leukocyte count and hemoglobin concentration had been performed. The records of the labora-tory's manually determined differential counts were made available for comparison to the light scatter waveforms obtained from the flow system previously described. Bull sperm cells, collected by electroejaculation, were obtained from the Reproductive Laboratory, Iowa State University, Ames, IA a·nd were also used to evaluate the sensitivity of the system. Unl_ike eryth.rocytes, leukocytes represent a multi cl ass population, the morphology and ecology of which may give indications of a patient's general state of health or clues to the diagnosis of disease. In normal peripheral blood, there are five different types of mature leukocytes, namely neutrophils, lymphocytes, monocytes, eosinophils and basophils. Each type is found in different concentrations and performs different functions. Table 1 (50) shows the distribution and size of these cells. Even though the leukocyte distributions are different for various species, the size distributions are the same.
Ce 11 type
Neutrophi 1
Lymphocyte Monocyte Eosinophil Basophil
Percentage of each 1 eukocyte
Cell size diameter Measured diameter
Dog Calf (micrometer) on smear on wet-mount
65-70 25- 30 10-12 10
20- 25 60-65 8-15 6
5 5 16-19 13
2-5 2- 5 12- 15
less than 1 1 ess than 1 11-14
w
[image:41.784.103.700.224.397.2]responsible for penetrating the oocyte to deliver its genetic payload, is 9 micrometers long, 4 micrometers wide and 1 micrometer thick. The tail contains the metabolic machinery to produce energy and to provide the propelling mechanism for motility, and is 57 micrometers long (51).
Prior to each test run, all sheath and diluent fluids were filtered with millipore filters (pore diameter 0.22 micrometer). This helps elimi-nate extraneous particulate material which would otherwise contribute to the overall noise of the system. Isoton (Coulter Diagnostics, Hialeah, FL), buffered-sa-1-i.ne-w~-th anti bacterial -and--ant-i-funga 1-agents ,--was
used-for both the sheath and diluent fluid used-for the calibration particles, erythrocytes and sperm analysis. However, buffered hypotonic saline
(0.40%) was .used as the diluent for the leukocyte analysis as suggested by Adams and Kamentsky (52) who were able to cytofluorographically recognize six classes of leukocytes after a brief incubation period in such a fluid.
avoid exposure to the incident beam which would otherwise manifest itself as excessive dark current and cause saturation of the photomultiplier tube.
Extreme care was taken to ensure that the beam intersected the central part of the cylindrical flow stream. Once the optical system ·was aligned, the amplifier and the power supply to the photomultiplier tube were turned on, and the waveforms were observed and photographed from the oscilloscope.
Two sizes of spherical monodispersed latex particles were analyzed. The larger 6 to 14 micrometer diameter particles (Dow Chemical Co.,
Indianapolis, IN) are styrene -divinylbenzene copolymer latexes, whereas the smaller 3.49 micrometer diameter particles (Dow Chemical Co.,
Indianapolis, IN) are polystyrene latexes. Both sizes were diluted in Isoton. This procedure appeared to provide better monodispersion of the particles than those ultrasonically agitated or treated with a wetting agent such as 95% ethanol.
Since this research dealt with the detection of light scatter from unstained cells, the concentration of cells per unit volume was not ascer-tained. However, cell suspensions were always checked with a light micro-scope to verify that cells were separated from each other. At the same time, the cell diameters were measured with an ocular micrometer.
the plasma layer was removed and discarded. The buffy coat was carefully removed with a .minimum of red cells and placed in a test tube with about 10 ml of hypotonic saline. Six drops of Zap-oglobin II (Coulter Diagnos-tics, Hialeah, FL) were added to the test tube, stoppered and mixed. Zap-oglobin II stromatolyses nonnucleated erythrocytes and "reduces cellular
debris to an acceptable level" (53). The sample was then transferred to a 50 ml volumetric flask for further dilution and mixing. The final di-lution was made such that 5 to 10 leukocytes per high power field could be seen under the microscope. Vigorous shaking was avoided to prevent formation of air bubbles and possible damage to the cells. Once diluted, the specimens were analyzed within half an hour of treatment with Zap-oglobin II, since it also attacks leukocytes.
Since the ratio of red blood cells to leukocytes is about 600 to 1 for dogs and 800 to 1 for calves, no concentration of red blood cells was necessary. The red cell aliquot was taken from the red cell layer and diluted in Isoton.
To avoid carry-over between samples, each successive sample was al-lowed to flow for about 20 minutes before any data was collected.
To further check the sensitivity of the instrument, bull sperm cells diluted in Isoton were also analyzed. Difficulty was encountered in get-ting a satisfactory monodispersion of the sperm cells probably due to the seminal fluid and to cold shock after collection. Temperatures lower than body temperature (37° C) appear to influence the agglutination of the sperm ce 11 s.
RESULTS
Signal waveforms representing light scatter signatures of latex spheres, bull sperm cells, red blood cells and leukocytes appear in Fig-ures 8 through 17. Scale factors are indicated on each figure.
After initial alignment and calibration, the system remained un-changed. The high voltage to the photomultiplier tube was set at -860 volts, Rf set at 100 kilohms and the relative heights of the sample and sheath reservoirs were held constant for each test. The triggering level on the oscilloscope was also held constant fora·llcalibration andtest -sample runs.
Each waveform can be described according to its height, width and shape. · The height represents light scattering due to the size of the par-ticle, the width represents the cell transit time across the beam, and the shape represents the trajectory path of the cell across the beam. Cells
in the center of the cylindrical stream have shorter transit times than those at the periphery of the stream and give the most symmetrical· pulses as seen in the work of Von Behrens and Edmondson (27). Lighter areas indicate the frequent occurrence of particles of the same size, and the darker area indicate particles of different sizes.
Figure 8 represents light scattered by uniform 3.49 micrometer latex spheres. Amplitudes _appear to vary from 225 to 275 millivolts.
Operational amplifier Rf= 100 kilohms.
Figure 9. Signal waveforms of 6 to 14 micrometer latex spheres .
Exposure time = 10 seconds.
Photomultiplier tube voltage = -860 volts.
Operational amplifier
R.r
= 100 kilohms.Figure 11. Signal wavefonns of bull sperm cell s. Exposure time = 10 seconds.
[image:49.559.55.504.140.724.2]Figure 13.
Photomultiplier tube voltage= - 860 vol ts. Operational amplifier Rf = 100 kilohms .
Signal wavefonns of dog erythrocytes (measured diameter= 7.5 micrometers) . Exposure time = 10 seconds.
[image:51.552.55.508.105.718.2]Exposure time
=
10 seconds.Photomultiplier tube voltage
=
-860 volts. Operational amplifier Rf=
100 kilohms .Figure 15. Signal waveforms of dog leukocytes.
Differential count: 92% neutrophils and 8% lymphocytes. Exposure time
=
15 seconds .Photomultiplier tube voltage = -860 volts.
Operational amplifier Rf~ 100 kilohms.
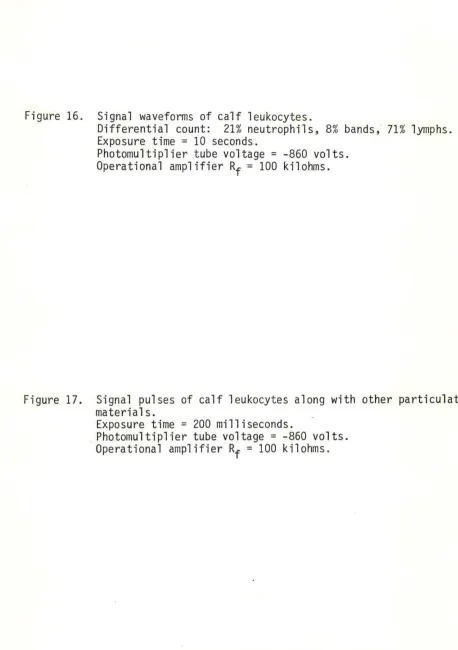
Figure 17. Signal pulses of calf l eukocytes along with other particulate materials.
Exposure time= 200 milliseconds .
[image:55.557.61.519.85.735.2]Figure 10 shows the combined waveforms seen in Figures 8 and 9. Equal volumes of dilute monodispersed 3.49 micrometer and 6 to 14 microm-eter latex spheres, used previously to obtain the waveforms of Figures
8 and 9 respectively, were mixed and sampled. Note the smaller lighter waveforms indicating the presence of more 3.49 mjcrometer spheres than in Figure 8.
The waveforms of the bull sperm cells seen in Figure 11 indicate that only the heads scattered enough light to be detected by the existing sys-tem. The heads, which are approximately the size of red blood cells, pro-duce signal waveforms which are similar to those shown in Figures 12 and 13, except for the larger waveforms which are probably due to doublets
(two cells stuck together), triplets (three cells stuck together) and white cells going through the laser beam.
Figure 12 represents the waveforms of calf erythrocytes with an average measured diameter of 5 micrometers.
Figure_ 13 represents the waveforms of dog erythrocytes with. an average measured "diameter of 7.5 micrometers.
Figures 14 through 18 represent specimens with different leukocyte distributions. In each case, a blood smear was prepared and stained with Wright's blood stain~ a two component polychrome dye. The slides were
examined at lOOOx magnification using oil immersion microscopy, and differential, counts based on identification of only the first 100 cells were done.
Figur~ 14 represents the light scatter waveforms from dog l~ukocytes
lympho-cytes, 5% monolympho-cytes, 2% basophils and 3% eosinophils . Differences in wavefonns are not obvious until they are compared to those seen in Fig-ures 15 and 16.
Figure 15 represents the wavefonns obtained from a different dog whose l eukocytes were predominantly neutrophils {differential count: 92% neutrophils, 8% lymphocytes).
Figure 16 represents the waveforms obtained from calf leukocytes which had an abundance of small lymphocytes measuring approximately 6 micrometers. The differential count was 21% neutrophils, 8% bands
{jeuveniles) and 71% lymphocytes.
Finally, Figure 17 shows the number of leukocytes present along with other cells and debris. The smaller pulses (less than 150 millivolts) are probably due to red blood cell fragments left after saponification with Zap-oglobin II, and also to platelets which are found in high concentra-tion in the buffy coat along with the white cells. The intennediate
DISCUSSION
Calibration of the system was based on the wavefonns seen in Figure 8. These wavefonns were obtained from the light scatter signals of uni-fonn 3.49 micrometer latex spheres. Ideally one would expect to see a single waveform, rather than several wavefonns with amplitudes varying from 225 to 375 millivolts and transit times from 80 to 90 microseconds. These variations are probably due to fluctuations in the flow stream and to variations in the flow path of the cells within _the i lluminated portion of the flow stream. As discussed earlier, those particles in the center of the flow stream have the shortest transit times and consequently have narrower pulses than those at the periphery. Figure 8 also includes waveforms that appear to be approx imately 500 mil livolts, probably due to doublets crossing the beam.
Using the data obtained for the 3.49 micrometer particles, and as-sumi ng that the pulse heights are linearly related to the size of the particles, the following equation can be used to compute the size of the tested particles:
Particle size
(micrometers) = 3.49 (micrometers 00 millivolts
x
Pulse height (millivolts) (5)where 3.49 micrometers is the size of the cal ibration particles, 300 millivolts is the mean amplitude of waveforms obtai ned from those ticles, and Pulse height is the mean ampl itude of the wavefonns of par-ticles of unknown size .
latex spheres. Figure 9 represents the wavefonns obtained from 6 to 14 micrometer spheres. The amplitudes of the waveforms appear to vary from
225 to 1200 millivolts. Using equation 5, the computed si ze range of the particl es are 2.60 to 13.96 micrometers . The upper range (13.96 microm-eters) i s in good agreement with the specified 14 micrometer value. The computed l ower range (2.60 micrometers) obviously represent particles smaller than 6 micrometers . Mi croscopic examination and measurement of an aliquot of the diluted 6 to 14 micrometer sample and of the stock solu-tion showed the presence of 3.49 micrometer particles.
Figure 10 represents waveforms obtained from mix ing equal parts of diluted 3.49 micrometer and 6 to 14 micrometer suspensions which were used to obtain the waveforms seen in Figures 8 and 9. Figure 10 is cl early an effective composite of the waveforms for the 3.49 micrometer particl es. This fu rther supports the suggestions that 3.49 micrometer parti cl es are contaminants in the 6 to 14 micrometer stock sol ution.
Figures 12 and 13 represent waveforms obtained from red blood cells of a calf and a dog, respectively. In the first case the red blood cells were from a two-week old calf. Microscopic examination of these cells showed the presence of microcytes (cell diameter less than 6 micrometers) with slight anisocytosis. The waveforms in Figure 12 appear to vary from about 250 to 375 millivolts which yields a predicted size of 2.9 to 4.4 micrometers. The average measured size of the calf red blood cells was
5 micrometers. The waveforms of the dog red blood cells appear to have amplitudes varying from 250 to 500 millivolts as seen in Figure 13. Again using equation 5, the predicted range of values is 2.9 to 5.8 micrometers (mean 4.4 micrometers) compared to the average measured 7.5 micrometer diameter. The differences in the predicted and measured values of the red cells are probably due to the shape, effects of orientation of the par-ticles in the cell stream and also to the flight path of the particle across the stream . If, however, the data obtained from calf blood are used as a proportional factor (5 micrometers/300 millivolts), the average predicted value for dog erythrocyte would be 6.1 micrometers.
Figure 14 represents canine leukocytes of mixed distribution which makes it difficult to associate specific waveforms with specific cell types. However, based on the differential count, one can suggest that waveforms with peak amplitudes from 250 to 800 millivolts represent neutrophils and lymphocytes. The larger waveforms (900 to 1050 milli-volts) probably represent monocytes. The average predicted value of mono-cyte is 10.9 micrometers compared to the measured 13 micrometer diameter.
appear to have peak amplitudes ranging from 575 to 850 millivolts with a predicted size of 6.7 to 9. 9 micromters . The mean measured value is seen in Table 2.
The amplitudes of the suspected lymphocyte waveforms seen in Figure 16 are identical to the calf red cell waveforms seen in Figure 12. The peak amplitudes range from 250 to 375 millivolts, which yields a predicted range of 2.9 to 4.4. micrometers (mean 3.6 micrometers) as opposed to the measured 6 micrometer diameter.
Experimental results, along with the predicted and measured cell diameters are summarized in Table 2. The predicted diameter values of the mixed latex spheres are in close agreement with the measured diameter, whereas the correlation for biological cells seem to vary from 12% to 41%. This wide variance is probably due to shape and internal structures of the cells.
Eosinophils and basophils were not identified due to their over-lapping size with neutrophils and their low incidence of occurrence in normal circulating blood.
Figure # Peak amplitude Predicted cell diameter Measured diameter Comment
(millivolts) (micrometers) (micrometers)
Range Mean Range Mean Mean
9 225-1200 713 2.6-14.0 3.49-13 Latex sphere
°'
010 225-1200 713 2.6-14.0 3.49-13 Latex sphere
11 225- 500 363 2.6- 5.8 4.2 5(W) x 9(L) Head of bovine sperm cell
12 250- 375 313 2.9- 4.4 3.7 5 Bovine erythrocyte
13 250- 500 375 2.9- 5.8 4.4 7.5 Canine erythrocyte
14 900-1050 975 10.5-12.2 11.4 13 Monocyte
15 575- 850 713 6.7- 9.9 8.3 10 Neutrophil
should be stored as close to body temperature as possible until it is time be used.
Background noise also reduces the overall quality of the instrument. It may manifest itself as microbubbles in the sample and/or diluent
fluids . Microbubbles can be prevented by gently, instead of vigorously, mixing the respective fluids .
SUMMARY AND CONCLUSIONS
A sheath flow chamber, constructed from Plexiglas and hypodermic
needles, was used to confine cells in the center of a coaxial flow stream for exposure to the focused beam of the 632.8 nm wavelength light from a helium-neon laser. Forward light scatter signals were collected by a photomultiplier tube. The signals were amplified, filtered and photo-graphed from an oscilloscope.
RECOMMENDATIONS FOR FURTHER STUDY
Numerous suggestions could be made to improve the existing system . Starting with the optics, cyli ndrical lenses could be used to focus the laser beam to a narrow ellipse as large as the entire cell stream in the horizontal direction. This would ensure complete illumination of the en-tire flow stream, thus greatly improving the resolution of the system.
To further improve the signal -to-noise l evel, the photomultiplier tube should be operated at or near optimal level, that is, the li ght source should spectrally complement the detector. Substituting a differ-ent li ght source such as a helium-cadmium laser in combination with the existing E.M . I. 9502B photomultiplier tube could greatly improve the signal-to-noi se ratio.
Instead of gravity feed for hydrodynamic focusing, constant pressure reservoirs could greatly minimize fluctuations in the sample and sheath flow which were probably partially responsible for the variation of the acquired data (33).
Light scattering signatures at one fixed angle do not yield enough information to accurately identify different cell types . However, if they are augumented with fluorescence and/or absorption, or even angular light scatter, more information could be obtained. Thi s would, of course, com-plicate the data acquisition process. By interfacing the system to a minicomputer, various algorithms could be selected to accurately identify the cells of interest.