2007
Effects of field of view and stereo graphics on
memory in immersive command and control
K.C. Kurt Chris DohseIowa State University
Follow this and additional works at:https://lib.dr.iastate.edu/rtd Part of theCognitive Psychology Commons
This Thesis is brought to you for free and open access by the Iowa State University Capstones, Theses and Dissertations at Iowa State University Digital Repository. It has been accepted for inclusion in Retrospective Theses and Dissertations by an authorized administrator of Iowa State University Digital Repository. For more information, please [email protected].
Recommended Citation
Dohse, K.C. Kurt Chris, "Effects of field of view and stereo graphics on memory in immersive command and control" (2007).
in immersive command and control
by
K.C. Kurt Chris Dohse
A thesis submitted to the graduate faculty
in partial fulfillment of the requirements for the degree of
MASTER OF SCIENCE
Major: Human Computer Interaction
Program of Study Committee: James Oliver, Major Professor
Stephen Gilbert Eric Cooper
Iowa State University
Ames, Iowa
2007
1447525 2008
UMI Microform Copyright
All rights reserved. This microform edition is protected against unauthorized copying under Title 17, United States Code.
ProQuest Information and Learning Company 300 North Zeeb Road
P.O. Box 1346
Ann Arbor, MI 48106-1346
TABLE OF CONTENTS
LIST OF FIGURES ... iv
LIST OF TABLES ...v
ABSTRACT ... vi
CHAPTER 1 OVERVIEW ...1
1.1 Introduction ... 1
1.2 Definitions of key terms ... 2
1.2.1 Virtual Reality ... 2
1.2.2 Immersion ... 3
1.2.3 Presence ... 3
1.2.4 Situation Awareness ... 4
1.2.5 Simulator Sickness ... 5
1.2.6 Workload ... 5
1.2.7 Display elements and the eye ... 6
1.3 Hypothesis ... 7
1.4 Battlespace ... 7
1.5 The Task ... 10
CHAPTER 2 Background ...12
2.1 Command and Control Visualization ... 12
2.2 Important Goals of Command and Control ... 12
2.2.1 Accuracy ... 13
2.2.2 Spatial Imagery ... 13
2.2.3 Information Quantity ... 13
2.2.4 Interaction ... 13
2.3 Command and Control Technology ... 14
2.4 Virtual Reality Research ... 19
2.4.1 Immersion Research ... 22
2.5 Summary ... 23
CHAPTER 3 METHODS AND PROCEDURES ...24
3.1 Methods ... 24
3.1.1 Participants ... 24
3.1.2 Apparatus ... 24
3.2 Procedures ... 25
3.2.1 Design ... 25
3.2.2 Measures ... 30
3.2.2.1 Immersive Tendency Questionnaire ... 31
3.2.2.2 Memory Test ... 31
3.2.2.3 User Questionnaire ... 32
3.2.2.4 Situation Awareness Rating Technique ... 32
3.2.2.5 Simulator Sickness Questionnaire ... 33
3.2.2.6 Presence Questionnaire ... 34
3.2.2.7 Workload Questionnaire (NASA-TLX) ... 34
4.1 Correlation ... 35
4.2 Field of View ... 39
4.3 Graphics ... 46
4.3.1 Stereo vs. Mono ... 46
4.3.2 Glasses vs. No Glasses ... 50
CHAPTER 5 SUMMARY AND DISCUSSION ...52
5.1 Analysis ... 52
5.2 User Feedback ... 54
5.3 Implications ... 55
5.3.1 Command and Control Visualization ... 55
5.3.2 Virtual Reality ... 56
5.4 Limitations ... 58
5.5 Future Research ... 58
Appendix ...61
Presence Questionnaire ... 61
Immersive Tendency Questionnaire ... 66
SART ... 71
Simulator Sickness Questionnaire ... 73
Workload ... 74
Memory Questionnaire ... 75
Experiment Questionnaire ... 76
REFERENCES ...77
LIST OF FIGURES
Figure 1 Scene from the virtual environment participants viewed during the experiment. ... 9 Figure 2 Logitech wireless gamepad, the primary interaction device for the Virtual
Battlespace. ... 10 Figure 3 View of FalconView‟s overhead 2D interface ... 14 Figure 4 View of SkyView's implementation of 3D graphics to represent planes and paths. 15 Figure 5 View of Dragon, demonstrating the use of the virtual laser tool for interaction on a 3D map with continuously updated 3D units. ... 18 Figure 6 Uses of virtual reality: view inside of a molecule (top left), architectural planning (top right), 3D data visualization (bottom left) and employee training (bottom right). ... 19 Figure 7 C6 display system (left) and C4 display (right)... 25 Figure 8 Graphical representation of the five conditions ... 27 Figure 9 Enlarged example of vehicles participants saw in the convoy. A) has a weapon indicating it is hostile. B) has no weapon; thus it is friendly. ... 29 Figure 10 Example of an alert video. The participant sees a convoy driving down a road from an unmanned aerial vehicle. ... 30 Figure 11 Spatial mapping of the relationships between dependent variables. Closer
proximity indicates a stronger positive correlation and further away indicates a negative correlation. ... 36 Figure 12 Correlations between measures. Red (darker lines) indicates negative
correlation and green (lighter lines) positive. Line thickness indicates correlation strength .. 37 Figure 13 Field of View for Physical Workload (populations significantly different) ... 39 Figure 14 Field of View for Presence subscale Control
(populations significantly different) ... 40 Figure 15 Field of View for Presence (populations significantly different) ... 41 Figure 16 Field of View for Frustration Workload (pooled) (populations significantly
different) ... 42 Figure 17 Field of View for Memory (no significant difference) ... 43 Figure 18 Representations of the four trends displayed in the field of view data, as referenced ... 44 Figure 19 Stereo vs Mono scores on the oculomotor simulator sickness sub-scale.
(populations significantly different) ... 47 Figure 20 Stereo vs Mono scores on the disorientation simulator sickness sub-scale.
(populations significantly different) ... 48 Figure 21 Stereo vs Mono scores for memory (no significant difference) ... 49 Figure 22 Glasses vs No Glasses scores for Temporal Workload
LIST OF TABLES
Table 1 The five experimental conditions ... 26
Table 2 All of the possible score ranges for each subscale and total score for the SSQ. ... 34
Table 3 Correlations between dependent variables. *=p<.05 ... 38
ABSTRACT
CHAPTER 1 OVERVIEW
This research at the Virtual Reality Application Center (VRAC) of Iowa State University is to address the question: How does the degree of immersion and sense of
presence within a virtual reality (VR) command and control operation affect performance on
memory-based tasks? Related to that core question are the additional issues of how the
factors of situation awareness, workload, and simulator sickness are related to immersion and
task performance.
1.1 Introduction
The goal of any military mission is to complete the mission as efficiently and as
safely as possible. To accomplish this, the military relies on state of the art weapons systems
and the ability to make good decisions and act upon them as quickly as possible. One way to
keep soldiers safe is to keep them out of the theater of operation; the United States
Department of Defense (DOD) Roadmap 2015 indicates that the goal is to have 25% of
military aircraft be comprised of unmanned aerial vehicles (UAVs), thereby removing pilots
from immediate danger. To make sound decisions, soldiers depend on accurate information
to be presented to them in a meaningful way. Current military engagements are becoming
increasingly complicated as the battlefield moves to urban areas, which means there is a
larger and more diverse set of data to be organized and analyzed. Added to this complexity
will be devising a strategy to control and manage numerous UAVs. A potential solution to
Virtual reality poses a potential way of viewing all of the relevant information that
military personnel need in one unified location, rather than scattered across several disparate
interfaces leaving users to consolidate the information mentally. The reduction in the users‟
necessity to perform this consolidation task has been shown to allow operators to use more of
their time to make decisions (Durbin et al., 1999, Hix et al., 1999).
1.2 Definitions of key terms
1.2.1 Virtual Reality
The term “virtual reality” was coined as a means of unifying the concept of numerous
virtual projects such as virtual worlds and virtual cockpits (Krueger, 1991). Thus the term
typically refers to three-dimensional displays in which stereo graphics are used and special
three-dimensional input methods are employed (e.g. wand or data glove). Other definitions
have more stringent requirements on the technology such as tracking the user‟s position in
order to render the environment more accurately for the user‟s viewpoint. Meanwhile other
researchers have pushed for definitions that focus more on the experience than the
technology itself. For example: “A “virtual reality” is defined as a real or simulated
environment in which a perceiver experiences telepresence” (Steuer, 1992).
A definition could be placed anywhere on the continuum from strictly technology
based to strictly experience based. In either sense, this experiment varies in the degree by
which participants will be using virtual reality. The definition herein will regard virtual
reality or virtual environments as three-dimensional computer generated graphics that are
allow users to interact with the system, thereby creating a virtual world that the user is likely
to feel that they are inside.
Typical VR systems include head mounted displays (HMD) that give each user their
own headset to create the imagery and CAVE (cave automatic virtual environment) which
uses multiple projection surfaces to surround multiple users with imagery.
1.2.2 Immersion
The interpretation of immersion can vary as well, from the user's experience to a
hardware-based definition. Slater's definition of immersion, where immersion is described as
a quantifiable description of the technology (e.g. screen resolution and the amount that the
outside world is shut-out from the user) will be used (Slater et al., 1996). This definition
separates the concept from the related idea of presence, which will be defined later.
Immersion is increased in two ways, first by using technology that removes a user from the
real environment as much as possible in as many ways as possible. The second way to
increase immersion is to make the inputs and outputs of the system as real as possible. Thus a
system that has a small field of view, low screen resolution, poor sound quality and an
obtrusive style of control has a much lower level of immersion than a system with a large
field of view, high quality visual and auditory output and more natural modes of interaction.
1.2.3 Presence
Presence is a subjective feeling of being inside of an alternative environment.
virtual environments (VE), in which presence refers to the degree by which a person feels
they are inside, or part of, the VE. Presence is separate from the notion of becoming
immersed or engrossed in a book and film because although a person may not be paying
attention to the external world, they generally do not feel as though they themselves are part
of the fictional world. In more traditional VEs users experience higher levels of presence
because not only do they remove themselves mentally from the physical world, but they
actually interact with the VE and can either influence what is happing or be part of what is
happening.
The experiment will focus on the user's field of view and whether the virtual
environment (VE) was projected in stereo or mono. Increasing the field of view increases the
degree to which the participant's proprioception (the perception of ones position and body)
will be appropriately mapped to the simulation. The use of a stereo display will increase
realism. Both of these are important factors of presence.
1.2.4 Situation Awareness
One of the research questions concerns the relationship between situation awareness
and memory. The definition of situation awareness (SA) established by Endsley states that
“SA is the perception of the elements in the environment within a volume of time and space,
the comprehension of their meaning and the projection of their status in the near future”
(Endsley, 1988). Situation awareness has three levels: the first level is perceiving different
elements of the environment, the second level is understanding what the different elements
elements will be. SA is often thought to be important to good performance (Ma & Kaber,
2007).
1.2.5 Simulator Sickness
Another research question concerns the relationship between simulator sickness and
the presence of stereo graphics. Simulator sickness encompasses a number of feelings of
discomfort that can occur as a result of being inside a VE, such as nausea, disorientation, or
ocular problems (Casali, 1986). Simulator sickness can be considered a form of motion
sickness, because it involves similar sensations and the primary cause of simulator sickness is
cue conflict between the visual and vestibular systems (Tyler & Bard, 1949, Kennedy et al,
1993). The term simulator sickness is not used interchangeably with motion sickness, however, because motion sickness refers to a specific disorder dealing with actual motion,
while simulator sickness can be brought about without any motion. Symptoms of simulator
sickness can also be influenced by display elements such as resolution and lag.
1.2.6 Workload
Another one of the research questions concerns the relationship between workload
and the field of view. Workload refers to the amount of work someone performs within a
certain timeframe. Workload is an important concept when designing machines or processes
in order to create the most effective and efficient system possible. There is no single
definition of workload, but Hart and Staveland identify the key elements as mental and
& Staveland, 1988). There are multiple elements of workload that can be identified,
separately measured, or can be combined to determine a single workload score. Physiological
measurements can be used to obtain information, but the more common method is subjective
questionnaires. Individual differences in definitions and tolerances make the analysis of
subjective measurements complicated, but by identifying separate elements and narrowing
definitions researchers can obtain consistent results. Cognitive load is similar to workload in
that it identifies the extent to which cognitive resources are used by the processes of learning
(Chandler & Sweller, 1991). The most significant difference between these two constructs is
that workload encompasses mental elements as well as physical elements.
1.2.7 Display elements and the eye
To create the most realistic experience virtual reality must take into account the
human visual system. The human field of view for people with two eyes is approximately
200 degrees horizontally and 135 degrees vertically (Gibson, 1979). Thus, using larger fields
of view maintains a more unified visual experience of an environment, which creates a more
realistic experience.
Another element of realism in virtual reality is mimicking stereoscopic vision. To
achieve stereoscopic vision the brain calculates the difference between the input it receives
from both eyes in order to determine depth. This occurs because in the real world an object is
slightly different distances away from each eye. In virtual reality, there are two separate
images projected at alternating times, and shutter glasses are synced to the projectors such
that each eye sees the appropriate image at the correct time. This arrangement leads the brain
indicating that stereo can benefit three-dimensional task (Arthur et al., 1993). Head tracking
improves this effect, but was not used in this experiment.
1.3 Hypothesis
Previous research has indicated that increasing the level of immersion in a simulation
can have positive effects on performance (Slater). Similarly increasing the size of the display
and the field of view can improve memory and increase the sense of presence (Tan et al
2003, Lin et al 2003, and Czewiksi et al 2003). The goal of this research is to determine if the
highest level of immersion in the experiment will yield the highest scores on a
performance-based memory test. The secondary goal is to determine which factors (presence, situation
awareness, simulator sickness and workload) influence performance.
1.4 Battlespace
To understand the background of the experiment, the Virtual Battlespace will be
introduced. The Virtual Battlespace is a 3D visualization tool that consolidates the available
information about a complex battlefield into a single coherent picture that can be viewed
from multiple perspectives and scales (Knutzon et al., 2003, 2004; Bernard et al., 2004).
Battlespace visualization attempts to improve a commander‟s ability to understand the
complex interactions of units in a conflict and facilitates effective and intelligent decisions
based on the available information (Posdamer et al., 2001). Visualizing engagements in this
way can be useful in a wide variety of contexts beyond command and control in combat
situations, including mission planning, mission review, and distributed mission training. The
potential threats, allows the operator to query for information, and suggests high-success
courses of action.
In the virtual Battlespace environment users view a desert landscape from overhead (Nellis Air Force Base) populated with surface to air missile sites (SAMs), fighter planes, bombers and a target base (Figure 1). Each unit is colored either red or blue to represent which force they are part of and represented with a specific icon (the friendly units are blue and the hostile units are red). Users moved themselves around in the environment by
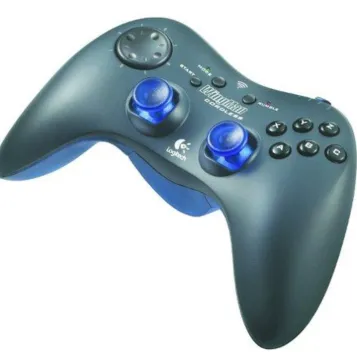
manipulating the two analog thumb sticks on a video game controller (Figure 2). While in the virtual environment, participants have four degrees of freedom with the controller and can get as close to a unit as they desire to investigate what is happening.
Typical tasks performed in the Battlespace include: surveying the battle theater from
a “god‟s eye view,” tracking threats and deciding the optimal time to deploy weapons against
them, determining enemy weapon ranges for UAV way-point plotting, following behind
allied planes to see what their pilots are seeing on the battlefield, and reviewing videos of
Figure 2 Logitech wireless gamepad, the primary interaction device for the Virtual Battlespace.
1.5 The Task
The task involved the comprehension and memorization of three-dimensional spaces
and objects within Battlespace. Participants completed these tasks under conditions of
varying fields of view and with stereo and mono displays. After completion, participants
measure situation awareness, simulation sickness, workload, and degree of presence. It is
reasonable to think that because the task mimics the real world, increasing immersion and
presence would in turn increase performance on the memory test. It has been shown that
increasing the quality of sensory modalities increases presence and memory (Dinh et al,
CHAPTER 2 BACKGROUND
2.1 Command and Control Visualization
The decision-making process leading up to and during a battle is known as command
and control. In order to support this process, military personnel rely on different tools to view
the battlefield. This process has been occurring ever since the first military was formed and
has changed greatly over time, as has the technology used to assist leaders to make decisions.
Early methods for planning and instruction used maps and sand tables for
visualization. Sand tables can be made in varying sizes and levels of detail, but their purpose
is to give a physical scaled-down representation of the battlefield. Figures can be moved
around in the sand table to represent troop formations and strategy. Acetate overlays can be
placed on maps and grease pencils can be used for the same function, or in order to update
information.
Both of these techniques are still used for visualization and command and control
because they are simple to use and understand, but are limited in the ability to rapidly update
and share massive amounts of information. As military operations become increasingly
complex with more people and factors added to the equation, new technology is needed to
more effectively assist the military make the best decisions as quickly as possible.
In modern operations more information is arriving via computers, so a natural
extension of that is to use computers in the visualization process. Computers have been
making their way into the military visualization process with varying levels of complexity,
including virtual reality systems.
2.2 Important Goals of Command and Control
Command and Control activities require a system to achieve four main goals in their
design and implementation. The following analytical framework will be used throughout this
2.2.1 Accuracy
During real-time war gaming, command and control operations can occur rapidly and
are time critical, thus the information needs to be dynamic and accurately represented. This
means that units on the display need to have positions and statistics continuously updated to
be useful.
2.2.2 Spatial Imagery
The combat theater can occur anywhere on the planet and include any type of terrain
or manmade structure. The locations of buildings and topography of the area are crucial
elements of the planning stages of a mission, thus spatial and geographic information are
important. Understanding the spatial relationships between individual units and between
units and the environment can be better understood by using three-dimensional graphics.
2.2.3 Information Quantity
With any decision, the amount of information available impacts the quality of that
choice. In a command and control scenario, spanning a large geographic space, a larger
display is critical for displaying the information required to understand the entire context of
the battle and make appropriate decisions. This information often depends on a large but
uncluttered data visualization strategy.
2.2.4 Interaction
Command and control is not a passive activity; personnel are actively acquiring
specific information, changing viewpoints and manipulating units. During the planning
stages, commanders interact with units extensively to decide the best strategy. The ability to
2.3 Command and Control Technology
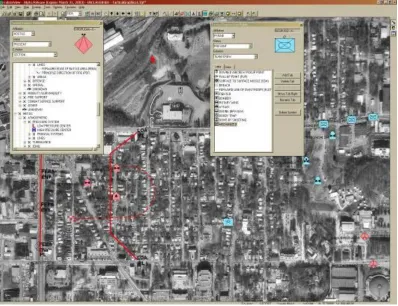
FalconView is a government off-the-shelf 2D visualization tool currently in use in several
branches of the military (FV website). This application displays maps and geographically
referenced overlays to visualize the battle theater and perform mission planning It is used on
base and as a moving-map onboard vehicles, but is limited to a two- dimensional
representation of that entities involved in the operation.
FalconView fulfills accuracy and interaction goals, but is limited on spatial imagery and
information quality goals. FalconView is mostly used on large screens, so there is a lot of
[image:22.612.106.504.388.694.2]information available, but not nearly as much as what is available with a CAVE system
(Figure 3). The spatial imagery goal is partially accomplished because there are geographic
overlays, but the system is 2D, so it is difficult to convey all of the spatial information
possible.
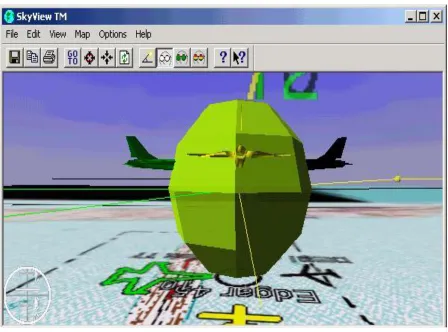
To attempt to produce a more realistic representation of the map, a 3D add-on was
developed called SkyView. SkyView uses simple 3D representations of units and displays
paths with very minimal graphics (Figure 4). Many of the features of FalconView/SkyView
are still grounded in the 2D aspects of the application and it is unclear whether this 3D
representation is increasing situation awareness or the immersive qualities of the display.
Therefore the improvement to spatial imagery is only partially improved upon because
spatial relationships between units are more evident, but the terrain is still in 2D. Most of the
[image:23.612.92.540.321.653.2]interface techniques are also still grounded in 2D, so the spatial interaction is limited.
Other systems for battlefield visualization recognize the necessity of shared
workspace and varying user roles. One such example has attempted to display information
from multiple viewpoints at the same time using projection based systems (Pettersson et al).
This system allows four users to have different stereoscopic views of a battlefield on a
horizontal viewing surface. Such a system provides users with accurate data and uses stereo
graphics to display geographic data. It has a limited amount of information displayed due to
being projected on a small table. The developers have approached the goal of data access
and manipulation by incorporating a wireless pen-based computer. This interaction
technique may work well for interacting with the application, but does not allow the
individuals at the display to interact with it. An additional limitation of this system is that
with so many different projections, there is some interference between graphics, the amount
of impact this has on its usability is not yet known.
Another technique for multiple viewer visualizations within the same space was
accomplished using head mounted displays given to each user (Hedley et al. 2002). The
experience is shared with this system because the head mounted displays are video see-
through and the geographic information is represented with augmented reality (AR). This
approach was not designed for command and control, but accomplishes spatial imagery and
interaction goals. Tangible objects make it easy for users to manipulate the information and
all of the terrain is viewable in 3D. If applied to command and control it currently lacks the
ability to display dynamic information and has limited size because it is implemented on a
table. Another shortcoming of this system is that like in many AR systems, only people
wearing the head mounted display can participate and users cannot quickly switch between
other tasks not related to the visualization.
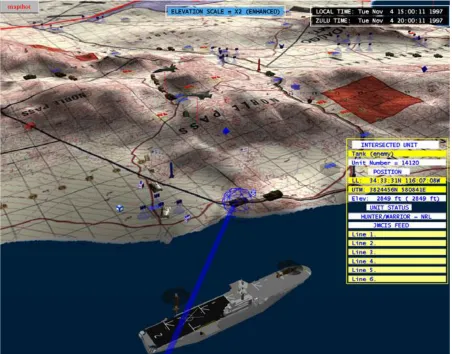
A virtual workbench has also been implemented for battlefield visualization, which is
a useful collaborative tool, but is not limited in terms of information quality when compared
representations of terrain, friendly and hostile entities as well as other military symbology
(Figure 5). Positions and units are continuously updated and viewed from different angles in
either mono or stereo graphics, accomplishing accuracy and spatial information goals. The
developers also experiment with using egocentric and exocentric modes of navigation, or as
they term it, map-centric, which uses the metaphor of moving a physical map, and
user-centric, which mimics flying in an airplane. The system is controlled with a modified
three-button joystick by pointing a virtual laser into the environment. The “pointer” is moved
around as an entity in order to select and interact with other entities and the environment
(Figure 5). The interaction based goal is not adequately accomplished because interacting
with the environment with the virtual pointer is difficult. Other visualization systems, such
as LeatherNet, use CAVE technology in order to train groups of commanders (Carlson and
Yi, 1996). This system integrates the 3D CommandVu command and control visualization
with the CommandTalk speech interface. This system accomplishes accuracy, spatial
imagery, and information quality goals, but relies on speech commands to interact with all
aspects of the technology. Speech is useful, but not optimal as the only means to interacting
with three-dimensional space.
The Virtual Battlespace was developed with all four of the goals in mind. The Virtual
Battlespace has the ability to receive position and status data from another source and
accurately display that information in the 3D VE to accomplish the accuracy goal.
Geographic and spatial data are available to the user and viewable from any angle. By using
a CAVE users are presented with a large amount of imagery that is easily viewed. The value
of viewing units and geographic features in the VE is amplified by the additional spatial
context provided by such a large and immersive display. Manipulation of Battlespace units is
currently limited to a small set of key options, but the interaction methods are very powerful.
The Virtual Battlespace is a multimodal application that allows speech commands to select
2.4 Virtual Reality Research
Virtual reality (VR) is an increasingly utilized tool for visualization and interaction
with three-dimensional spaces and objects. Virtual reality excels at enabling individuals or
groups to experience and interact with information in ways difficult or impossible to replicate
in the real world. Example applications include navigating inside a molecule, prototyping
parts for a car, visualizing three-dimensional data, training employees for a future factory and
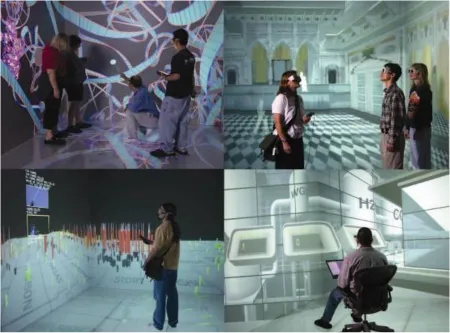
exploring an ancient temple or designing a new building (Figure 6).
It is important to identify which aspects of virtual environments are most critical for
[image:27.612.90.540.331.664.2]them to be effective. This includes the type of display and the method of interaction. Types
of displays include systems such as a head-mounted display (HMD) or the CAVE system in
which images are back-projected onto screens around the user. The type of interaction device
used could be speech, gestures, a video game pad, a tracked “wand,” or any number of
methods. The effectiveness of the display and the method of interaction are relative to the
task being performed. Work that benefits from collaboration in a shared space, for example,
is ideal for a CAVE, whereas simulating binoculars or working inside of an existing space is
ideal for HMD's.
Techniques to identify the best uses of VR and methods of interfacing with it broadly
fall into one of two categories, quantitative and qualitative research methods. Quantitative
research is based upon collecting and analyzing numerical data. Examples of quantitative
measurements include time needed to complete a VR task or the number of mistakes made.
Qualitative research instead looks at non-numerical data, such as words or pictures.
Examples of qualitative measurements include video of users interacting with an interface or
responses during an interview or to a questionnaire.
Using both quantitative and qualitative approaches, research has focused on
application specific and generic virtual reality environments and uses. Basic VR research
uses non-domain specific environments and attempts to identify factors that make virtual
reality more effective, such as evaluating different information displays, for example,
auditory displays (Lee et al, 2003). Research also compares techniques for displaying
information, such as the role of multi-sensory input on memory (Dinh et al, 1999). Novel
interaction techniques are frequently developed and researched as well, such as image plane
interaction (Pierce et al, 1997). Finally, the methods by which researchers collect data are
evaluated, such as using physiological measures instead of subjective questionnaires for
measuring presence (Meehan et al, 2002).
Application-specific research tends to focus more on usability issues and how to best
heuristic evaluations, which are assessments based on predefined guidelines regarding good
interface design. Formative evaluations use several people to evaluate a system and are used
early in the design phase, often as part of an iterative process. Formative evaluations focus
on the processes that are involved, such as performing a task analysis (i.e. determining what
is required for a set of events to occur necessary for a given outcome).Summative evaluations
are performed at the end of development and focus on the outcomes. Multiple interfaces can
also be compared to one another using basic quantitative performance metrics such as time to
completion; this can be part of a summative evaluation.
An application-specific battlefield visualization study that uses these techniques was
developed by the researchers of the Dragon system. The researchers perform heuristic
evaluation, formative evaluation, and summative evaluation, with an iterative phase wherever
needed. They used this method to test their Dragon visualization system. The experiment
consisted of users navigating through simple scenarios using either egocentric or exocentric
modes of control, viewing with or without stereopsis and using one of four display
apparatuses. The dependent variable in the experiment was time of completion in the four
types of displays, which were a monitor, a four-wall CAVE, a VR workbench and a single
cave wall. There were problems with the projectors they used, so it is unclear which display
performed best, but within the cave condition there was an interesting result in the mode of
navigation variable. Participants completed task significantly faster using exocentric motion
navigation then egocentric. This is in opposition to the traditional belief that egocentric
motion is best for immersive displays and exocentric motion works best for systems that the
user is looking into.
There is inherent overlap between basic and application-specific types of research
because there are elements of each in both types of research. Basic research often tends to
Application-specific research can identify issues important to a broad spectrum of virtual
reality research, such as identifying new research methodologies.
2.4.1 Immersion Research
In a study conducted using HMDs, research has shown that increased immersion and
egocentric viewpoints increase task performance (Slater et al, 1996). This research did not
find a correlation between presence and performance. The level of immersion was specified
as high when participants wore the HMD and as low when they viewed on a monitor.
Performance was measured according to how many chess moves a participant could
accurately mimic from the Tri-dimensional game they witnessed in the VE.
Researchers have found that “when a display exceeds a certain size, it becomes qualitatively
different” (Swaminathan & Sato, 1997). On desktop-sized monitors, increasing size has
shown improvement in complicated cognitive tasks, recall memory, and in peripheral
awareness (Czerwinski et al, 2003). Very large displays such as CAVE systems have been
shown not only to have the highly valuable social interactions that result from using a shared
display (Bly & Minneman, 1990), but also to benefit single user performance on spatial tasks
(Tan et al, 2003). In the Tan et al experiment, participants engaged in mental rotation
activities on both a desktop monitor and large projection display while maintaining similar
visual angles. Researchers believe that the improved performance was due to a greater sense
of presence and participants imagining the objects from an egocentric viewpoint on the
projection display and exocentric on the monitor. Increasing field of view also increases the
(Prothero & Hoffman, 1995). Although a larger field of view may increase presence, it can
also have the negative effect of increased simulator sickness (Seay et al, 2001).
Stereo graphics have been shown to improve 3D task performance (Arthur et al,
1993, Sollenberger & Milgram, 1991). However, stereo has inherent limitations in
simulations that do not mimic real-life situations involving stereo vision, such as flight
simulation, because objects are generally very far away from the eye. Stereo can also produce
the undesired effect of increased simulator sickness (Mollenhauer, 2004).
2.5 Summary
The complexity of modern warfare and the volume of information available
necessitate increased computer involvement for command and control. Different systems
have been explored to meet these needs, such as SkyView, Dragon, and the Virtual
Battlespace. The command and control systems have used a variety of VR platforms (e.g.
HMDs, virtual workbench, and CAVE) and interaction techniques (e.g. wand, speech, and
game pad). When designing these systems, researchers and developers must keep in mind the
main goals that a command and control visualization must strive for -- accuracy, spatial
imagery, information quality, and interaction -- as well as the best practices for using VR.
Research on VR command and control has shown to be a valuable medium for displaying
and interacting with large 3D datasets. Previous research pertaining to the Virtual
Battlespace is especially connected to immersion, which has indicated that increased field of
view and stereo graphics can improve task performance, but can also contribute to simulator
CHAPTER 3 METHODS AND PROCEDURES
This chapter describes in detail how the experiment was designed and carried out.
3.1 Methods
3.1.1 Participants
One hundred people participated by responding to fliers posted on the Iowa State University campus and parts of Ames. Participants were at least 18 years old and indicated that they had normal vision. Participants were also required to have console video game experience (e.g. Xbox, Playstation) so that they would be familiar with the control device. The average reported number of hours spent playing video games per week was 10.88 (sd=9.45). If potential participants did not have prior video game experience they were not allowed to participate. All participants signed informed consent paperwork before the experiment started. Participants were paid ten dollars for their time.
3.1.2 Apparatus
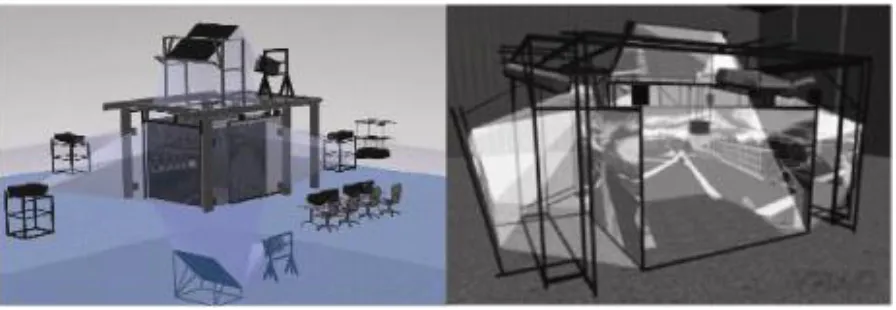
The experiment was conducted using two immersive VR devices at Iowa State University, the C6 and the C4. The C6, shown in Figure 7, is a six-walled CAVE display
device with each wall consisting of a 10‟x 10‟ stereoscopic screen (Cruz et al, 1992, Iowa
State, 2005).
The C4 is a similar system, but is a four-walled CAVE and the walls measure 9'x12'.
The horizontal viewing angle for three vertical walls was 259.6°and for one horizontal wall,
81.2°. The vertical viewing angle for one vertical and one horizontal wall was 113.19° and
for one vertical wall alone, 63.8°. Conditions that needed four walls were run in the C6 and
conditions that needed three walls or one wall were run in the C4. For the condition in which
Logitech Cordless Rumblepad to control their movement and selections in the virtual
environment. Participants stood facing the front screen from 84” and did not move from that
spot until the simulation was over. Participants were allowed to look in any direction that
they wanted while the simulation was running.
3.2 Procedures
3.2.1 Design
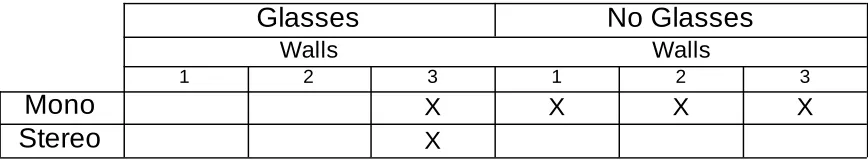
[image:33.612.93.541.89.244.2]Participants were randomly assigned to one of five conditions (4 walls stereo, 4 walls glasses mono, 4 walls no glasses mono, 3 walls no glasses mono and 1 wall no glasses mono) in order to test the two experimental factors; the presence of stereo and field of view (FOV) while operating the Virtual Battlespace (Table 1 and Figure 8). Three of the conditions contained twenty participants, but the other two conditions had twenty-one and nineteen participants due to a labeling error (4 walls stereo and 4 walls glasses mono, respectively). This level of error does not impact the validity or reliability of the results.
Field of view (FOV) was tested by altering the number of projection walls used for three different conditions. The smallest FOV was one wall in front of the participant. The medium FOV was one wall in front of the participant and one wall on each side. The largest FOV was achieved using one wall in front, one on each side and one beneath the participant. One experimental condition used the large FOV setup of four walls, but the participant wore shutter glasses and the display was projected in stereo. The final condition had the same setup as the stereo condition, but the display was projected in mono in order to account for the potential effects to users in the stereo condition just from wearing active shutter glasses (Figure 8).
Glasses
No Glasses
Walls Walls
1 2 3 1 2 3
Mono
X X X X [image:34.612.90.524.135.216.2]Stereo
XParticipants were instructed that their task was to explore the environment so that they would be able to take a memory test on what was present and what was occurring during a battle simulation in the environment, while at the same time periodically focusing on alerts generated by the UAVs to classify videos of convoys as either “hostile” or “friendly.”
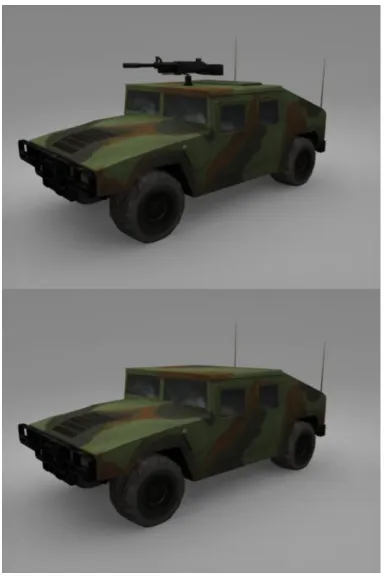
Participants were told to “Investigate what is happening in the environment so that you will be able to take a memory test at the end of the simulation about the events of the scenario and units involved”. All participants were then given the same instructions on how to use the game pad and some examples of what the scenario would look like and how to correctly identify the convoys. A hostile convoy was classified by any vehicle in the convoy carrying a weapon and the friendly convoy was devoid of weapons (Figure 9).
The simulation ran for approximately fifteen minutes. During this time participants navigated around the VE with the game pad to attempt to get their best possible
understanding of what was occurring. Twelve alerts at a frequency of one per minute were given to the participant while they were observing and navigating around the VE. When the participant was ready to view the alert, the simulation automatically moved them to the location that the alert was generated from (Figure 10). The task of determining whether or not the convoy is a threat serves two purposes for the experiment. The first is to identify the visual acuity difference between different experimental conditions. The secondary purpose of the alerts was to prevent the participants from staying in one location the entire time and to force them to constantly reorient themselves in the environment. Participants were only questioned about the scenario that played out in the VE and the units involved, but not their responses on the alerts.
The scenario is a simple, but representative, Air Force mission. Real missions would have a great deal more activity and visual clutter, but because participants were not
and red SAM sites and blue forces approach from the northeast. The swarm field is located to the south of the SAM sites and shows activity throughout the scenario. Eventually the blue
units reach the SAM sites and lose some units, but continue west to destroy all of the red air units and finally attack the red base.
3.2.2 Measures
Seven measures were used after the experiment in order to evaluate participants‟
performance on memory tasks as well as aspects of their experience in the simulation. Six
were qualitative, and one, the memory questionnaire, was quantitative. All instruments can
[image:38.612.74.507.212.512.2]be found in Appendix B. They first took a five-minute immersive tendency questionnaire,
then after receiving instructions, they did the simulation (15 minutes) and then completed six
other questionnaires within the hour.
The research focused on the measures of memory performance, but additional
instruments were chosen for two purposes: to explore potential correlations between the
conditions and these measures (i.e. immersive tendency, situation awareness and presence),
as well as noting factors that would add potential noise to the data (i.e. simulator sickness,
usability and workload).
3.2.2.1 Immersive Tendency Questionnaire
The first questionnaire that participants encountered was the Immersive Tendency Questionnaire (ITQ), which was used to infer the degree to which someone is likely to become immersed in a virtual environment (Witmer and Singer, 1998). Participants
completed this questionnaire before the simulation started. The ITQ uses a Likert scale (1-7) containing 29 items and asks questions such as “Do you easily become deeply involved in movies or TV dramas?” Ratings are averaged over the 29 questions to calculate the final instrument score. Higher scores indicate a greater tendency to become immersed in a virtual environment. The score can be used to predict scores on a presence questionnaire and determine if there is a difference between participants‟ presence scores due to experimental manipulations, or internal differences.
3.2.2.2 Memory Test
the simulation at given times, where units were located, and what they were doing. The questions were designed to test whether increasing FOV or incorporating stereo displays would affect participants‟ retention of information about their environment. This instrument was scored by assigning one point to each question, such that a perfect score was a 15.
3.2.2.3 User Questionnaire
Participants then answered open-ended questions about their experience during the simulation for additional usability information. Several of the questions asked participants to identify the strategies they used to view the environment, determine what was occurring and how they would move between different areas (i.e. from swarm to general battlefield). Other questions inquired as to what they liked and disliked about the simulation. The questionnaire also included how many hours per week the participant played video games.
3.2.2.4 Situation Awareness Rating Technique
Situation awareness was measured using the situational awareness rating technique (SART) (Taylor, 1989). This method was chosen rather than the SAGAT (Endsley, 1998)
because of the need to stop the simulation to perform it, whereas the SART is administered at
the conclusion. The SART is a subjective test that can be used in several versions that use
different numbers of questions. This experiment used the 10D SART, which uses ten
dimensions (one question for each dimension) that can be simplified into three main
components of situation awareness. These components include attentional demand,
variability of situation, and complexity of situation; attentional supply includes arousal, spare
mental capacity, concentration, and division of attention; and understanding involves
information quantity, information quality, and familiarity. Situation awareness is calculated
by subtracting the 'supply' factor from the 'demand' factor, then subtracting that from the
'understanding' factor (SA = U – (D – S)). Each factor score can range from 1-7 and the
overall score can range from 0-14, with higher numbers indicating higher levels of that
component.
3.2.2.5 Simulator Sickness Questionnaire
Total Nausea Oculomotor Disorientation
Slight 78.54 66.78 53.06 97.44
Moderate 157.08 133.56 106.12 194.88
[image:42.612.151.449.88.153.2]Severe 235.62 200.34 159.18 292.32
Table 2 All of the possible score ranges for each subscale and total score for the SSQ.
3.2.2.6 Presence Questionnaire
The Presence Questionnaire (PQ) was used to determine what degree of presence the participants felt during the simulation (Witmer and Singer, 1998). The PQ uses a Likert scale containing 32 items and asks questions such as 'How much did the visual aspects of the environment involve you?' Several items are reverse scored and then the questionnaire is summed to generate a total presence score, ranging from 32-224. Higher scores indicate a greater degree of presence experienced by the participant while in the virtual environment. Each question in the PQ is also scored as one or more of four factors related to presence; control, sensory, distraction and realism.
3.2.2.7 Workload Questionnaire (NASA-TLX)
Participants‟ perceived workload was measured using the NASA-TLX (Hart and Staveland, 1988). This is a subjective questionnaire that uses six factors with descriptions of each that the participant uses to indicate a higher or lower (score) with a Likert scale ranging from 1-7. The factors are mental demand, physical demand, temporal demand, effort,
CHAPTER 4 RESULTS
This chapter describes the analysis of the data. There are three main analyses
performed; correlational analysis was used to compare scores across conditions on each of
the measures, ANOVA was performed on the three conditions of field of view
manipulations, and t-tests were used to compare stereo versus mono displays and the use of
shutter glasses. The measures tested include simulator sickness (SS), situation awareness
(SA), workload (WL), memory, hours gaming and presence.
4.1 Correlation
A correlation matrix was created comparing every participant's scores on each
instrument (across groups), rather than between the different groups of participants, to
determine how all of the factors in the study were related. The memory tests, the number of
hours playing video games per week, and all of the subjective questionnaires, including their
subscales, were compared. Aside from intra-scale correlations, correlations were not higher
than 0.45. However, there were statistically significant correlations. Three positively
correlated regions emerged from the data; SS and WL, ITQ and PQ and SA, memory and
hours played. SS and WL have an r² = .29, p< .01. ITQ and PQ have an r²=.33, p < .01. SA
and memory have an r²=.35, p<.001 and SA and hours played only have an r²=.14, but the
SART sub-scale supply is correlated with hours played at r²=.21, p<.05. Memory and hours
played have an r² =.2, p<0.1.
One method of highlighting these groupings is by graphing them using a software
tool called PERMAP that enables a dataset to be viewed as nodes spaced out in relation to
one another in multiple dimensions to identify how objects interact (Figure 11) (PERMAP
object-to-object proximity or dissimilarity. To standardize the data for PERMAP, all of the
correlations were added by one and then divided by two, which made all of the values range
from zero to one instead of positive and negative correlations. PERMAP then maps out the
nodes with their proximity to one another based on their value. By doing this, items that were
positively correlated were closer to each other and further away from items that were
negatively correlated to them. Figure 12 indicates the correlations among the different
measures. Note that memory and SA are most highly correlated, while memory and presence
[image:44.612.148.474.307.651.2]are not highly correlated.
Aside from statistically significant results, the positive and negative correlations
between the measures provided valuable information about the general trends in the data, for
example, SS appears to have negative impact on presence and memory, but is reduced with
higher levels of video game playing. SA is positively related to hours of gaming and
immersive tendency (Table 3).
There were many intra-scale correlations: the presence scale correlated positively
with the sensory, control, realism and distraction scales (r²= .82, .84, .62 and .32,
respectively). The SART scale correlated positively with the understanding and supply
sub-scales: r²=.73 and .71. The SART scale was negatively correlated to the demand subscale:
r²=-.59. The workload scale was positively correlated with the mental, physical, temporal,
performance, effort and frustration scales r²=.64, .57, .68, .64, .39 and .52. The simulator
sickness questionnaire total was positively correlated with the nausea, oculomotor and
disorientation scales r²= .90, .93 and .95.
Hours ITQ Presence Memory SA WL SS
Hours 0.13 0.08 0.2 0.14 -0.14 -0.15
ITQ 0.33* 0.02 0.13 0.04 0.07
Presence 0.04 0.23* 0.07 -0.12
Memory 0.35* -0.07 -0.14
SA -0.06 -0.31*
WL 0.29*
[image:46.612.82.472.481.626.2]SS
4.2 Field of View
An ANOVA was performed to determine any significant differences between the
field of view manipulated conditions. There were two statistically significant results from the
field of view conditions. The first was physical workload (WL), with the four, three and one
wall conditions scoring 1.8, 1.7 and 1.2 out of 7 respectively (F(2,58) = 3.154, p=.05) (Figure
13). As shown by the significant bars, the four and three wall conditions did not have
[image:47.612.109.479.345.658.2]significantly different WL, but the WL for one wall was significantly less. The other
significant result was presence sub-scale control, (i.e. related to the degree to which
participants rated how easily it was to interact with the VE) with the four, three and one wall
conditions scoring 4.3, 4.6 and 3.6 out of 13 respectively (F(2,58) = 15.4, p=.001) (Figure
14). Each of the conditions has significantly different levels of control. High scores on these
scales indicate higher physical WL and presence control, respectively.
Outliers were calculated to be values that were plus or minus two times the standard
deviation. Upon removing outliers from the data (5 scores), the presence scores were found
to be significantly different across fields of view, with the four, three and one wall conditions
[image:48.612.99.476.70.407.2]scoring 132.2, 143.1 and 135.8 respectively (F(2,57) = 3.9, p=.03) (Figure 15).
To increase the chance of finding significant results between the different levels of field of
view, all of the conditions that used four walls to display the simulation were pooled
together. When ANOVA was performed with all of the four wall conditions pooled, the test
resulted in the frustration workload becoming significant too, indicating the same trend as the
physical workload, that the four wall condition produced the highest workload rating (Figure
[image:49.612.111.483.93.428.2]16). There was no significant difference between the conditions for memory (Figure 17).
Other analyses did not indicate significant results, but there were trends in some of
the data that may be indicators to be confirmed by future research. The other workload
sub-scales had the highest values for the 3 wall condition. This trend was also displayed on the
simulator sickness scores and presence scores (Figure 18(A)).
The opposite result was shown with the hours, SA supply and SA demand scores,
[image:51.612.136.489.68.429.2]with the 3 wall condition yielding the lowest score (Figure 18(B)).
The statistically non-significant data that displayed the downward trend in field of
view were memory, disorientation and overall workload (Figure 18(C)).
The data that showed an upward trend for field of view were total situation awareness
and understanding (Figure 18(D)).
All of the results for the field of view data, including the non- statistically significant
[image:52.612.104.534.284.590.2]values are contained in Table 4.
Figure X. Representations of the four trends displayed in the data.
Four Three One 0 0.25 0.5 0.75 1 1.25 1.5 1.75 2 A
Four Three One 0 0.25 0.5 0.75 1 1.25 1.5 1.75 2 B
Four Three One 0 0.25 0.5 0.75 1 1.25 1.5 1.75 2 C
Four Three One 0 0.25 0.5 0.75 1 1.25 1.5 1.75 2 D
Figure 18 Representations of the four trends displayed in the field of view data, as referenced
4 walls 3 walls 1 wall F Significance
Presence 133.8 143.1 135.75 2.83 0.07
Sensory 3.9 4.1 4 0.3 0.74
Control 4.3 4.6 3.6 15.4 0
Realism 3.4 3.6 3.5 0.46 0.63
Distraction 4.1 4.6 4.3 2.04 0.14
Memory 8.5 8.3 8.25 0.06 0.95
Situation Awareness 5.7 5.9 6.4 0.72 0.72
Understanding 12.9 13.2 13.6 0.15 0.86
Demand 10.1 9.5 9.7 0.19 0.83
Supply 14.3 14.6 15.1 0.38 0.69
Workload 3.04 3.18 2.67 2.88 0.06
Mental 4.9 4.5 4.4 0.05 0.95
Physical 1.9 1.7 1.2 3.2 0.05
Temporal 2 2.8 2.3 1.6 0.2
Performance 3 3.4 2.9 0.8 0.45
Effort 4 4.4 3.4 2.27 0.11
Frustration 2.95 2.4 2 2.63 0.08
Simulator Sickness 29.7 29.92 23.75 0.34 0.71
Nausea 26.8 30.1 14.3 1.55 0.22
Oculomotor 22.4 29.9 19.7 0.81 0.45
[image:53.612.84.537.95.519.2]Disorientation 50.4 43.8 31.3 0.71 0.5
4.3 Graphics
T-tests were performed to determine if there were any significant differences between
participants viewing the simulation in stereo or mono and if there were significant
differences for wearing shutter glasses or not.
4.3.1 Stereo vs. Mono
Presence scores were not significantly different between the stereo and mono
conditions. However, analyzing each item separately yielded items on the questionnaire that
were significant. The ability to move in the environment, the ability to search and the ability
to examine objects were all statistically significantly higher in the mono condition.
Statistically higher for the stereo condition were SSQ sub scales disorientation t(37) = -1.86,
Scores on the memory test were not significantly impacted by stereo and mono
[image:57.612.94.509.172.524.2]manipulations (Figure 21).
4.3.2 Glasses vs. No Glasses
Temporal workload was significantly higher for participants wearing glasses, with
[image:58.612.120.523.271.668.2]glasses participants scoring 3.1 and no glasses scoring 2.0, t(38) = 2.48, p = .01 (Figure 22).
Scores on the memory test were not significantly impacted by the presence or absence
[image:59.612.92.514.187.524.2]of shutter glasses (Figure 23).
CHAPTER 5 SUMMARY AND DISCUSSION
5.1 Analysis
The hypothesis that the highest level of immersion in the experiment will yield the
highest scores on a performance-based memory test and the secondary goal to determine
which factors (presence, situation awareness (SA), simulator sickness (SS) and workload
(WL)) influence performance were partially supported. Increasing the FOV from one wall to
three walls had a small positive effect on presence; however, increasing the number of walls
to four lowered presence ratings. Stereo did not have a positive effect on presence, possibly
due to the increased SS that the stereo condition caused. At no point did any of the
independent variables significantly affect participant's scores on memory, so there cannot be
the conclusion from this experiment that increasing immersion increases a user‟s memory of
the simulation. The data indicate that there can be a positive influence of increasing the field
of view in the simulation, but that it may also be possible that that amount of screen can
overload the user when four walls were used.
This research does not rule out, however, the potential benefits of using immersive
technology that allow a user to perform command and control functions from an egocentric
viewpoint. It is also possible that a difference could be found if the field of view was
decreased more for another condition, e.g. using a desktop computer display. The results
found may be specific for the ranges of field of view used and not generalizable to smaller
It appears that the use of stereo for this particular type of application is not beneficial
(i.e. obtaining task-important information is possible from a great distance); the only
statistically significant differences between the conditions favored the use of a mono
projection. The increase in SS caused by stereo may have led to the decrease in the three
elements of presence, and as those results were not mirrored by the glasses condition, the loss
of presence on the effects of wearing shutter glasses cannot be blamed.
The main performance metric was memory, and the data reveal several important
correlations that could attribute to better memory retention of the VE. As predicted, memory
is strongly correlated to situation awareness and negatively correlated to workload,
specifically the sub-scale frustration. Despite memory being significantly correlated with SA
and SA significantly correlated with presence, there was almost no correlation between
memory and presence. Although results did not show differences in memory through
experimental conditions, correlations have been identified that indicate how different factors
relate to memory retention in an immersive command and control application. By improving
these factors, such as increasing SA and decreasing SS, it could be expected that users would
retain more information from the VE.
Several studies have indicated that larger fields of view improve memory and spatial
tasks (Slater et al, 1996, Tan et al, 2003, and Czerwinski et al, 2003), but this experiment did
not find that result. Increasing the field of view has also been shown to increase presence
(Prothero & Hoffman, 1995) and increase simulator sickness (Seay et al, 2001), neither of
which were results replicated in this experiment. Memory and presence are positively
this experiment did not find the result to be significant nor significantly correlated to FOV as
Lin et al found.
Stereo graphics did produce some simulator sickness that was statistically significant,
as could be expected based on other research (Mollenhauer, 2004).
Overall, the increase in immersion unexpectedly had little impact, but situation
awareness was significantly correlated to memory, a long held belief (Ma & Kaber, 2007).
The results from this experiment add to the understanding of the attributes that are
related to memory performance in command and control; high SA, low WL frustration, and
higher hours playing video games. Also critical to understanding the entire picture is that SS
is significantly negatively correlated with SA and positively with WL, while presence is
significantly positively correlated to SA. This experiment also revealed that certain
differences between the levels of immersion may not have effects to memory.
5.2 User Feedback
This research was part of an iterative process to create a viable method for the future
visualization of the battlefield and management of UAVs, thus there was an attempt to
collect some usability information from participants to make future versions better and to
assist with interpreting the results of the other measures.
By sorting participants‟ comments, there were several themes that occurred
frequently. The first was the control scheme used: the two analog stick controller was a very
familiar method of interaction for most of the participants, but the mapping of the directions
was not what many of them had learned to expect in a 3D environment (e.g. first-person
shooters and flight simulators). This interfered with their ability to navigate and may have
Another common frustration that participants noted was that the simulation moved
too slowly and that it was hard to determine what was occurring because of this. This was a
problem within the experiment because it likely caused people to become bored and not pay
attention as much as they should, or possibly divert attention because they had a
misconception about the amount of activity that was actually occurring.
A final request brought up by many participants was that the icons include more
information, such as a squadron consisting of three planes would be marked with a '3' and
missiles would be graphically linked to the entity that fired them. Some participants felt that
the amount of information available to them was somewhat sparse and felt they would have
performed better with more information associated with the iconography and a method to log
information that they deemed important.
5.3 Implications
5.3.1 Command and Control Visualization
User feedback provided helpful insight for what pieces of information users needed to
adequately understand their environment. Other research has highlighted the importance of
salience in entities versus realism (Dragon) and this research affirms that notion because
users commented that numerical values would have been beneficial for keeping track of
UAV aggregates.
This experiment only lasted approximately fifteen minutes and numerous participants
indicated varying levels of eye and body fatigue from standing in the CAVE and holding the
controller. In actual military usage, users would be engaged for longer periods of time, thus
attention needs to be paid toward reducing the physical workload.
Many users had difficulty focusing on important things that occurred in the
environment. It would be helpful to investigate methods to guide users‟ attention to changes