Biogeosciences, 15, 3953–3965, 2018 https://doi.org/10.5194/bg-15-3953-2018 © Author(s) 2018. This work is distributed under the Creative Commons Attribution 4.0 License.
Stable isotopes of nitrate reveal different nitrogen processing
mechanisms in streams across a land use gradient during
wet and dry periods
Wei Wen Wong1, Jesse Pottage1, Fiona Y. Warry1, Paul Reich1,2, Keryn L. Roberts1, Michael R. Grace1, and Perran L. M. Cook1
1Water Studies Centre, School of Chemistry, Monash University, Clayton, 3800, Australia
2Arthur Rylah Institute for Environmental Research, Department of Environment, Land Water and Planning, Heidelberg, 3084, Australia
Correspondence:Wei Wen Wong ([email protected]) Received: 8 June 2017 – Discussion started: 4 October 2017
Revised: 22 May 2018 – Accepted: 1 June 2018 – Published: 2 July 2018
Abstract. Understanding the relationship between land use and the dynamics of nitrate (NO−3) is the key to constrain sources of NO−3 export in order to aid effective manage-ment of waterways. In this study, isotopic compositions of NO−3 (δ15N–NO−3 andδ18O–NO−3) were used to elucidate the effects of land use (agriculture in particular) and rain-fall on the major sources and sinks of NO−3 within the West-ern Port catchment, Victoria, Australia. This study is one of the very few studies carried out in temperate regions with highly stochastic rainfall patterns, enabling a more compre-hensive understanding of the applications of NO−3 isotopes in catchment ecosystems with different climatic conditions. Longitudinal samples were collected from five streams with different agriculture land use intensities on five occasions – three during dry periods and two during wet periods. At the catchment scale, we observed significant positive relation-ships between NO−3 concentrations (p< 0.05), δ15N–NO−3 (p< 0.01) and percentage agriculture (particularly during the wet period), reflecting the dominance of anthropogenic nitro-gen inputs within the catchment. Different rainfall conditions appeared to be major controls on the predominance of the sources and transformation processes of NO−3 in our study sites. Artificial fertiliser was the dominant source of NO−3 during the wet periods. In addition to artificial fertiliser, ni-trified organic matter in sediment was also an apparent source of NO−3 to the surface water during the dry periods. Denitri-fication was prevalent during the wet periods, while uptake of NO−3 by plants or algae was only observed during the dry periods in two streams. The outcome of this study suggests
that effective reduction of NO−3 load to the streams can only be achieved by prioritising management strategies based on different rainfall conditions.
1 Introduction
Anthropogenic sources of NO−3 from catchments can pose substantial risk to the quality of freshwater ecosystems (Vi-tousek et al., 1997; Galloway et al., 2004). Over-enrichment of NO−3 in freshwater systems is a major factor in devel-opment of algal blooms which often promote bottom water hypoxia and anoxia. Such anoxia intensifies nutrient recy-cling and can lead to disruption of ecosystem functioning and ultimately loss of biodiversity (Galloway et al., 2004; Car-mago and Alonso, 2006). Freshwater streams are often sites for enhanced denitrification (Peterson et al., 2001; Barnes and Raymond, 2010). However, when NO−3 loading from the catchment exceeds the removal and retention capacity of the streams, NO−3 is transported to downstream receiving wa-ters including estuaries and coastal embayments, which are often nitrogen-limited, further compounding the problem of eutrophication.
3954 W. W. Wong et al.: Nitrate isotopes in streams on a catchment scale
et al., 2011). To date, the most promising tool to investigate the sources and sinks of NO−3 are the dual isotopic com-positions of NO−3 at natural abundance level (expressed as
δ15N–NO−3 andδ18O–NO−3 in ‰). Preferential utilisation of lighter isotopes (14N and16O) over heavier isotopes (15N and 18O) leads to distinctive isotopic signatures that differenti-ate the various NO−3 sources/end members (e.g. inorganic and organic fertiliser, animal manure, atmospheric deposi-tion) and the predictable kinetic fractionation effect when NO−3 undergoes different biological processes (e.g. nitrogen fixation and denitrification). For instance, numerous previ-ous culture-based experiments revealed that denitrification and phytoplankton assimilation fractionate N and O isotopes equally (1 : 1 pattern), leaving behind NO−3 that is enriched in both15N and18O (Fry, 2006). Simultaneous measurement of
δ15N–NO−3 andδ18O–NO−3 also provides complementary in-formation on the cycling of NO−3 in the environment.δ18O– NO−3 is a more effective proxy of internal cycling of NO−3 (i.e. assimilation, mineralisation and nitrification) compared toδ15N–NO−3. This is because during NO−3 assimilation and mineralisation, N atoms are recycled between fixed N pools and the O atoms are removed and replaced by nitrification (Sigman et al., 2009; Buchwald et al., 2012).
In addition to constraining NO−3 budget and N cycling in various environmental settings, previous studies have also utilised the dual isotopic signatures of NO−3 to study the ef-fects of different land uses on the pool of NO−3 in headwater streams (Barnes and Raymond, 2010; Sebilo et al., 2003), creeks (Danielescu and MacQuarrie, 2013) and large rivers (Voss et al., 2006; Battaglin et al., 2001). Barnes and Ray-mond (2010) for example found that both δ15N–NO−3 and
δ18O–NO−3 varied significantly between urban, agricultural and forested areas in the Connecticut River watershed, USA. Several other investigators (Mueller et al., 2016; Mayer et al., 2002) showed positive relationships betweenδ15N–NO−3 and the percent of agricultural land in their study area, indicat-ing the applicability ofδ15N–NO−3 andδ18O–NO−3 to distin-guish NO−3 originating from different land uses. Danielescu and MacQuarrie (2013) and Chang et al. (2002) on the other hand found no correlations between NO−3 isotopes and land use intensities in the Trout River catchment and the Missis-sippi River basin, respectively. These studies attributed the lack of correlation to catchment size (Danielescu and Mac-Quarrie, 2013) and the homogeneity of land use (Chang et al., 2002).
Despite the extensive application of NO−3 isotopes to study the transport of terrestrial NO−3 to the tributaries in the catch-ment, the majority of these studies were carried out in the United States and western Europe where climatic conditions, for example temperature and rainfall patterns, are different compared to that in the Southern Hemisphere. The Southern Hemisphere tends to have more sporadic and variable rain-fall patterns compared to the Northern Hemisphere, and Aus-tralia is an example of this. The variable rainfall patterns can modulate different efficiencies of denitrification in soils and
thus different fractionation effects to the residual NO−3 pool (Chien et al., 1977; Billy et al., 2010). However, the lack of NO−3 isotope studies in the Southern Hemisphere (Ohte, 2013) impedes a more thorough understanding of NO−3 dy-namics within catchment ecosystems.
Most previous studies investigating the relationship be-tween land use and NO−3 export usingδ15N–NO−3 andδ18O– NO−3 have either focused on the seasonal or spatial varia-tions in one stream, or used multiple streams with one site per stream (i.e. Mayer et al., 2002; Yevenes et al., 2016). Far fewer studies have incorporated longitudinal sampling of multiple streams over multiple seasons. Nitrate concen-trations and concomitant isotopic signatures can change sub-stantially, not only spatially but temporally. Changes in hy-drological and physicochemical (notably temperature) con-ditions of a river can affect the relative contribution of dif-ferent sources of NO−3 and the seasonal predominance of a specific source (Kaushal et al., 2011; Panno et al., 2008). In some studies (e.g. Riha et al., 2014; Kaushal et al., 2011), denitrification and assimilation by plants and algae have been reported to be more prominent during the dry seasons com-pared to the wet seasons, but in other studies (e.g. Murdiyarso et al., 2010; Enanga et al., 2016) denitrification appeared to be more prevalent during the wet seasons as precipita-tion induces saturaprecipita-tion of soils, resulting in oxygen depleprecipita-tion and thereby low redox potentials that favour denitrification. As such, if spatial and temporal variations of δ15N–NO−3 andδ18O–NO−3 are not considered thoroughly in a sampling regime, it can lead to misinterpretation of the origin and fate of NO−3. Proper consideration of the temporal variability of NO−3 isotope signatures and transformation are particularly pertinent in catchments with highly stochastic rainfall pat-terns, such as Australia.
In this study, we examine both spatial and temporal vari-ations of NO−3 concentrations and isotopic compositions within and between five streams in five catchments span-ning an agricultural land use gradient, enabling us to eval-uate (1) the effects of agriculture land use on the sources and transformation processes of NO−3 and (2) the effects of rain-fall on the predominance of the sources and fate of NO−3 in the catchments.
2 Materials and methods 2.1 Study area
W. W. Wong et al.: Nitrate isotopes in streams on a catchment scale 3955
Bass Strait
WPB
Watson Lang Lang
Lower Bunyip
Bass Toomuc
km 0 10 20
N
Upper Bunyip
(63) (56) (43) (9) (2)
(24) (13)
(81) (75) (74)
(92) (92)
(96) (96) (74)
(78) (47)
(84)
[image:3.612.51.286.69.300.2](83) (81) (73)
Figure 1.Map of Western Port Bay (WPB) in southern Victoria, Australia, and major rivers discharging into WPB. Closed circles represent sampling sites where surface water samples were ob-tained. Values in parentheses represent the % agriculture area in the catchment.
catchments cover an area of 3721 km2with land uses rang-ing from semi-pristine/state forest to high-density residen-tial and intense agricultural activities. The area experiences a temperate climate with average annual rainfall ranging from 750 mm along the coast to 1200 mm in the northern high-lands. Mean monthly rainfall was about 20 and 53 mm in 2014 and 2015, respectively (Australian Bureau of Meteo-rology 2014 – http://www.bom.gov.au/, last access: 30 Apri 2016).
The catchment overlies a multi-layered combined aquifer system. The main aquifer consists of Quaternary alluvial and dune deposit (average thickness of < 7 m) as well as Bax-ter, Sherwood and Yallock formations (average thickness be-tween 20 and 175 m). These aquifers are generally uncon-fined with radial groundwater flow direction from the basin edge towards Western Port Bay. The hydrogeology of West-ern Port can be found in Carillo-Rivera (1975).
Five longitudinal surveys were carried out between April 2014 and May 2015, two during wet periods (14 April 2014; 15 May 2015 – the total rainfall for 5 days before sampling was between 45 and 65 mm) and three during dry periods (8 April 2014; 22 May 2014; 21 March 2015 – the total rain-fall for 5 to 10 days before sampling was < 5 mm). A total of 21 sampling sites indicated in Fig. 1 were selected across a gradient of catchment land use intensity. The five streams were selected based on the extent and distribution of land use types between and within each stream sub-catchment
(see Fig. S1 in the Supplement), thus enabling comparisons within and between the streams.
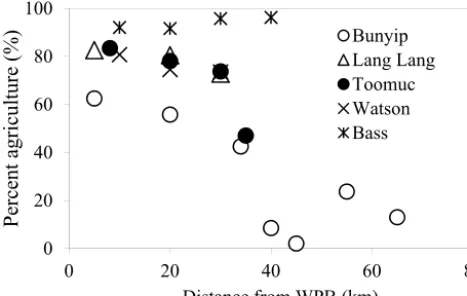
In this study, catchment-intensive agriculture was used as a predictor of land use intensity in the catchment. These data were obtained from the National Environmental Stream At-tributes database v1.1 (Stein et al., 2014), Bureau of Rural Sciences’ 2005/06 Land Use of Australia V4 maps (http:// www.agriculture.gov.au/abares/aclump, last access: 30 April 2016) and Victorian Resources Online (VRO). In the con-text of this study, the catchment-intensive agriculture vari-able is termed “percentage agriculture”. This term repre-sents the percentage of the catchment subject to intensive animal production, intensive plant production (horticulture and irrigated cropping) and grazing of modified pastures. This variable also reflects the integrated diffuse sources of nutrients derived from intense agriculture including animal manure and inorganic fertilisers. The percentage agricul-ture for the sampling sites ranged between 2 and 96 % with the Bass River (94±2 %) > Lang Lang (79±5 %) > Watsons (76±4 %) > Toomuc (71±16 %) > Bunyip (upper Bunyip: 12±9 %; lower Bunyip: 54±10 %; Fig. 2). For the pur-pose of this study, Bunyip is divided into two sectors (up-per and lower Bunyip) based on the proximity of the sam-pling sites (Fig. 1) and the percentage of land use. All the sampling sites in the upper Bunyip are situated in areas with > 30 % forestation (see Fig. S1). In general, the percentage agriculture decreases with increased distance from Western Port Bay (WPB) for all the streams except Bass River. There is an increase of about 2 % in percentage agriculture for Bass River with increased distance from WPB. Watsons Creek has the largest percentage of market gardens (∼91 %).
2.2 Sample collection and preservation
3956 W. W. Wong et al.: Nitrate isotopes in streams on a catchment scale
0 20 40 60 80 100
0 20 40 60 80
Percent agriculture
(%)
[image:4.612.50.284.69.217.2]Distance from WPB (km) Bunyip Lang Lang Toomuc Watson Bass
Figure 2.The percent agriculture upstream for each of the sampling sites.
2.3 DIN and DOC concentration measurements All chemical analyses were performed within 1–2 weeks of sample collection except for isotope analyses (within 2 months). The concentrations of NO−3, NO−2, and NH+4 were determined spectrophotometrically using a Lachat QuikChem 8000 Flow Injection Analyzer (FIA) follow-ing standard procedures (APHA 2005). DOC concentrations were determined using a Shimadzu TOC-5000 Total Organic Carbon analyser. Analysis of standard reference materials in-dicated the accuracy of the spectrophotometric analyses and the TOC analyser was always within 2 % relative error. 2.4 Isotopic analyses
The samples forδ15N–NO−3 andδ18O–NO−3 were analysed using the chemical azide method based on the procedure out-lined in McIlvin et al. (2005). In brief, NOx (NO−3 +NO−2) was quantitatively converted to NO−2 using cadmium reduc-tion and then to N2O using sodium azide. The initial NO−2 concentrations were insignificant, typically < 1 % relative to NO−3. Hence, the influence ofδ15N–NO−2 was negligible and the measured δ15N–N2O represents the signature of δ15N– NO−3. The resultant N2O was then analysed on a Hydra 20– 22 continuous flow isotope ratio mass spectrometer (CF-IRMS; Sercon Ltd., UK) interfaced to a cryoprep system (Sercon Ltd., UK). Nitrogen and oxygen isotope ratios are reported in per mil (‰) relative to atmospheric air (AIR) and Vienna Standard Mean Ocean Water (VSMOW), respec-tively. The external reproducibility of the isotopic analyses lies within±0.5 ‰ forδ15N and±0.3 ‰ forδ18O. The inter-national reference materials used were USGS32, USGS 34, USGS 35 and IAEA-NO−3. Lab-internal standards (KNO−3 and NaNO−2) with pre-determined isotopic values were also processed the same way as the samples to check on the effi-ciency of the analytical method. Theδ18O–H2O values were measured via equilibration with He–CO2 at 32◦C for 24 to 48 h in a Finnigan MAT Gas Bench and then analysed using
CF-IRMS. Theδ18O–H2O values were referenced to internal laboratory standards, which were calibrated using VSMOW and Standard Light Antarctic Precipitation. Measurement of two sets of triplicate samples in every run showed a precision of 0.2 ‰ forδ18O–H2O. Sediment samples for the analysis of δ15N of total nitrogen were dried at 60◦C before being analysed on the 20–22 CF-IRMS coupled to an elemental analyser (Sercon Ltd., UK). The precision of the elemental analysis andδ15N was 0.5 µg and±0.2 ‰ (n=5), respec-tively.
2.5 Data analysis
The relationships between percentage agriculture and sur-face water NO−3 concentrations were assessed using linear regression. Percentage agriculture was the predictor variable. NO−3 concentration andδ15N–NO−3 were response variables. Relationships betweenδ15N–NO−3 and NO−3 concentration as well asδ18O–NO−3 andδ15N–NO−3 were assessed using Pearson’s correlation. The NO−3 isotopes’ response variables were assessed at two spatial scales – individual stream and catchment scale. The catchment scale integrates data from all five studied streams. Any graphical patterns or relationships derived from using these scales represent processes that oc-cur somewhere in the catchment either in the streams or prior to entering the streams with data from the individual stream likely to represent more localised processes to that particular stream.
3 Results
The streams were oxic throughout the course of our study period with % DO saturation between 60 and 110 % (see Fig. S2 in the Supplement). There was no apparent spa-tial and temporal variation in DO; however, % DO satu-ration was slightly lower during the dry periods (average of 73±20 %) compared to the wet periods (average of 82±12 %). Temperature was also relatively consistent, with an average of 13±2◦C. Ammonium concentration was gen-erally low (< 4 µM) except during the wet periods in Bunyip (∼7 µM), Lang Lang (∼21 µM) and Bass (∼29 µM). DOC concentrations were typically 0.8±0.4 mM. Nitrite concen-trations were also low in all the streams, ranging between 0.1 and 0.4 µmol L−1.
The spatial and temporal variations of NO−3 concentration,
W. W. Wong et al.: Nitrate isotopes in streams on a catchment scale 3957
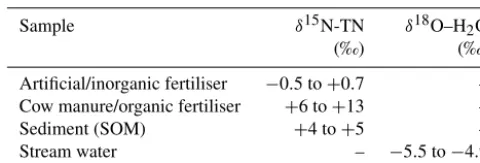
Table 1.The isotopic compositions of potential sources of NO−3 in the catchment.
Sample δ15N-TN δ18O–H2O
(‰) (‰)
Artificial/inorganic fertiliser −0.5 to+0.7 – Cow manure/organic fertiliser +6 to+13 –
Sediment (SOM) +4 to+5 –
Stream water – −5.5 to−4.9
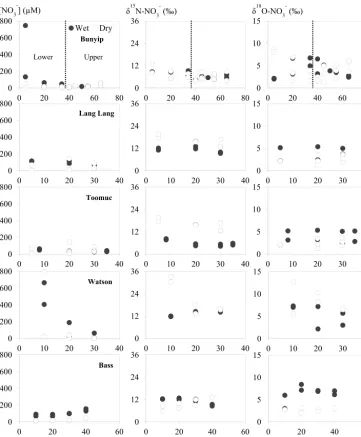
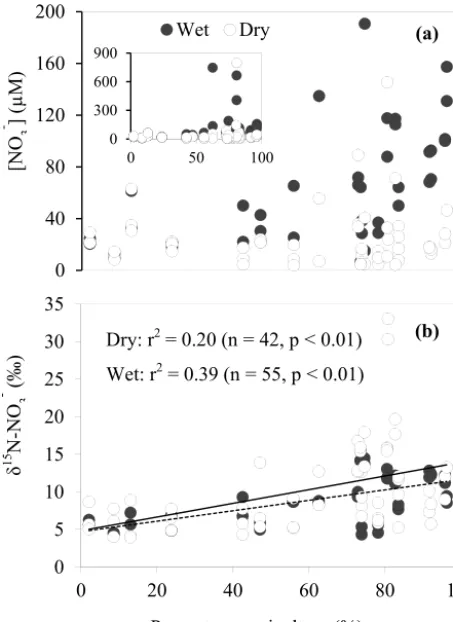
(Fig. 3). During the wet periods, NO−3 concentrations typi-cally followed an increasing trend heading downstream ex-cept for the Bass River which exhibited the opposite NO−3 trend with lower concentrations at downstream sites. Dur-ing the dry periods, only the Bunyip and Bass rivers showed apparent longitudinal patterns in NO−3 concentrations, with decreasing concentrations moving downstream in both. Sites with high-percentage agriculture generally also exhibited high NO−3 concentrations (Fig. 4), particularly during the wet periods.
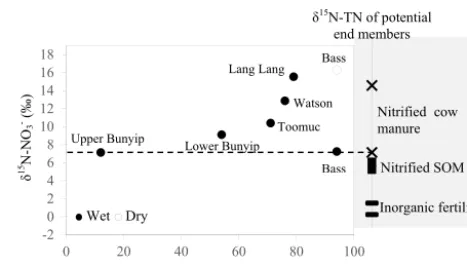
Overall,δ15N of the riverine NO−3 spanned a wide range (+4 to+33 ‰). Approximately 62 % of the obtainedδ15N– NO−3 values fell below+10 ‰. More enrichedδ15N–NO−3 values (>+10 ‰) were typically observed during the dry pe-riods and were coincident with a high-percentage agriculture (Fig. 4). Among all sites,δ15N–NO−3 values in the Bunyip and Bass were relatively depleted (+4 to+12 ‰ for Bunyip and+10 to 12 ‰ for Bass), with the lower range found at up-per Bunyip (+4 to+8 ‰). There was no discernible pattern spatially or temporally inδ18O–NO−3, except that higher val-ues were found in Lang Lang and Bass during the wet peri-ods, with+4 to+6 and+5 to+9 ‰, respectively, compared to the dry periods (<+4 ‰). For other sampling sites,δ18O– NO−3 ranged between+2 and+13 ‰. The isotope compo-sitions of sediment, water, artificial fertiliser and cow ma-nure/organic fertiliser are presented in Table 1. Theδ15N-TN of three potential sources – artificial fertiliser, organic fer-tiliser and soil organic matter – ranged from−0.5 to+0.7, +6 to+13 and+4 to+5 ‰, respectively.
4 Discussion
4.1 Potential sources of NO−3
There are three major potential sources of NO−3 in the catch-ments – artificial fertiliser, cow manure/organic fertiliser and soil organic matter (SOM) – see Table 1 for the δ15N-TN values. The average δ15N-TN value of soils is used to di-rectly represent the soil organic portion as most of the nitro-gen in soils is nitro-generally bound in organic forms. Nitronitro-gen isotope of the NO−3 produced from the potential end mem-bers usually retains the signature of theδ15N-TN as a result of tight coupling between mineralisation (production of
am-monium from organic matter) and nitrification (oxidation of ammonium to NO−3). Theδ18O of NO−3 generated by nitri-fication of these sources (δ18O–NO−3 final) is, however, de-coupled from δ15N–NO−3. As shown in Eq. (1), which is adapted from Buchwald et al. (2012),δ18O–NO−3 final relies on the oxygen isotope of water (δ18O–H2O), oxygen isotope of dissolved oxygen (δ18O–O2), kinetic isotope fractiona-tion associated with incorporafractiona-tion of oxygen during ammo-nia oxidation (18εk-O2), kinetic isotope fractionation asso-ciated with incorporation of oxygen from water during am-monia oxidation (18εk-H2O,1) and nitrite oxidation (18εk -H2O,2), equilibrium isotope effect associated with oxygen isotope exchange between nitrite and water (18εeq) as well as the fraction of nitrite oxygen atoms exchanged with H2O dur-ing ammonia oxidation (xAO) (Casciotti et al., 2010; Buch-wald et al., 2012). To date,18εk-O2and18εk-H2O cannot be separated. Previous culture studies have reported the over-all18εk-O2+18εk-H2O,1to range between 17.9 and 37.6 ‰ (Casciotti et al., 2010), while18εk-H2O,2 ranged from 12.8 to 18.2 ‰ (Buchwald and Casciotti, 2010). These values to-gether with a 18εeq value of 14 ‰, average δ18O–H2O of −5.3 ‰ andδ18O–O2of 23.5 ‰ were used to calculate the maximum and minimum estimates of theδ18O of newly pro-duced NO−3 from nitrification. The minimum estimate of
δ18O–NO−3 finalwas calculated using the lower range of18εk -O2+18εk-H2O,1(17.9 ‰) and18εk-H2O,2 (12.8 ‰), while the maximum estimate was calculated using the upper range of18εk-O2+18εk-H2O,1(37.6 ‰) and18εk-H2O,2(18.2 ‰). Based on the assumptions that ammonia was fully oxidised to NO−3 (as no accumulation of NO−2 was observed during our study period) and there was complete exchange of oxygen isotope between nitrite and H2O during ammonia oxidation (xAO=1), which likely characterises most freshwater sys-tems (Casciotti et al., 2007; Snider et al., 2010; Buchwald and Casciotti, 2013); we calculated the δ18O of produced NO−3 from nitrification to be between−2.03 and−0.23 ‰.
δ18ONO− 3final
= 2
3+ 1 3xAO
δ18OH2O
+1 3
h
δ18OO2− 18ε
k,O2− 18ε
k,H2O,1
(1−xAO)−18εk,H2O,2
i +2
3 18ε
eqxAO (1)
Theδ15N-TN of cow manure (+6 to+13 ‰) was most variable compared to other end members. This variation re-flects the extent of volatilisation, a highly fractionating pro-cess. Volatilisation can cause a fractionation effect of up to 25 ‰ in the residual NH+4 (Hübner, 1986). As such, the lower value of+6 ‰ indicates a relatively fresh manure sample and is assumed to represent the initialδ15N of the cow manure before undergoing any extensive fractionation.
dur-3958 W. W. Wong et al.: Nitrate isotopes in streams on a catchment scale
[NO3-] (µM)
0 200 400 600 800
0 20 40 60 80
Wet Dry
Bunyip
0 200 400 600 800
0 10 20 30 40
Lang Lang
0 200 400 600 800
0 10 20 30 40
Toomuc
0 200 400 600 800
0 10 20 30 40
Watson
0 200 400 600 800
0 20 40 60
Bass
0 5 10 15
0 20 40 60 80
0 5 10 15
0 10 20 30 40
0 5 10 15
0 10 20 30 40
0 5 10 15
0 10 20 30 40
0 5 10 15
0 20 40 60
δ18O-NO3- (‰)
0 12 24 36
0 20 40 60 80
0 12 24 36
0 10 20 30 40
0 12 24 36
0 10 20 30 40
0 12 24 36
0 10 20 30 40
0 12 24 36
0 20 40 60
δ15N-NO3- (‰)
Distance from WPB (km)
[image:6.612.121.483.67.505.2]Lower Upper
Figure 3.Spatial and temporal variations of nitrate concentrations and isotope values. Closed circles represent data obtained during the wet periods. Open circles represent data obtained during the dry periods.
ing the wet periods, and from +1.5 to +13 ‰ during the dry periods) of the riverine samples. Theδ18O–NO−3 of at-mospheric deposition were reported to range from +60 to +95 ‰ in the literature (Kendall, 2007; Elliott et al., 2007; Pardo et al., 2004). Similarly, groundwater was not consid-ered as an important source of NO−3 to the streams based on the low NO−3 concentrations (∼0.7 to 7.0 µM) reported in previous studies (Water Information System Online; http: //data.water.vic.gov.au/monitoring.htm, last access: 29 April 2016).
4.2 General characteristics of NO−3 in the streams
W. W. Wong et al.: Nitrate isotopes in streams on a catchment scale 3959
δ
15
N-N
O 3
- (‰)
0 5 10 15 20 25 30 35
0 20 40 60 80 100
[N
O 3
- ] (µ
M)
0 40 80 120 160 200
Wet Dry
0 300 600 900
0 50 100
Percentage agriculture (%) Dry: r = 0.20 (n = 42, p < 0.01) 2 Wet: r = 0.39 (n = 55, p < 0.01) 2
(a)
[image:7.612.52.279.68.379.2](b)
Figure 4.Relationship between(a)NO−3 concentration,(b)δ15N– NO−3 and the percentage of agricultural land use. In(b)the solid line represents the relationship between the variables during dry pe-riods; the dotted line represents wet periods.
NO−3 in the stream originated from agricultural activities. In fact, the most enrichedδ15N–NO−3 values (> 30 ‰) were ob-served at the most downstream site of Watsons Creek which has the largest percentage of market gardens (although the total agricultural area is not the highest amongst all the stud-ied sites). We also observed a significant positive relation-ship between δ15N–NO−3 and percentage agriculture during the wet periods (r2=0.39,p< 0.01; Fig. 4b). This further supports the contention that agricultural activities were the main control of the δ15N–NO−3 in the streams. Other re-searchers (e.g. Mayer et al., 2002; Voss et al., 2006) have also documented similar trends of enrichedδ15N–NO−3 with increasing percentage agriculture. For example, Harrington et al. (1998), Mayer et al. (2002) and Voss et al. (2006) ob-served highly significant positive relationships between per-centage agriculture land area andδ15N–NO−3 withr2∼0.7. However, these studies showed comparatively narrower and more depleted ranges of δ15N–NO−3, with 2.0 to 7.3, 4 to 8 and −0.1 to 8.3 ‰, respectively, suggesting more subtle changes inδ15N–NO−3 over a large span of agriculture land areas in these studies compared to our study (see Table 2).
Given that none of the predicted sources of NO−3 in the Western Port catchment exhibited an initialδ15N–NO−3 of more than +6 ‰ (see Table 1), the isotopically enriched NO−3 as well as the variability of NO−3 concentrations ob-served in this study were consequences of a series of transfor-mation processes. Hence, we propose the following factors to explain the heavy isotopes and the different NO−3 concentra-tions across different periods observed in our study.
1. During the wet period when surface runoff was con-spicuous and residence time of the water column was low, in-stream NO−3 was comprised mainly of exter-nally derived NO−3 (i.e. fertilisers, manure and soil or-ganic matter) and there was limited in-stream process-ing of these NO−3. The high NO−3 concentrations and the heavyδ15N–NO−3 values reflect the occurrence of mineralisation, nitrification and subsequent preferential denitrification of the isotopically lighter NO−3 source/s in either the waterlogged soil or in the soil zone under-neath the market gardens before transport to the streams through surface runoff.
2. During the dry periods when surface runoff was negli-gible and residence time of the water column was high, there was minimal introduction of external NO−3 into the streams and in-stream processing of NO−3 was more apparent than during the wet periods. In addition to min-eralisation and nitrification, volatilisation and assimila-tion by plant and algae were highly likely to occur in the stream, further reducing the NO−3 concentration and further fractionating the isotopic signature of NO−3. These processes are conceptualised in Fig. 5 and are cor-roborated in the following discussion using two graphical methods: the Keeling plot and the isotope biplot. In an agri-cultural watershed, the co-existence of multiple sources and transformation processes can potentially complicate the use of NO−3 isotopes as tracers of its origin. Keeling plots (δ15N– NO−3 vs. 1/[NO−3]) are generally very useful to distinguish between mixing and fractionation (i.e. assimilation and bac-terial denitrification) processes (Kendall et al., 1998). The latter typically results in progressively increasingδ15N–NO−3 values as NO−3 concentrations decrease and yields a curved Keeling plot. Meanwhile, mixing of NO−3 from two or more sources can result in a concomitant increase in bothδ15N– NO−3 and NO−3 concentrations and results in a straight line on the Keeling plot (Kendall et al., 1998). A biplot (δ18O– NO−3 vs.δ15N–NO−3) on the other hand is a proven diagnos-tic method to elucidate the presence of two isotope fraction-ating processes: assimilation and denitrification.
4.3 Key controlling processes of nitrate during the wet periods
3960 W. W. Wong et al.: Nitrate isotopes in streams on a catchment scale
Figure 5.Conceptual diagram illustrating the sources and processes of NO−3 during the wet and dry periods in the Western Port catchment. The values of the enrichment factor (ε) were obtained from the literature (Kendall et al., 2007) to indicate the relative contribution of the transformation processes to the isotopic compositions of the residual NO−3.
0 10 20 30
0 10 20
0 10 20 30
0 5 10
0 10 20 30
0 10 20
0 10 20 30
0 10 20
0 10 20 30
0 10 20
0 10 20 30
0 10 20
0 5 10 15 20 25
0 5 10
Upper Bunyip y-intercept: 7.1 ‰ r = 0.52, p < 0.001 2
0 5 10 15 20 25
0 5 10
Bunyip y-intercept: 8.8 ‰ r = 0.62, p < 0.001 2
0 5 10 15
0.0 0.5 1.0 1.5 Lang Lang
y-intercept: 15.5 ‰ r = 0.68, p < 0.001 2
0 5 10 15 20 25
0 1 2 3
Toomuc y-intercept: 10.4 ‰ r = 0.69, p < 0.001 2
0 5 10 15 20
0 5 10 15
Watson y-intercept: 12.9 ‰ r = 0.62, p < 0.001 2
0 5 10 15
0.0 0.5 1.0 1.5 Bass
y-intercept: 7.2 ‰ r = 0.52, p < 0.001 2
0 10 20 30
0 2 4 6
Bass
y-intercept: 16.3 ‰ r2 = 0.86, p < 0.001
1/[NO3-]
δ
15
N-N
O3
- (‰
)
Wet period Dry period
0 5 10 15 20 25
0 2 4
Lower Bunyip y-intercept: 9.1 ‰ r = 0.37, p < 0.001 2
Dry period Wet period
1/[NO3-]
1/[NO3-] 1/[NO3-]
[image:8.612.119.484.393.661.2]W. W. Wong et al.: Nitrate isotopes in streams on a catchment scale 3961
NO−3 and [NO−3] as well as betweenδ18O–NO−3 andδ15N– NO−3 for the individual streams (shown in Supplement Fig. S3). If denitrification was dominant, both δ15N–NO−3 and
δ18O–NO−3 values are expected to increase in a 1 : 1 pattern at low NO−3 concentration – a trend which has been proven by numerous culture-based experiments to indicate the oc-currence of denitrification (Granger and Wankel, 2016). In addition, high DO in the water column ruled out the possibil-ity of pelagic denitrification.
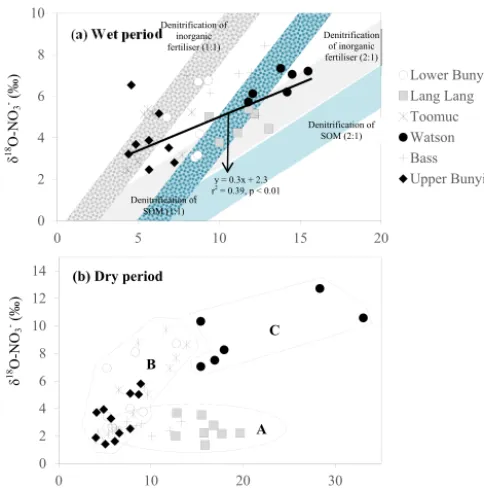
Careful examination of the Keeling plots for individual streams (Fig. 6) revealed that during the wet periods, NO−3 concentrations were significantly and linearly correlated with 1/[NO−3] in all the streams. These relationships strongly sug-gest mixing between two sources (with distinctive isotopic signatures) as the dominant process regulating the isotopic composition of the residual NO−3 in the streams during the wet periods. The different trends in the Keeling plots (Fig. 6) for individual streams indicate that the isotopic signature of the dominant NO−3 source varied temporally and spatially across the catchments. Negative trends on the Keeling plots for Bunyip, Lang Lang and Toomuc (Fig. 6) clearly show that the dominant NO−3 source was isotopically enriched (above +10 ‰ for Bunyip and Toomuc and+14 ‰ for Lang Lang), while the positive trends on the Keeling plots for Bass and Watsons show that the dominant NO−3 source was more iso-topically depleted (less than +8 ‰ for Bass and less than +9 ‰ for Watsons). Nevertheless, the isotopic signatures of the dominant source indicated by the y-intercepts of the Keeling plots were a lot more enriched than the initialδ15N– NO−3 of all three pre-identified NO−3 end members. Inter-estingly, theseδ15N–NO−3 values increased with percentage agriculture, except for Bass (Fig. 7). The fact that there was a clear fractionation pattern (∼2 : 1) when integrating the isotope values of all the streams (catchment scale) suggests that denitrification was still prevalent during the wet peri-ods (Fig. 8a), but this process was more likely to occur prior to NO−3 entering the streams via surface runoff. We explain these observations on the basis that increased rainfall created a “hot moment” in the soil whereby organic matter mineral-isation and nitrification were stimulated, followed by deni-trification within the waterlogged soil. Waterlogging can re-sult in root anoxia and increased denitrification, leading to significant isotopic enrichment of the residual NO−3 (Chien et al., 1977; Billy et al., 2010), which was then washed into the streams. The extent of this process (mineralisation– nitrification–denitrification) was greatest at Bass and Wat-sons, sites with the highest agricultural activity (Fig. 8a). Based on Fig. 8a, the isotope enrichments of the riverine NO−3 followed the denitrification trend of the artificial fer-tiliser and the NO−3 isotopes were distributed in between the denitrification ranges of both artificial fertiliser and SOM, suggesting the important contributions of these two sources during the wet periods.
In fact, the deviation of theδ15N–NO−3 :δ18O–NO−3 from the 1 : 1 trend to 2 : 1 corroborates the co-existence of other
Nitrified cow manure
Nitrified SOM
Inorganic fertiliser δ15N-TN of potential
end members
-2 0 2 4 6 8 10 12 14 16 18
0 20 40 60 80 100
ry Wet D Upper Bunyip
Lower Bunyip Toomuc
Watson Lang Lang Bass
Bass
δ
15
N-N
O3 - (‰)
[image:9.612.311.545.65.198.2]Percentage agriculture (%)
Figure 7.Relationship betweenδ15N–NO−3 of the dominant initial source (indicated by they-intercept of the Keeling plots; Fig. 6) and percentage agriculture during wet periods. Data for the Bass-dry pe-riod were also presented because only the Keeling plot for the Bass-dry period indicates mixing between different sources. The shaded area represents theδ15N–NO−3 of the potential end members.
processes in our system (i.e. nitrification and/or anammox) in addition to denitrification. Based on the multi-process model developed by Granger and Wankel (2016), the negative de-flation of the denitrification trend (1 : 1) is strongly driven by concurrent NO−3 production catalysed by nitrification and/or anammox (Granger and Wankel, 2016) when the rate of NO−3 reduction to NO−2 (via denitrification) is higher than the rate of NO−2 oxidation to NO−3 (via nitrification and/or anam-mox). A higher reduction rate of NO−3 to NO−2 tends to cre-ate a NO−2 pool with enrichedδ15N due to isotopic fraction-ation (0 to 20 ‰) during the reduction of NO−2 to N2 (the last step of denitrification). The subsequent oxidation of the
δ15N-enriched NO−2 leads to the production of NO−3 which is isotopically more enriched than denitrified NO−3 owing to inverse kinetic fractionation effects (−35 to 0 ‰), driving the negative deviation ofδ18O–NO−3 :δ15N–NO−3 from the 1 : 1 trend (Granger and Wankel, 2016). During the wet periods, simultaneous occurrence of these three processes (nitrifica-tion, annamox and denitrification) was plausible due to the redox dynamics in the waterlogged soil zone. Downward per-colation of oxygenated rain water could induce nitrification while denitrification and anammox could be promoted in the anoxic interstitial spaces of the waterlogged soil zone. 4.4 Key controlling processes of nitrate during the dry
periods
Unlike the wet periods, only NO−3 in the Bass River showed an apparent relationship withδ15N–NO−3 (Fig. 6) during the dry periods. There was no obvious relationships between
peri-3962 W. W. Wong et al.: Nitrate isotopes in streams on a catchment scale
0 2 4 6 8 10 12 14
0 10 20 30
(b) Dry period
δ
18
O-N
O3 - (‰)
δ15N-NO 3- (‰)
C
B
A (a) Wet period
δ
18
O-N
O3 - (‰)
0 2 4 6 8 10
0 5 10 15 20
Lower Bunyip Lang Lang Toomuc Watson Bass Upper Bunyip
Denitrification of inorganic fertiliser (1:1)
Denitrification of SOM (1:1)
Denitrification of SOM (2:1)
Denitrification of inorganic fertiliser (2:1)
[image:10.612.47.289.66.310.2]y = 0.3x + 2.3 r2 = 0.39, p < 0.01
Figure 8. Biplot ofδ15N–NO−3 vs. δ18O–NO−3 for(a) wet and
(b) dry periods. The blue shaded area represents possible iso-topic compositions of denitrified NO−3 originated from SOM (δ15N:
+4.5 ‰). The grey shaded area represents the possible isotopic composition of denitrified NO−3 originated from inorganic fer-tiliser (δ15N–NO−3:+0.1 ‰). Theδ18O–NO−3 used were−2.3 and
±0.23 ‰ representing the minimum and maximum estimates of δ18O of nitrified NO−3, respectively. The shaded areas were plotted based on the theoretical 1 : 1 and 2 : 1 denitrification relationships betweenδ15N–NO−3 andδ18O–NO−3 (Kendall et al., 2007).
ods, none of the samples show a noticeable pattern of denitri-fication on a biplot ofδ18O vs.δ15N (Fig. 8b). The isotopic composition of the riverine NO−3 appeared to be clustered into three groups (A, B and C in Fig. 8b).
NO−3 in group A showed consistent δ18O but variable
δ15N. This is demonstrated by the Lang Lang and Bass, co-incident with the highest percentage of agriculture. The con-sistentδ18O (δ18O of∼2.5 ‰) shows the importance of ni-trification (δ18O of ∼ −2.03 to −0.23 ‰) and at the same time ruled out the occurrence of denitrification and assimila-tion. In the absence of the removal processes, the heavy and variableδ15N–NO−3 values (+6 to +20 ‰) imply that ani-mal manure was an apparent source of NO−3 during the dry periods for Lang Lang and Bass. This is because volatilisa-tion of14N ammonia from the animal manure over time can lead to enrichment of 15N in the residual NH+4 to >+20 ‰ (Bateman and Kelly, 2007) which can subsequently be nitri-fied to produce isotopically enriched NO−3 without affecting its δ18O–NO−3. Tight coupling between mineralisation and nitrification results in NO−3 retaining the isotopic signature of the residual NH+4 (Deutsch et al., 2009) in the manure. Hence, it is not surprising that δ15N–NO−3 >+13 ‰ in the
δ
18
O-N
O3
- (‰)
δ15N-NO
3- (‰) 0
2 4 6 8 10 12
2 4 6 8 10 12 14 16 18
Group B data
Bunyip
Toomuc Assimilation
of SOM
Assimilation of inorganic fertiliser
Assimilation of organic
fertiliser
Slope = 0.75 r2 = 0.48, p<0.01
[image:10.612.311.547.70.217.2]Slope = 0.78 r2 = 0.71, p<0.01
Figure 9.Biplot ofδ15N–NO−3 vs. δ18O–NO−3 for Bunyip and Toomuc (group B data in Fig. 8b). Shaded areas represent theo-retical assimilation trends for cow manure, SOM and inorganic fer-tiliser. The maximum and minimum starting values forδ18O–NO−3 were estimated from Eq. (1). The startingδ15N–NO−3 is theδ15 N-TN value of respective end member. Solid and dotted lines represent the assimilation trends for Bunyip (both lower and upper Bunyip) and Toomuc, respectively. Assimilation rather than denitrification was considered a more plausible process controlling the distribu-tion pattern for the group B dataset as the water column was oxic throughout the study period.
group A dataset is indicative of nitrified “aged” animal ma-nure. Because of the huge variability in the fractionation ef-fect of ammonia volatilisation, it is difficult to affix an aver-ageδ15N value to represent the isotopic signature of this end member. As such, apportioning the relative contribution of nitrified manure versus other sources (nitrified organic mat-ter in the sediment and inorganic fertiliser) is not possible.
W. W. Wong et al.: Nitrate isotopes in streams on a catchment scale 3963
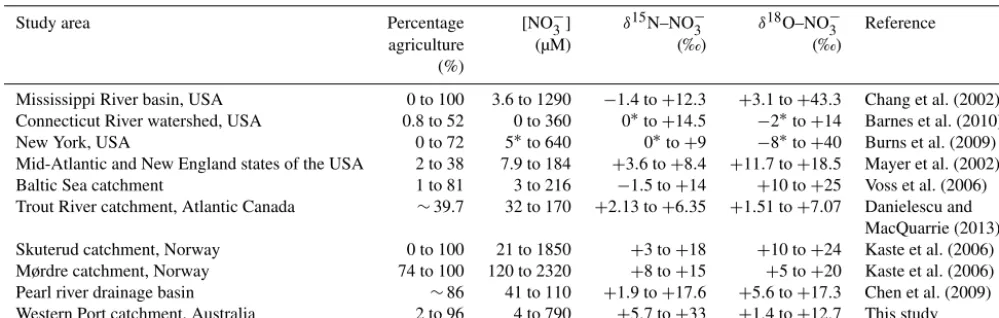
Table 2.Comparison of NO−3 concentrations and isotopes across different systems reported in the literature.
Study area Percentage [NO−
3] δ15N–NO
−
3 δ18O–NO
−
3 Reference
agriculture (µM) (‰) (‰)
(%)
Mississippi River basin, USA 0 to 100 3.6 to 1290 −1.4 to+12.3 +3.1 to+43.3 Chang et al. (2002)
Connecticut River watershed, USA 0.8 to 52 0 to 360 0∗to+14.5 −2∗to+14 Barnes et al. (2010)
New York, USA 0 to 72 5∗to 640 0∗to+9 −8∗to+40 Burns et al. (2009)
Mid-Atlantic and New England states of the USA 2 to 38 7.9 to 184 +3.6 to+8.4 +11.7 to+18.5 Mayer et al. (2002)
Baltic Sea catchment 1 to 81 3 to 216 −1.5 to+14 +10 to+25 Voss et al. (2006)
Trout River catchment, Atlantic Canada ∼39.7 32 to 170 +2.13 to+6.35 +1.51 to+7.07 Danielescu and
MacQuarrie (2013)
Skuterud catchment, Norway 0 to 100 21 to 1850 +3 to+18 +10 to+24 Kaste et al. (2006)
Mørdre catchment, Norway 74 to 100 120 to 2320 +8 to+15 +5 to+20 Kaste et al. (2006)
Pearl river drainage basin ∼86 41 to 110 +1.9 to+17.6 +5.6 to+17.3 Chen et al. (2009)
Western Port catchment, Australia 2 to 96 4 to 790 +5.7 to+33 +1.4 to+12.7 This study
∗Values estimated from presented figures might not accurately represent the actual data.
NO−3 in group C comprised the most enrichedδ15N and
δ18O in the entire dataset (Fig. 8). These isotope values were observed in Watsons Creek which has the highest percent-age of market gardens. These samples were collected when the creek was not flowing, hence the enrichedδ15N andδ18O values could be indications of repeated cycles of internal pro-cesses (i.e. volatilisation, nitrification, denitrification and as-similation) in the same pool which enriched the N isotope but had slight effects on the O isotope of NO−3.
Although the isotope values during the dry periods ap-peared to be more likely controlled by artificial fertiliser and SOM, the contribution from organic fertiliser cannot be excluded. As mentioned in the preceding text, most of the fertiliser-derived NO−3 was denitrified in the catchment dur-ing the wet periods creatdur-ing an artefact of heavy NO−3 iso-topes in the streams. This NO−3 could exhibit a similar en-riched isotopic composition as the volatilised manure (par-ticularly if there was disequilibrium of O isotope between NO−2 and H2O). Overlapping of these isotopic values made it difficult to distinguish between all the three sources – a dis-advantage of using NO−3 isotopes in a system where multiple sources and transformation processes coexist.
5 Conclusions
This study highlights the effect of rainfall conditions on the predominance of sources and transformation processes of NO−3 on both individual stream and catchment scale. The significant positive relationships between percentage agricul-ture and NO−3 concentrations (r2=0.29; p< 0.05) as well as δ15N–NO−3 (r2=0.39;p< 0.01) particularly during the wet period showed that enriched NO−3 concentrations and
δ15N–NO−3 values resulted from agricultural activities. The dual isotopic compositions of NO−3 revealed that both mix-ing of diffuse sources and biogeochemical attenuation con-trolled the fate of NO−3 in the streams of the Western Port
catchments. During the wet periods, inorganic fertiliser ap-peared to be the primary source of NO−3 to the streams while SOM, in addition to inorganic fertiliser was also a domi-nant source of NO−3 during the dry periods. Denitrification in the catchment appeared to be the more active removal pro-cess during the wet periods in contrast to a greater impor-tance of in-stream assimilation during the dry periods. How-ever, these removal processes were insufficient to remove the agricultural-derived NO−3 inferring that the streams were un-reactive conduits of NO−3 which might pose a potential NO−3 enrichment threat to downstream ecosystems. To the best of our knowledge, this is the first study in Australia and also one of the very few targeted studies in the Southern Hemi-sphere investigating the origin and sink of NO−3 on a catch-ment scale using bothδ15N andδ18O of NO−3. The applica-tion of NO−3 isotopes in a region with highly variable and un-predictable rainfall patterns such as the Western Port catch-ments, although challenging, is imperative particularly in set-ting guidelines for sustainable land use management actions.
Data availability. The data related to this article are available
on-line at https://doi.org/10.4225/03/5b2c683663395.
Supplement. The supplement related to this article is available
online at: https://doi.org/10.5194/bg-15-3953-2018-supplement.
Competing interests. The authors declare that they have no conflict
of interest.
Acknowledgements. We thank the associate editor and the
3964 W. W. Wong et al.: Nitrate isotopes in streams on a catchment scale
samples of cow manure. This work was supported by Melbourne Water Corporation and an Australian Research Council Grant (LP130100684) to PLMC.
Edited by: Manmohan Sarin
Reviewed by: three anonymous referees
References
Barnes, R. T. and Raymond, P. A.: Land-use controls on sources and processing of nitrate in small watersheds: in-sights from dual isotopic analysis, Ecol. Appl., 20, 1961–1978, https://doi.org/10.1890/08-1328.1, 2010.
Bateman, A. S. and Kelly S. D.: Fertilizer nitrogen iso-tope signatures, Isot. Environ. Healt. S., 43, 237–247, https://doi.org/10.1080/10256010701550732, 2007.
Battaglin, W. A., Kendall, C., Chang, C. C. Y., Silva, S. R., and Campbell, D. H.: Chemical and isotopic evidence of nitrogen transformation in the Mississippi River, 1997–1998, Hydrol. Pro-cess., 15, 1285–1300, https://doi.org/10.1002/hyp.214, 2001. Billy, C., Billen, G., Sebilo, M., Birgand, F., and Tournebize,
J.: Nitrogen isotopic composition of leached nitrate and soil organic matter as an indicator of denitrification in a sloping drained agricultural plot and adjacent uncultivated riparian buffer strips, Soil Biol. Biochem., 42, 108–117, https://doi.org/10.1016/j.soilbio.2009.09.026, 2010.
Buchwald, C. and Casciotti, K. L.: Oxygen isotopic fractionation and exchange during bacterial ni-trite oxidation, Limnol. Oceanogr., 55, 1064–1074, https://doi.org/10.4319/lo.2010.55.3.1064, 2010.
Buchwald, C. and Casciotti, K. L.: Isotopic ratios of nitrite as tracers of the sources and age of oceanic nitrite, Nat. Geosci., 6, 308– 313, https://doi.org/10.1038/ngeo1745, 2013.
Buchwald, C., Santoro, A. E., McIlvin, M. R., and Cas-ciotti, K. L.: Oxygen isotopic composition of nitrate and nitrite produced by nitrifying cocultures and natural ma-rine assemblages, Limnol. Oceanogr., 58, 1361–1375, https://doi.org/10.4319/lo.2012.57.5.1361, 2012.
Burns, D. A., Boyer, E. W., Elliott, E. M., and Kendall, C.: Sources and transformations of nitrate from streams draining varying land uses: Evidence from dual isotope analysis, J. Environ. Qual., 38, 1149–59, https://doi.org/10.2134/jeq2008.0371, 2009.
Carillo-Rivera, J. J.: Hydrogeology of Western Port, Geological Survey of Victoria, 1975.
Carmargo, J. A. and Alonso, A.: Ecological and toxicologi-cal effects of inorganic nitrogen pollution in aquatic ecosys-tems: A global assessment, Environ. Int., 32, 831–849, https://doi.org/10.1016/j.envint.2006.05.002, 2006.
Casciotti, K. L., Böhlke, J. K., McIlvin, M. R., Mroczkowski, S. J., and Hannon, J. E.: Oxygen isotopes in nitrite: Analy-sis, calibration, and equilibration, Anal. Chem., 79, 2427–2436, https://doi.org/10.1021/ac061598h, 2007.
Casciotti, K. L., McIlvin, M., and Buchwald, C.: Oxy-gen isotopic exchange and fractionation during bacte-rial ammonia oxidation, Limnol. Oceanogr., 55, 753–762, https://doi.org/10.4319/lo.2010.55.2.0753, 2010.
Chang, C. C. Y., Kendall, C., Silva, S. R., Battaglin, W. A., and Campbell, D. H.: Nitrate stable isotopes: Tools for
determin-ing nitrate sources among different land uses in the Missis-sippi River Basin, Can. J. Fish. Aquat. Sci., 59, 1874–1885, https://doi.org/10.1139/F02-153, 2002.
Chen, F., Jia, G., and Chen, J.: Nitrate sources and water-shed denitrification inferred from nitrate dual isotopes in the Beijiang River, South China, Biogeochemistry, 94, 163–174, https://doi.org/10.1007/s10533-009-9316-x, 2009.
Chien, S. H., Shearer, G., and Kohl, D. H.: The nitro-gen isotope effect associated with nitrate and nitrite loss from waterlogged soils, Soil Sci. Soc. Am. J., 41, 63– 69, https://doi.org/10.2136/sssaj1977.03615995004100010021x, 1977.
Danielescu, S. and MacQuarrie, K. T. B.: Nitrogen and oxy-gen isotopes in nitrate in the groundwater and surface water discharge from two rural catchments: implications for nitro-gen loading to coastal waters, Biogeochemistry, 115, 111–127, https://doi.org/10.1007/s10533-012-9823-z, 2013.
Deutsch, B., Voss, M., and Fischer, H.: Nitrogen transformation processes in the Elbe River: Distinguishing between assimila-tion and denitrificaassimila-tion by means of stable isotope ratios in ni-trate, Aquat. Sci., 71, 228–237, https://doi.org/10.1007/s00027-009-9147-9, 2009.
Elliott, E. M., Kendall, C., Wankel, S. D., Burns, D. A., Boyer, E. W., Harlin, K., Bain, D. J., and Butler, T. J.: Nitrogen isotopes as indicators of NOx source contributions to
atmo-spheric nitrate deposition across the midwestern and north-eastern United States, Environ. Sci. Technol, 41, 7661–7667, https://doi.org/10.1021/es070898t, 2007.
Enanga, E. M., Creed, I. F., Casson, N. J., and Beall, F. D.: Summer storms trigger soil N2O efflux episodes in forested catchments, J. Geophys. Res.-Biogeo., 121, 95–108, https://doi.org/10.1002/2015JG003027, 2016.
Fry, B.: Stable isotope ecology, Springer, New York, 2006. Galloway, J. N., Dentener, F. J., Capone, D. G., Boyer, E. W.,
Howarth, R. W., Seitzinger, S. P., Asner, G. P., Cleveland, C. C., Green, P. A., Holland, E. A., Karl, D. M., Michaels, A. F., Porter, J. H., Townsend, A. R., and Vörösmarty, C. J.: Nitrogen cycles: past, present, and future, Biogeochemistry, 70, 153–226, https://doi.org/10.1007/s10533-004-0370-0, 2004.
Granger, J. and Wankel, S. D.: Isotopic overprinting of nitrification on denitrification as a ubiquitous and unifying feature of envi-ronmental nitrogen cycling, P. Natl. Acad. Sci. USA, 113, 6391– 6400, https://doi.org/10.1073/pnas.1601383113, 2016.
Harrington, R. R., Kennedy, B. P., Chamberlain, C. P., Blum, J. D., and Folt, C. L.: 15N enrichment in agricultural catchments: field patterns and applications to tracking At-lantic salmon (Salmo salar), Chem. Geol., 147, 281–294, https://doi.org/10.1016/S0009-2541(98)00018-7, 1998. Hübner, H.: Isotope effects of nitrogen in the soil and biosphere, in:
Handbook of Environmental Isotope Geochemistry, edited by: Fritz, P. and Fontes, J. C., The Terrestrial Environment, Elsevier, Amsterdam, 361–425, 1986.
Kaste, Ø., Bechmann, M., and Mørkved, P. T.: Tracing sources of nitrate in agricultural catchments by natural stable isotopes, Nor-wegian Institute for Water Research, Norway, 2006.
W. W. Wong et al.: Nitrate isotopes in streams on a catchment scale 3965
Kendall, C. and Caldwell, E. A.: Fundamentals of isotope geo-chemistry, in: Isotope tracers in catchment hydrology, edited by: Kendall, C. and McDonnell, J. J., Elsevier, Amsterdam, 51–86, 1998.
Kendall, C., Elliott, E. M., and Wankel, S. D.: Tracing anthro-pogenic inputs of nitrogen to ecosystems, in: Stable isotopes in ecology and environmental science, edited by: Michener, R. H. and Lajtha, K., Blackwell Publishing Ltd, Boston, 375–449, 2007.
Mayer, B., Boyer, E. W., Goodale, C., Jaworski, N. A., Van Breemen, N., Howarth, R. W., Seitzinger, S., Billen, G., Lajtha, K., Nadelhoffer, K., Van Dam, D., Hetling, L. J., Nosal, M., and Paustian, K.: Sources of nitrate in rivers draining sixteen watersheds in the northeastern U.S.: Isotopic constraints, Biogeochemistry, 57–58, 171–197, https://doi.org/10.1023/A:1015744002496, 2002.
McIlvin, M. R. and Altabet, M. A.: Chemical conversion of nitrate and nitrite to nitrous oxide for nitrogen and oxygen isotopic anal-ysis in freshwater and seawater, Anal. Chem., 77, 5589–5595, https://doi.org/10.1021/ac050528s, 2005.
Mueller, C., Zink, M., Samaniego, L., Krieg, R., Merz, R., Rode, M., and Knöller, K.: Discharge driven nitrogen dy-namics in a mesoscale river basin as constrained by sta-ble isotope patterns, Environ. Sci. Technol., 17, 9187–9196, https://doi.org/10.1021/acs.est.6b01057, 2016.
Murdiyarso, D., Hergoualc’h, K., and Verchot, L. V.: Op-portunities for reducing greenhouse gas emissions in tropi-cal peatlands, P. Natl. Acad. Sci. USA, 107, 19655–19660, https://doi.org/10.1073/pnas.0911966107, 2010.
Ohte, N.: Tracing sources and pathways of dissolved nitrate in forest and river ecosystems using high-resolution isotopic techniques: a review, Ecol. Res., 28, 749–757, https://doi.org/10.1007/s11284-012-0939-3, 2013.
Panno, S. V., Kelly, W. R., Hackley, K. C., Hwang, H. H., and Martinsek, A. T.: Sources and fate of nitrate in the Illinois River Basin, Illinois, J. Hydrol., 359, 174–188, https://doi.org/10.1016/j.jhydrol.2008.06.027, 2008.
Pardo, L. H., Kendall, C., Pett-Ridge, J., and Chang, C. C. Y.: Eval-uating the source of streamwater nitrate usingδ15N andδ18O in nitrate in two watersheds in New Hampshire, USA, Hydrol. Pro-cess., 18, 2699–2712, https://doi.org/10.1002/hyp.5576, 2004.
Peterson, B. J., Wollheim, W. M., Mulholland, P. J., Webster, J. R., Meyer, J. L., Tank, J. L., Marti, E., Bowden, W. B., Valett, H. M., Hershey, A. E., McDowell, M. H., Dodds, W. K., Hamil-ton, S. K., Gregory, S., and Morrall, D. D.: Control of nitrogen export from watersheds by headwater streams, Science, 292, 86– 90, https://doi.org/10.1126/science.1056874, 2001.
Riha, K. M., Michalski, G., Gallo, E. L., Lohse, K. A., Brooks, P. D., and Meixner, T.: High atmospheric nitrate input and nitrogen turnover in semi-arid urban catchments, Ecosystems, 17, 1309– 1325, https://doi.org/10.1007/s10021-014-9797-x, 2014. Sebilo, M., Billen, G., Grably, M., and Mariotti, A.:
Iso-topic composition of nitrate-nitrogen as a marker of ri-parian and benthic denitrification at the scale of the whole Seine River system, Biogeochemistry, 63, 35–51, https://doi.org/10.1023/A:1023362923881, 2003.
Sigman, D. M., DiFiore, P. J., Hain, M. P., Deutsch, C., Wang, Y., Karl, D. M., Knapp, A. N., Lehmann, M. F., and Pantoja, F.: The dual isotopes of deep nitrate as a constraint on the cycle and bud-get of oceanic fixed nitrogen, Deep Sea Res. Pt. I, 56, 1419–1439, https://doi.org/10.1016/j.dsr.2009.04.007, 2009.
Snider, D. M., Spoelstra, J., Schiff, S. L., and Venkiteswaran, J. J.: Stable oxygen isotope ratios of nitrate produced from ni-trification: (18)O-labeled water incubations of agricultural and temperate forest soils, Environ. Sci. Technol., 44, 5358–5364, https://doi.org/10.1021/es1002567, 2010.
Stein, J. L., Hutchinson, M. F., and Stein, J. A.: A new stream and nested catchment framework for Australia, Hydrol. Earth Syst. Sci., 18, 1917–1933, https://doi.org/10.5194/hess-18-1917-2014, 2014.
Vitousek, P. M., Aber, J., Howarth, R. W., Likens, G. E., Matson, P. A., Schindler, D. W., Schlesinger, W. H., and Tilman, G. D.: Human alteration of the global nitrogen cycle: Causes and conse-quences, Ecol. Appl., 7, 737–750, https://doi.org/10.1890/1051-0761(1997)007[0737:HAOTGN]2.0.CO;2, 1997.
Voss, M., Deutsch, B., Elmgren, R., Humborg, C., Kuuppo, P., Pas-tuszak, M., Rolff, C., and Schulte, U.: Source identification of nitrate by means of isotopic tracers in the Baltic Sea catchments, Biogeosciences, 3, 663–676, https://doi.org/10.5194/bg-3-663-2006, 2006.