Abstract: Software reliability is expressed as the probability of software to function properly under specified condition for a specified time period. A basic method to evaluate the software reliability is to check the presence of defects in the software. The presence of defect can be calculated as defect density measured defined as total number of defects present in the software divided by the size of the software. The paper proposes a fuzzy logic based model to predict per phase software defect density. The model uses 3 relevant software metrics per SDLC phase. Defect density prediction is a useful measure, which indicates the critical modules of the project and helps software teams to plan their resources in an efficient manner. The proposed model results are better in comparison with existing literature in the same domain when compared using MRE performance measure on 20 project dataset.
Index Terms: Defect Prediction, Fuzzy logic, Metrics, Phase-wise, SDLC.
I. INTRODUCTION
Software plays an influential role in our day-to-day activity directly or indirectly. Hence making software reliability a very important crucial as software being used in many diverse areas. It has been observed in past that software failure has incurred loss of not only money but also of human life[1] . This makes study of software reliability an unavoidable and very important area of research. Software reliability is expressed as the probability of software to function properly under specified condition for a specified time period. A basic method to evaluate the software reliability is to check the presence of defects in the software. The presence of defect can be calculated as defect density measured as total number of defects present in the software divided by the size of the software [2]. Software defect density is an important guide in measuring software reliability. Also defect identified in early phase are cheaper to fix in comparison with defect identified in later phases. Prediction of defects during early phases of SDLC helps software professionals to deal with the problem early. In past various models has been proposed that estimate and predict software reliability. However, neither these models successfully predict phase-wise defect density or they are user friendly [3]. As phase wise defect data available is small and a lot of uncertainty is associated with it. Also majority of failure
Revised Manuscript Received on July 09, 2019.
Misha Kakkar, Department of Computer Science and Engineering, Amity University Uttar Pradesh, Noida, India
Dr. Sarika Jain, Amity Institute of Information Technology, Amity University Uttar Pradesh, Noida, India.
Prof. (Dr.) Abhay Bansal, Department of Computer Science and Engineering, Amity University Uttar Pradesh, Noida, India.
Prof. (Dr.) P.S.Grover, KIIT Group of Colleges, Gurgaon, Haryana, India
information is exists in form of expert knowledge, which can further be replicated as software metrics [4]. Due to all these factors software defect prediction model that is based on fuzzy logic is presented here.
The remaining paper is structured as: related work is discussed in Section 2. Proposed method is presented in Section 3. Section 4 and 5 describe the results and conclusion respectively.
II. RELATED WORK
As humans perform software development, thus developing no defect software is a challenging task. It is crucial to develop software that performs its functionality properly under specified condition for a specified time period. Study of software reliability is very important and a major area of research.
In past various models has been proposed that estimate and predict software reliability. Various researchers studying software reliability concluded that software defect density depends on static code metrics [5]-[8]. Agresti and Evanco used process and product characteristics to perform regression analysis to predict software defect [9]. Smidts et al. studied the importance of software requirements and its failure modes as parameters to predict software reliability [10]. UML models such as sequence diagrams, use cases, and deployment diagrams were used to interpret reliability attributes. Cortellessa et al. demonstrated this approach by using a simple online transaction processing system [11]. Many researchers in their research proposed a SDP models based on Bayesian net [12][14]. Further Dejaeger et al. studied 15 different classifiers based on Bayesian net for defect estimation [15]. Pandey and Goyal studied fuzzy profiling of static code metrics to propose SDP model [16]. Yadav et al. considered uncertainty associated with software metrics to proposed SDP model for SDLC phase wise defect prediction [8]
Above literature review concludes that software reliability can be measured as a function of defect present in the software. Also defects can be categorized by using static code metrics.
III. PROPOSED METHODOLOGY Following steps are involved in the proposed model: -
Step 1 – Metric selection
Step 2 – Defining membership function for each of the selected input metric and output metric
Step 3 – Designing FIS Step 4 – Model Evaluation
A. Metric selection There exist loads of SDP models that use traditional
Fuzzy Logic Based Model to Predict Per Phase
Software Defect
software metrics to predict software defects. However, these models have there are many drawbacks. One of the major drawbacks is that they don't predict defect density phase wise. Also, existing studies have concluded that metric selection plays a very important role in defect prediction [18][19]. Thus metric selection is a very import step in SDP model building.
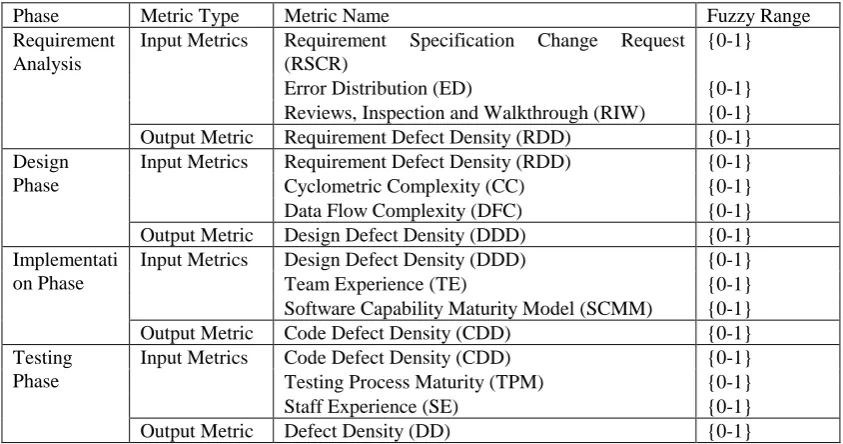
Li and Smidts have studied influence of thirty software metrics on software reliability. They used expert opinion to rank these metrics on their influence on software defect density. The outcome of their study was top three most influential metrics for first four SDLC phases that contributes majorly towards software reliability [20]. Based on their conclusion in the proposed model we have selected three input metrics for each phase along with one output metric. These metrics are shown in table 1.
B. Membership Function
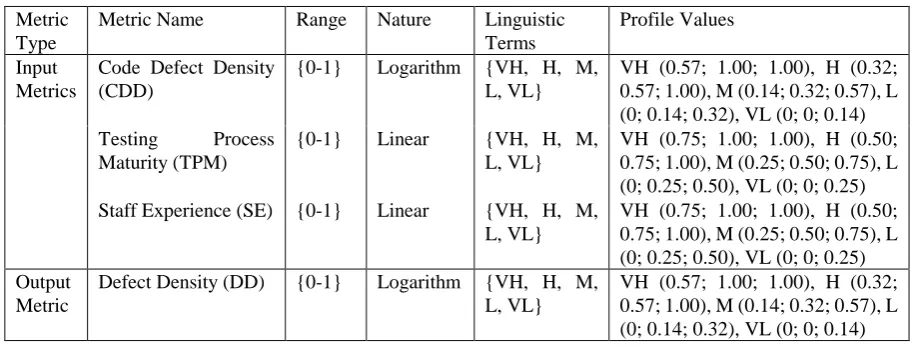
Designing a membership function for each software metrics is very crucial for the development of SDP model. The success of SDP model depends on how input and output metrics are mapped. Membership function can be of different shapes such as triangular, trapezoidal, etc. Various researchers have proposed different membership functions based on expert opinion. In the proposed model, selected metrics profile values are calculated based on method proposed by Pandey and Goyal in 2010 [16]. Table 2 to table 5 depicts the membership function values for this phase. The shape of membership function used is triangular.
C. Figures Designing of Fuzzy Inference System
After designing the membership function for each of the selected metrics, the next step is to construct a fuzzy rule base. The constructed rule base based on domain experience along with the inferences deduced from traditional dataset available in various software repositories.
The proposed model processed the metric data using Mamdani fuzzy inference system (FIS). FIS maps the fuzzy inputs to fuzzy output using fuzzy ‘max-min’ operator. With the help of domain expert ‘if-then’ rule based is prepared. Defuzzification has been performed using centroid method to predict number of defects as the output. Table 7 depicts the number of defects as given by proposed system in comparison with actual defects.
D.Model Evaluation
The proposed model performance is evaluated as number of defect predicted with respect to actual number of defects. Performance measured used for the comparison is Mean Magnitude of Relative Error (MRE). MRE measures absolute error mean and calculated as follows:-
MRE
=
1
n
|
d
i-
dp
i|
d
ii=0
n
å
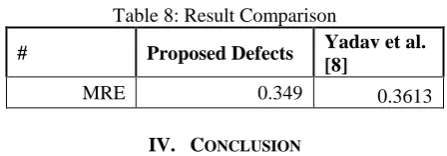
where di is actual defect density and dpi is predicted defect density. The result comparison is shown in Table 7. It can be
[image:2.595.314.538.86.164.2]concluded that the result predicted by proposed method is a little better in comparison with Yadav et al. [8].
Table 8: Result Comparison
# Proposed Defects Yadav et al. [8]
MRE 0.349 0.3613
IV. CONCLUSION
The paper proposes a fuzzy logic base model to predict phase –wise software defect density. The model uses 3 relevant software metrics per SDLC phase. Defect density prediction is a useful measure, which indicates the critical modules of the project and helps software teams to plan their resources in an efficient manner. The proposed model results are better in comparison with existing literature in the same domain when compared using MRE performance measure on 20 project dataset.
REFERENCES
[1] M. Xie and M. R. Lyu, “Handbook of software reliability engineering,” Software Testing, Verification and Reliability, vol. 222, pp. 59–60, 1996.
[2] IEEE. IEEE Standard Glossary of Software Engineering Terminology, Inst. of Electrical and Electronical Engineers, vol. 121990, 1990 [3] K.Y. Cai, C.Y. Wem, M.L. Zhang, “A critical review on software
reliability modeling”, Reliab. Eng. Syst. safety vol. 32, no 3, pp 357-371, 1991
[4]Kaner, C., & Bond, W.P. “Software Engineering Metrics: What Do They Measure and How Do We Know?”, 2004
[5] N. E. Fenton and M. Neil, “A critique of software defect prediction models,” IEEE Transactions on Software Engineering, vol. 25, no. 5, pp. 675–689, 1999.
[6] T. Hall, S. Beecham, D. Bowes, D. Gray, and S. Counsell, “A Systematic Literature Review on Fault Prediction Performance in Software Engineering,” IEEE Transactions on Software Engineering, vol. 38, no. c, pp. 1–31, 2011
[7]Y. Jiang, B. Cukic, T. Menzies, and J. Lin, “Incremental Development of Fault Prediction Models,” International Journal of Software Engineering and Knowledge Engineering, vol. 23, no. 10, pp. 1399–1425, 2013.
[8] H. B. Yadav and D. K. Yadav, “A fuzzy logic based approach for phase-wise software defects prediction using software metrics,” Information and Software Technology, vol. 63, pp. 44–57, 2015. . [9] W. W. Agresti, W. M. Evanco, "Projecting software defects from
analyzing software designs", IEEE Trans. Software Engineering, vol. 18, pp. 988-997, Nov. 1992.
[10] C. Smidts, M. Stutzke, R. W. Stoddard, "Software reliability modeling: An approach to early reliability prediction", IEEE Trans. Reliability, vol. 47, pp. 268-278, Sept. 1998.
.[11] V. Cortellessa, H. Singh, and B. Cukic, “Early reliability assessment of UML based software models,” Proceedings of the third international workshop on Software and performance - WOSP ’02, no. May 2014, p. 302, 2002.
[12] N. Fenton, M. Neil, W. Marsh, P. Hearty, Ł. Radliński, and P. Krause, “On the effectiveness of early life cycle defect prediction with Bayesian nets,” Empirical Software Engineering, vol. 13, no. 5, pp. 499–537, 2008.
[13] Z. A. Rana, M. A. Mian, and S. Shamail, “Improving Recall of software defect prediction models using association mining,” Knowledge-Based Systems, vol. 90, pp. 1–13, 2015.
[14] A. Tosun, A. Bener, B. Turhan, and T. Menzies, “Practical considerations in deploying statistical methods for defect prediction: A case study within the Turkish telecommunications industry,” in Information and Software Technology, 2010, vol. 52, no. 11, pp. 1242–1257.
Using Bayesian Network Classifiers," in IEEE Transactions on
Software Engineering, vol. 39, no. 2, pp. 237-257, Feb. 2013
[16] A. K. Pandey and N. K. Goyal, “Fault Prediction Model by Fuzzy Profile Development of Reliability Relevant Software Metrics,” International Journal of Computer Applications, vol. 11, no. 6, pp. 975–8887, 2010.
[17] G. Abaei, Z. Rezaei and A. Selamat, "Fault prediction by utilizing self-organizing Map and Threshold," 2013 IEEE International
Conference on Control System, Computing and Engineering, Mindeb,
2013, pp. 465-470.
[18] K. Gao, T. M. Khoshgoftaar, H. Wang, and N. Seliya, “Choosing software metrics for defect prediction: An investigation on feature selection techniques,” Software - Practice and Experience, vol. 41, no. 5, pp. 579–606, 2011.
[19] M. Kakkar and S. Jain, “Feature selection in software defect prediction: A comparative study,” in Proceedings of the 2016 6th International Conference - Cloud System and Big Data Engineering, Confluence 2016, 2016
[20] L. Ming and C. S. Smidts, “A ranking of software engineering measures based on expert opinion,” IEEE Transactions on Software Engineering, vol. 29, no. 9, pp. 811–824, 2003.
AUTHORS PROFILE
Misha Kakkar is currently pursuing her PhD degree in
Computer Science Engineering from Amity University. She received her M.E (CSE) degree from Panjab Engineering College, Chandigarh in 2006 and her BTech (CSE) degree from Kurukshetra University, Kurukshetra in 2004. From 2006-2008 she worked in CMC Ltd. (A TATA Enterprise) and 2008-2009 she worked as lecturer in UIET, Panjab University, Chandigarh. Since 2010, she has been working as Assistant Professor with Department of Computer Science and Engineering, Amity University, Noida, India. She has published more than 10 research papers. Her research interests include Software Engineering, Data Mining and Machine Learning. She holds 2 patents to her credit.
Sarika Jain was born in Rohtak, India, in 1977. She received the MSc and M.Phil degrees in mathematics from Maharishi Dayanand University, Rohtak, India, in 2000 and the PhD degree in mathematics from H.N.B. Garhwal University, Srinagar, India, in 2012 From 2001 to 2004, she was a lecturer in JSS Academy, Noida, India. Since 2009, she has been an Assistant Professor with the Information Technology Department, Amity University, Noida, India. She has published more than 15 research papers. Her research interests include image processing, fractal graphics and fixed point theory. She holds eight patents to her credit.
Abhay Bansal is working as Joint Head, Amity School of Engineering & Technology and Amity School of Engnieering, Amity University, Noida, Director, DICET and Head of Department, Computer Science and Engineering. With over 22 years of Industry and Academic Experience, he has regularly contributed more than 60 papers in various International journals/conferences. He is member of FRC and Executive Council of Amity University, Noida, India. He is also guiding 8 students for PhD in the area of Computer Science. Dr. Bansal is Fellow, IET (U.K), Fellow Life Member of ETE, Fellow Member and Chartered Engineer of IE(India), Sr. Member of IEEE(USA), Sr. Member of ACM (USA), Sr. Life Member of CSI, and Life Time Member of ISTE. Dr. Bansal is a Microsoft Certified Professional and Microsoft approved Technical Associate. Dr. Bansal was also member of Executive Committee of IEEE UP SECTION for 2014-15, 2015-16. He has been an active member and Chairman of the program committees of several National and International conference/seminar. He is also reviewer of various National/ International Journals of repute.
P. S. Grover has been Professor, Dean, Director and Head of Computer Science Department, at University of Delhi, Delhi. His areas of research
interest are: Software Engineering, Big Data and Academic Analytics, SW Quality and Metrics, Autonomic Computing, Outcome-based Education and Continuous Improvement. He is a very active researcher and prolific writer. He has published over 150 research papers in international refereed journals/conferences: IEEE, ACM, Journal of Object Technology, Software Engineering, and so on. Dr. Grover has delivered invited talks, chaired sessions at many national/international conferences/workshops. He has been a regular consultant to the software industry (Tata Consultancy Services, IIS Infotech, DCM Technologies, nSYS Design, New Horizon) and other universities in India and abroad (Nepal, Bangladesh, Bhutan). He has been Vice President, Computer Society of India and Chairman – Indian Science Congress (Computer Science and IT). He is life senior member and Fellow of Computer Society of India, Fellow-Institute of electronics and Electrical Engineers, Member-Indian Society of Technical Education, Quality Council of India and IEEE, USA. Presently, he is Campus Director, KIIT Group of Colleges, Maharishi Dayanand University, Sohna Road, Gurgaon, India.
Phase Metric Type Metric Name Fuzzy Range Requirement
Analysis
Input Metrics Requirement Specification Change Request (RSCR)
{0-1}
Error Distribution (ED) {0-1}
Reviews, Inspection and Walkthrough (RIW) {0-1}
Output Metric Requirement Defect Density (RDD) {0-1}
Design Phase
Input Metrics Requirement Defect Density (RDD) {0-1}
Cyclometric Complexity (CC) {0-1}
Data Flow Complexity (DFC) {0-1}
Output Metric Design Defect Density (DDD) {0-1}
Implementati on Phase
Input Metrics Design Defect Density (DDD) {0-1}
Team Experience (TE) {0-1}
Software Capability Maturity Model (SCMM) {0-1}
Output Metric Code Defect Density (CDD) {0-1}
Testing Phase
Input Metrics Code Defect Density (CDD) {0-1}
Testing Process Maturity (TPM) {0-1}
Staff Experience (SE) {0-1}
Output Metric Defect Density (DD) {0-1}
[image:4.595.87.509.61.283.2]
Table 2: Requirement Analysis Phase Fuzzy profile Values
Metric Type
Metric Name Range Nature Linguistic
Terms
Profile Values
Input Metrics
Requirement
Specification Change Request (RSCR)
{0-1} Logarithm {VH, H, M, L, VL}
VH (0.57; 1.00; 1.00), H (0.32; 0.57; 1.00), M (0.14; 0.32; 0.57), L (0; 0.14; 0.32), VL (0; 0; 0.14) Error Distribution
(ED)
{0-1} Logarithm {VH, H, M, L, VL}
VH (0.57; 1.00; 1.00), H (0.32; 0.57; 1.00), M (0.14; 0.32; 0.57), L (0; 0.14; 0.32), VL (0; 0; 0.14) Reviews, Inspection
and Walkthrough (RIW)
{0-1} Linear {VH, H, M,
L, VL}
VH (0.75; 1.00; 1.00), H (0.50; 0.75; 1.00), M (0.25; 0.50; 0.75), L (0; 0.25; 0.50), VL (0; 0; 0.25) Output
Metric
Requirement Defect Density (RDD)
{0-1} Logarithm {VH, H, M, L, VL}
[image:4.595.68.526.328.501.2]VH (0.57; 1.00; 1.00), H (0.32; 0.57; 1.00), M (0.14; 0.32; 0.57), L (0; 0.14; 0.32), VL (0; 0; 0.14)
Table 3: Design Phase Fuzzy profile Values
Metric Type
Metric Name Range Nature Linguistic
Terms
Profile Values
Input Metrics
Requirement Defect Density (RDD)
{0-1} Logarithm {VH, H, M, L, VL}
VH (0.57; 1.00; 1.00), H (0.32; 0.57; 1.00), M (0.14; 0.32; 0.57), L (0; 0.14; 0.32), VL (0; 0; 0.14) Cyclometric
Complexity (CC)
{0-1} Logarithm {H,M,L} H (0.369; 1.00; 1.00), M (0; 0.369; 1.00), L (0; 0; 0.369),
Data Flow
Complexity (DFC)
{0-1} Logarithm {H,M,L} H (0.369; 1.00; 1.00), M (0; 0.369; 1.00), L (0; 0; 0.369),
Output Metric
Design Defect
Density (DDD)
{0-1} Logarithm {VH, H, M, L, VL}
VH (0.57; 1.00; 1.00), H (0.32; 0.57; 1.00), M (0.14; 0.32; 0.57), L (0; 0.14; 0.32), VL (0; 0; 0.14)
[image:4.595.69.528.543.691.2]Metric Type
Metric Name Range Nature Linguistic
Terms
Profile Values
Input Metrics
Design Defect
Density (DDD)
{0-1} Logarithm {VH, H, M, L, VL}
VH (0.57; 1.00; 1.00), H (0.32; 0.57; 1.00), M (0.14; 0.32; 0.57), L (0; 0.14; 0.32), VL (0; 0; 0.14) Team Experience
(TE)
{0-1} Linear {VH, H, M,
L, VL}
VH (0.75; 1.00; 1.00), H (0.50; 0.75; 1.00), M (0.25; 0.50; 0.75), L (0; 0.25; 0.50), VL (0; 0; 0.25) Software Capability
Maturity Model
(SCMM)
{0-1} Linear {VH, H, M,
L, VL}
VH (0.75; 1.00; 1.00), H (0.50; 0.75; 1.00), M (0.25; 0.50; 0.75), L (0; 0.25; 0.50), VL (0; 0; 0.25) Output
Metric
Code Defect Density (CDD)
{0-1} Logarithm {VH, H, M, L, VL}
[image:5.595.69.526.262.435.2]VH (0.57; 1.00; 1.00), H (0.32; 0.57; 1.00), M (0.14; 0.32; 0.57), L (0; 0.14; 0.32), VL (0; 0; 0.14)
Table 5: Testing Phase Fuzzy profile Values
Metric Type
Metric Name Range Nature Linguistic
Terms
Profile Values
Input Metrics
Code Defect Density (CDD)
{0-1} Logarithm {VH, H, M, L, VL}
VH (0.57; 1.00; 1.00), H (0.32; 0.57; 1.00), M (0.14; 0.32; 0.57), L (0; 0.14; 0.32), VL (0; 0; 0.14) Testing Process
Maturity (TPM)
{0-1} Linear {VH, H, M,
L, VL}
VH (0.75; 1.00; 1.00), H (0.50; 0.75; 1.00), M (0.25; 0.50; 0.75), L (0; 0.25; 0.50), VL (0; 0; 0.25) Staff Experience (SE) {0-1} Linear {VH, H, M,
L, VL}
VH (0.75; 1.00; 1.00), H (0.50; 0.75; 1.00), M (0.25; 0.50; 0.75), L (0; 0.25; 0.50), VL (0; 0; 0.25) Output
Metric
Defect Density (DD) {0-1} Logarithm {VH, H, M, L, VL}
VH (0.57; 1.00; 1.00), H (0.32; 0.57; 1.00), M (0.14; 0.32; 0.57), L (0; 0.14; 0.32), VL (0; 0; 0.14)
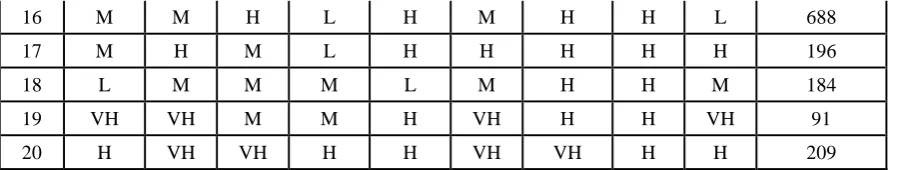
Table 6: Case Study Dataset used in the study
# RSCR RIW ED CC DFC TE SCMM TPM SE Actual
Defect
1 L VH H M H H H H H 148
2 H VH H L H H H H H 31
3 VH VH M L H H H H H 5
4 VL M M VH L VL H H VL 928
5 M VH L L H VH VH H M 204
6 H H L M M H H M M 53
7 VH VH M L VH VH VH H VH 17
8 H H M M H H M M M 29
9 H H H H H H H M H 71
10 L M H M H H H M M 1597
11 L H M H M M M M H 90
12 L M H H H H H M M 129
13 VL H VH H H H H M H 1768
14 M H H L H H M M H 109
16 M M H L H M H H L 688
17 M H M L H H H H H 196
18 L M M M L M H H M 184
19 VH VH M M H VH H H VH 91
[image:6.595.76.525.50.135.2]20 H VH VH H H VH VH H H 209
Table 7: Result Comparison
# Actual Defect Proposed
Defects # Actual Defect
Proposed Defects
1 148 159 11 1768 1905
2 31 35 12 109 136
3 209 231 13 688 981
4 204 211 14 476 501
5 53 76 15 928 1081
6 17 23 16 196 207
7 29 46 17 184 218
8 71 89 18 1597 1702
9 90 104 19 91 117