International Journal of Innovative Technology and Exploring Engineering (IJITEE) ISSN: 2278-3075, Volume-8 Issue-11, September 2019
Road Accident Data Analytics Using Map –
Reduce Concept
R. Joshua Samuel Raj, T.Sudarson Rama Perumal, N.MuthuKumaran,
Abstract — In recent years, the accidents on road have been increasing exponentially on yearly basis because of heavy traffic which has increased great concerns across the world. The enormous growing drift of motorization and the improvisation of the social and economic position of the people have influenced the annoying road safety scenarios with wounded and eternally disabled injuries. This paper has an extensive in-depth study through the accidents and its causes due to the reasons like weather Conditions, Age, Lighting, Vehicle Conditions, Road conditions etc. Data mining algorithms are applied to the provided dataset and factors which cause accidents. Utilization of this paper is to find out the factors which cause accidents and it can be given to the public so that the accidents can be reduced. This paper has established a linkage from the causes to the consequences with event classification of certain cases during the duration2009-2014.
Keywords— road accident, clustering, Data mining, association rule mining, and MapReduce
.
I. INTRODUCTION
A major health concern which is alarmingly increasing is the accident which has an inverse effect on the economy of the countries. Road traffic accidents in particular contribute to the major fatal injuries on the record and ranks at number one in the world and has contributed to 1.29% of total fatal injuries resulting from road accidents. [1][7]Moreover, crashes involve governments in huge costs
both in terms of economic and resources. They are a composite observable fact that implicates the communication of dissimilar elements: road, driver, vehicle and environment. However, roads are a necessary part and an improvement in road essentials would augment in safety roads. Traffic Accidents are happening due to development of automobile industry and the accidents are inevitable even when the traffic rules are strictly maintained. Data mining algorithms are useful to the provided dataset and issues which cause accidents are found. It is aided by obtaining the characteristics of driver’s behavior, road condition and weather condition, Accident severity that are connected with dissimilar injury severities and death. For that, first we are clustering the data’s using k-modes. After that, using association rule mining certain rules are being generated for each clusters. Finally map reduce algorithm is been applied. By doing this we are able to find the factors that causes accidents and it’s given to the public, sothat the people can avoid those conditions.
Revised Manuscript Received on September 03, 2019
R. Joshua Samuel Raj, Professor, Department of Information Science and Engineering, CMR Institute of Technology, Kundalahalli, Bengaluru.
T.Sudarson Rama Perumal, Assistant Professor, Department of CSE, Rajas Engineering College Vadakankullam, Tirunelveli.
N.MuthuKumaran, Professor, Department of ECE, Francis Xavier Engineering College Tirunelveli.
Sensors are integrated with the vehicles to facilitate the detection of accidents. The integrated sensors deliver a nominal amount of data that are exchanged to estimate the severity of the accident by selection of relevant features (type of vehicle, impact speed and status of airbag) by generating estimation models by the use of classification models in Data mining (DM) which are used to predict the severity of new accidents and reduce the assistance time of emergency services by providing recommended resources.
II. MOTIVATION
Fatal and Non fatal injuries arising from Road accidents have a cumbersome effect on people. So to reduce the number of deaths and injuries, we are analyzing the accident data’s and determining under which conditions more number of accidents are been occurred. [2]The goal of the project is to propagate and practice the road safety measures by an in depth study of road accidents. Through the project we can classify the conditions according to the clustering results and according to these results awareness can be given to the public so that road accidents can be limited
III. EXISTING SYSTEMS Road accidents are driven courtesy to
•
Behavior of the driver•
Design of the Roadways•
Maintenance of the Roadways•
Failure of the vehicleThe exact cause of an accident can be identified by the comprehensive data collection.
ROAD ACCIDENT DATA RECOREDER (Radar) [3]Road Accident Data Recorder (RADaR) is a software
IV. PROPOSED SYSTEM
We are provided by a dataset of the road accidents that happened in Coimbatore within a specified timeframe. Next
for this dataset we have done data preprocessing. [5]Data preprocessing has been done for getting the data ready for analysis by removing noise, missing values being handled and various data transformations being applied. Several steps like data cleaning, data transformation, data integration etc are done in data preprocessing.
[8]Next step is clustering and as we have categorical
dataset we use K- modes clustering. Clustering is the procedure of partitioning a group of data points to a tiny quantity of clusters. The given data is then clustered by K-modes method to partition the objects into k groups in such a manner that the objects are at a minimized distance from the assigned clustered modes. An advantage of K-modes algorithm is if variables are huge, then K-Modes most of times is computationally faster than hierarchical clustering, if we keep k small. And to find the number of clusters we are using AIC.
[10]Next association rule mining is being done to generate
certain rules. Association rule mining is a process which is destined to find common patterns, correlations, associations, or fundamental structures from information sets found in a variety of databases like relational databases, transactional databases, and other methods of data repositories. And also this algorithm helps in discovering the rules that may have rule associations and fundamental objects between sets of items.
Next is the map reduce algorithm. Map Reduce runs in the background of Hadoop to provide scalability and easy data-procesisng solutions. In addition Map Reduce provides analytical capabilities for analyzing huge
volumes of
data. It has two tasks namely map and reduce. The
mapper class helps to do the Map task and the
reducer class is a means to do the reducer task.
V. METHODOLOGY
Design methodology refers to the development of a system for a unique situation. Although present day technology is capable of letting the driver know the availability it is not possible to differentiate that of the employee and
guest
user.
Fig.1 Architecture Diagram of Proposed system Whilst design methodology is working in a lot of industries, it is usually applied in technology fields, counting those using the internet, software and information
systems development.[19]Quite a few design methodology approaches have been developed in the knowledge industry. Each was a reply to a dissimilar type of trouble. Some common technology design methodologies include class diagram, activity diagram, and flow chart.
FLOW CHART
International Journal of Innovative Technology and Exploring Engineering (IJITEE) ISSN: 2278-3075, Volume-8 Issue-11, September 2019
A flow chart is a pictorial chart that represents an algorithm, workflow and course, presenting boxes of different kinds which indicate the steps and are linked by arrows which show the order of flow.
[13]Here the flow chart collects all the data and process it
for data preprocessing and after preprocessing the clustering with k-modes algorithm is done and data is applied for associate rule mining is done and already preprocessed is taken data preprocessed to do map reduce clustering. To analyze, design, document or manage the process program in various fields the flowcharts in road data analytics are used.
CLUSTERING
Clustering is grouping a set of matter such that things in the similar group (called a cluster) are similar to eachother.
Clustering is a process of grouping a collection of data
point as a tiny number of clusters. [14]The k-modes algorithm is an extension of the k-means algorithm by Macqueen. K-modes technique clusters the given statistics and divides the objects into k groups in a manner to minimize the distance of the objects to the assigned clusters. .The difference of the two objects is decided by the simple-matching distance by default. The number of mismatches in all variables is counted to facilitate this. Alternatively this distance is also measured or weighed by the incidences of the categories in the facts. Also it is more likely that no object will be close to one or more modes when an initial matrix of modes is given.
K-MEANS CLUSTERING
Clustering is a technique wherein it groups the data objects into clusters such that the objects within a group are similar
when compared to the objects in other groups. [4]K-means algorithm is a candid clustering technique for numerical data wherein it groups into k clusters the different objects. Many potential clustering algorithms are available however the selection of a suitable clustering algorithm depends on the type and the nature of the information.
#K-Means
wss<- (nrow(test)-1) * sum(apply(test, 2 , var))
for (i in 1:15) wss[i] <- sum(kmeans(test, centers=i)$withinss)
plot(1:15, wss, type="b", xlab="Number of Clusters", ylab="Distortion")
The limitation of this approach is the challenge to identify the different groups of accident locations and prioritize a threshold level for different categories. Contrary to this we can use k- means algorithm to partition into dissimilar groups the accident locations. Gap statistic can be used to recognize the number of groups. A major challenge to any clustering algorithm is to recognize the number of clusters that is intended to be completed. The major problems and a flaw in the k=means clustering is that the user is in a position to decide the value of k and this ripples to wrong clustering results when the value of k is decided wrongly.
Fig.3 Number of Clusters K-MODES CLUSTERING
[15]K-modes algorithm is an amicable option and the
fuzziness in the selection of k in the k-modes algorithms can be intimidated by the usage of cluster selection criteria. K modes can handle massive amount of data with good efficiency and is a better option for data with vast number of categorical attributes. The K-modes clustering technique is built above the k-means clustering technique with the major differences in their distance measurement calculation and the clustering process.
Clustering algorithm determines the number of clusters to be formed with the given dataset which is a basic necessity for cluster analysis and to attain this different criteria’s such as Akaike Information Criteria, Bayesian Information Criteria and Consistent Akaike Information criteria. On the reception of the number of clusters to be clustered the k-modes algorithms uses R statistical software to slice the accident data set. On reception of the suitable segmentation of the dataset the subsequent task of characterization of each and every cluster is done meticulously.
ALGORITHMS
1st Step - assign “M” number of modes. (Select initial “m” number of random data points as modes)
2ndStep - Calculate the dissimilarity score between each of the remaining data points from the “M” number of chosen modes.
3rd Step - Associate the data points to the mode whose score is minimum (you will have M number of clusters)
4th Step - Use‘Moving mode frequency based method’ to
update the modes (for each of the m clusters we need to update the modes).
5th Step - Repeat from 2nd step until there is no reassignment of clusters.
AIC TO FIND THE NO OF CLUSTERS sat.n<- nrow(test)
ltakers<- log(test)
lm0 <- lm(Road.Surface~ 1,data=test) summary(lm0)
lm1 <- lm(Road.Surface ~ Sex.of.Casualty,data=test) summary(lm1)
lm2 <- lm(Road.Surface ~ Age.of.Casualty,data=test) //AIC TO FIND THE NO OF CLUSTERS
AIC(lm2)
add1(lm0, Road.Surface~
Age.of.Casualty +
Sex.of.Casualty +
data=test,test="F")
// plot the number of clusters
plot(1:15, wss, type="b", xlab="Number of Clusters", ylab="Distortion", col="red")
CLUSTER ANALYSIS Cluster 1 (C1)
It comprises of 70 % mishaps or accidents happened by 1 or 2 vehicles in unclassified road class in Daylight: with street light. The road surface is Dry, wet or Damp. Casualty includes driver, pedestrian and pillow passenger. There are two or three injuries. Casualty severity is slight and serious and the accidents are happened by cars.
Cluster 2 (C2)
It consists of accidents happened in unclassified and motorway road class in Daylight with and without street light. Most of the accidents happened in dry road surface. There are 50% of two injuries and 50% of one injury. Casualty severity is slight and serious and the accidents are happened by motorcycles andcars
Cluster 3(C3)
It consists of accidents happened in motorway road class with dry and wet road surface. The lighting condition is daylight and the weather condition is fine with and without high winds but in some places the weather condition is raining without high winds. The casualty class includes rider or pedestrian. It includes slight and serious injuries that are happened to two or more casualties.
Cluster 4 (C4)
It comprises of mishaps or accidents happened in motorway and unclassified road class with wet/damp road surface. Some are happened in flood due to weather condition as raining with high winds. The lighting condition is daylight with or without street light. The casualty class includes driver, rider and pillow passenger and even pedestrian with fatal, slight and serious injuries by buses, cars and motorcycle.
Cluster 5 (C5)
It consists of unclassified and motorway road class with snow and frost/ice in the daylight and darkness in snowing weather condition. Casualty class is rider or driver and pillow passenger with fatal and serious severity. The vehicles are motorcycle, cars, and buses.
Cluster 6 (C6)
It consists of motorway and unclassified road class with dry and wet/damp road surface in lighting condition as darkness with and without street light. The weather conditions are fine, raining and sometimes foggy. The casualty class is driver, rider and pillow passenger and the casualty severity is serious and even fatal. Type of vehicles is motorcycle, cars, buses and goods vehicles.
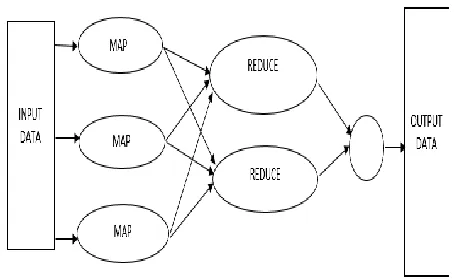
MAPREDUCE
A Map Reduce program is self-possessed of Map () procedure that makes filtering and sorting and a Reduce () method that makes an instantaneous operation. Map Reduce program has its execution in three stages, viz.
the map stage
the shuffle stage
[image:4.596.311.538.48.188.2] the reduce stage
Fig 4. A Map Reduce Map stage:
[24]The maps stage of the MapReduce is to process the
input data. Generally the input data is in the form of a file or directory and is stored in the Hadoop file System. The input file is processed by the mapper function line by line and outputs several chunks of data. In general the user maps an input pair to any number of output pairs.
Reduce stage:
[21]This stage is the resultant of the coordination of the
Shuffle and Reduce stage. The Reducer’s function is to process the data that is output by the mapper and output any number of key values pairs associated with a single key which is deposited in the Hadoop File System.
ASSOCIATION RULE MINING
Apriori algorithm is, the most classical and important algorithm for mining frequent item sets, proposed by R.Agrawal and R.Srikant in 1994 proposed the Apriori algorithm which is a very classical and important algorithm for mining frequent item sets in a given database where its key idea is to make numerous permits through the database which works on an iterative approach commonly known as breadth first search done through the search space.
Confidence:
Confidence is a suggestion of how often the rule has been establish to be true.
Support:
Support is a sign of how regularly the item set seems in the dataset.
Lift:
If the rule had a lift of 1, it would imply that
the probability of event of the predecessor and that of the subsequent are self-determining of each other. When two events are self-regulating of each other, no rule can be drawn including those two events. If the lift is > 1, that lets us know the degree to which those two occurrences are reliant on one another, and makes those rules possibly for expecting the result in future data sets. The value of the lift is that it considers both the self-reliance of the rule and the overall dataset. In association rule mining, provided a fixed item sets, the algorithm finds subsets common to at least a slighter number of the item sets. Apriori algorithm follows a bottom up approach wherein it has a candidate generation and then verifies the groups of candidates against the data.
International Journal of Innovative Technology and Exploring Engineering (IJITEE) ISSN: 2278-3075, Volume-8 Issue-11, September 2019
Item sets it follows breadth first search tree construction. It generates candidate item groups of span m from item sets of length m − 1. Then it prunes the candidates which have an uncommon replace design. According to down ending lemma, the candidate conventional contains all frequent m- length item sets.
APRIORI ALGORITHM PSEUDOCODE
Procedure Apriori (RD, minSupport) {
//RD is the database and minSupport is the least support
F1 = {frequent items};
for (m= 1; Fm!= ∅; m+1)
{
CGm = candidates generated from Fm-1
// that is Cartesian product Fm-1x Fm-1and removing any m-1 size item set
that is not frequent
for each operation RD in database
do{
# increment the count of all applicant sin CGm that are contained in RD
Fm = applicants in CGm with minSupport }//end for each
}//end for Return
Um Fm ;
}
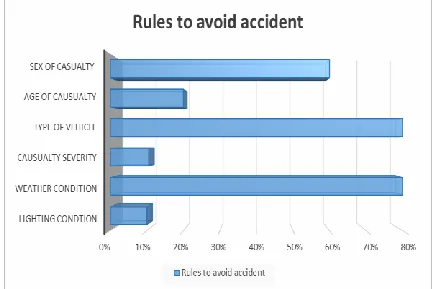
VI. COMPARISON GRAPH
[image:5.596.61.278.576.721.2]It consists of accidents happened in unclassified and motorway road class in Daylight with street light presence. Most of the accidents happened in dry road surface. There are 60% of accidents are happened by the sex of casualty-male and most of the accidents are done by age group of 20 to 30. Mostly Causality severity is slight and serious and the accidents are happened by motorcycles and cars.
Fig 5 Comparison graph of 6 rules
VII. CONCLUSION
Through this project we have come up with the K-modes clustering and association rule mining for examining the accident patterns for altered types of accidents. Six clusters were treasured for the K-modes clustering and the association rule mining has been functional on each cluster to produce the rules that were strong with high lift values and map reduce was done. Inside every cluster there are rules which reveal the accidents associated with the environments and with this the influences that causes accidents are being originate out and given to thepublic.
REFERENCE
1. Fred A., Jain A.K., 2002. Data clustering using evidence accumulation. In:Proc.Frigui, H., Krishnapuram, R., 1999. A robust competitive clustering algorithm with applications in computer vision. IEEETrans.
2. Gantz J F., 2008. The diverse and exploding digital universe. Google Scholar, 2009 (February). Google Scholar
3. Guha et al, 1998. CURE: An efficient clustering algorithm for largedatabases.
4. Guha, Sudipto, Rastogi, Rajeev,
Shim, Kyuseok, 2000. Rock: A robust clustering algorithm for ategoricalattributes.
5. Guha, Sudipto, Meyerson, A., Mishra, Nina, Motwani, Rajeev, O’Callaghan, L., 2003a. Clustering data streams: Theory and practice. Trans. Knowledge DiscoveryEng.
6. Guha, Sudipto, Mishra, Nina, Motwani, Rajeev, 2003b. Clustering data streams. IEEE Trans. Knowledge Data Eng. 15 (3),515–528. 7. Hagen et al., New spectral methods for ratio cut partitioning and
clustering. IEEE Trans. Comput.-Aid. Des. Integrated Circuits Systems 11(9),1074–1085.
8. Han, Jiawei, Kamber, Micheline, 2000.Data Mining: Concepts andTechniques.
9. Hansen, Mark H., Yu, Bin, 2001. Model selection and the principle of minimum description length. J. Amer. Statist. Assoc. 96 (454),746–774.
10. Har-peled, Sariel, Mazumdar, Soham, 2004. Coresets for k-means and k-median clustering and theirapplications.
11. Hartigan, J.A., 1972. Direct clustering of datamatrix
Hartigan, J.A., 1975. Clustering Algorithms. John Wiley andSons. 12. Hofmann, T., Buhmann, J.M., 1997. Pairwise data clustering
bydeterministic annealing. IEEE Trans. Pattern Anal. Machine Intell. 19 (1), 1–14.
13. Hore, Prodip, Hall, Lawrence O., Goldgof, Dmitry B., 2009a. A scalable framework for cluster ensembles. Pattern Recognition 42 (5), 676–688.
14. Hotho, A., Staab, S., Stumme, G., 2003. Ontologies to improve text document clustering. In: Proc. of theICDM.
15. Hu, J., Ray, B.K., Singh, M., 2007. Statistical methods for automated generation of service engagement staffing plans. IBM J. Res. Dev. 51 (3),281–293.
16. Iwayama, M., Tokunaga, T., 1995. Cluster- based text categorization: A comparison of category search strategies. In: Proc. 18th ACM Internat. Conf. on Research and Development in Information Retrieval, pp.273–281.
17. Jain, Anil K., Dubes, Richard C., 1988. Algorithms for Clustering Data. PrenticeHall.
18. Jain, Anil K., Flynn, P., 1996. Image segmentation using clustering. In: Advances in Image Understanding. IEEE Computer Society Press, pp.65–83.
19. Jimmy Lin “MapReduce Is Good Enough?” The control project. IEEE Computer 32(2013).
20. George Karypis, Vipin Kumar, 1995. A fast and high quality multilevel scheme for partitioning irregulargraphs, J. SCI. Computing, Vol. 20. No. 1 pp 39-392.
21. Shadi Ibrahim⋆ _ Hai Jin _ Lu Lu “Handling Partitioning Skew in MapReduce using LEEN” ACM 51 (2008)107–113.
23. Jon M. Kleinberg, “An impossibility theorem for clustering” Advances in Neural Information Processing Systems, NIPS 2002.
AUTHORS PROFILE
Dr. R. Joshua Samuel Raj was born in Tirunelveli, Tamilnadu, India, in 1981. He received his B.E Degree in Computer Science and Engineering, M.E Degree in Computer Science and Engineering and the Ph.D Degree in Information Technology. He is currently working as a Professor in the Department of Information Sciences in CMR Institute of Technology, Kundalahalli, Bengaluru. His major research interests are in the field of Grid Computing, Mobile Adhoc Networking, Multicasting, Intrusion detections systems, Cloud Computing, Optimization techniques, Machine Learning and so on.
Mr.T. Sudarson Rama Perumal was born in
Kanyakumari, TamilNadu, India, in 1986. He received the B.E degree in Electronics and Communication Engineering from Noorul Islam College of Engineering, Anna University, Chennai. He received his M.E. degree in Computer Science and Engineering from Tagore Engineering College, Anna University, Chennai. He is currently working as an Assistant Professor of Computer Science and Engineering department at Rajas College of Engineering, Tirunelveli. His major Research interests areas are Machine Learning ,Deep Learing,Wireless
communication.