Abstract: Diabetic foot complications are a burden to the Indian population which affects both financially and physically. The complications could be prevented if the risk of diabetic foot are detected well in advance before the peripheral nerves are damaged leading to amputation and limb loss. The quantification of severity plays an important role in timely intervention, delivery of appropriate treatment and prevention of amputation. This can be modeled as a classification problem where the risk category is stratified into different levels of severity. This paper is an approach to build such a system, capable of classifying the risk category of diabetic patients for suitable follow-up and care. Decision trees are used for the same with features selected using bio-inspired evolutionary algorithms like Particle Swarm Optimization (PSO), Genetic Algorithm (GA), Cuckoo Search (CS), FireFly (FF), Dragon Fly (DF) and Gravitational Search Algorithm (GSA). The overall accuracy is 77% but it identifies the low risk and high risk cases effectively with 97% and 89% respectively.
Keywords: Diabetic foot risk classification, Decision Tree, Feature Selection, Bio-Inspired algorithms
I. INTRODUCTION
India which is the second in diabetic population in the world as observed by IDF [1] has higher risk of foot amputation. There are lot of complications that could arise due to long term prevalence and poor management of diabetes. The most common are the Diabetic Peripheral Neuropathy (DPN), Diabetic Nephropathy (DN), Diabetic Retinopathy and Peripheral Vascular disease (PVD). The type and severity of complication determines the quality of life of diabetic patients. The worst complication among these is the diabetic foot complication as it affects mobility of the patient and hence his/her confidence and leads to depression. In every 30 seconds, a lower limb is lost somewhere in the world as a consequence of diabetes [2]. Amputation of the lower extremity or part of it is usually preceded by a foot ulcer. A strategy that includes prevention, patient and staff education, multidisciplinary treatment of foot ulcers, and close monitoring can reduce amputation rates by 49–85% [3].
Revised Manuscript Received on December 12, 2019. * Correspondence Author
B G Sudha*, CSE, B.M.S. College of Engineering, Bangalore, India. Email: [email protected]
V Umadevi, CSE, B.M.S. College of Engineering, Bangalore, India. Email: [email protected]
Joshi Manisha Shivaram, Medical Electronics, B.M.S. College of Engineering, Bangalore, India. Email: [email protected]
Mohamed Yacin Sikkandar, College of Applied Medical Sciences, Majmaah University, Kingdom of Saudi Arabia.
Belehalli Pavan, Podiatry, Karnataka Institute of Endocrinology and research, Bangalore, India.
Abdullah Alamoudi, College of Applied Medical Sciences, Majmaah University, Kingdom of Saudi Arabia.
Although the spectrum of foot lesions varies in different regions of the world, the pathways to ulceration are probably identical in most patients. Diabetic foot lesions frequently result from two or more risk factors occurring together. In the majority of patients, diabetic peripheral neuropathy plays a central role: up to 50% of people with type 2 diabetes have neuropathy and at-risk feet. Neuropathy leads to an insensitive and sometimes deformed foot, often with an abnormal walking pattern. In people with neuropathy, minor trauma – caused, for example, by ill-fitting shoes, walking barefoot, or an acute injury – can precipitate a chronic ulcer. Loss of sensation, foot deformities, and limited joint mobility can result in abnormal biomechanical loading of the foot. Thickened skin (callus) forms as a result of this loading. This leads to a further increase of the abnormal loading and, often, subcutaneous hemorrhage. Whatever be the primary cause, the patient continues walking on the insensitive foot, impairing subsequent healing. Peripheral vascular disease, usually in conjunction with minor trauma, may result in a painful, purely ischemic foot ulcer. However, in patients with neuropathy and ischemia (neuro-ischemic ulcer), symptoms may be absent, despite severe peripheral ischemia. The work in [4] shows a manual risk classification scheme based on decision trees.
Many non-healing ulcers are a result of poor or inadequate assessment of foot at-risk. Appropriate risk classification of diabetic foot leads to treatment of the various foot complications at right time and hence better outcome of treatment leading to salvage of foot from amputation. Most of the times, the risk category is not correctly identified leading to poor outcome of treatment. Thus decision trees could serve as an automatic risk classification tool based on various clinical history and parameters. This study explores the use of automatically built decision trees for automatic risk classification of foot and also the type and severity of neuropathy. The use of theme based partitioning of features based on different themes and feature selection based on different bio-inspired evolutionary algorithms is explored.
The main contributions towards this paper are:
1. Clinical data collection and preparation of the dataset suitable for building predictive model using machine learning algorithms.
2. Automation of risk classification of diabetic foot using Decision Tree and validation of the same with clinical classification.
Diabetic Foot Risk Classification using Decision
Tree and Bio-Inspired Evolutionary Algorithms
II. RELATEDWORK
Most of the research concerning diabetic foot follows these two main directions:
Improve the early diagnosis of diabetic foot in hospitals,
Reduce ulcers occurrence and related amputation in diabetic foot.
So a lot of researchers have worked in this direction to determine the risk category of patients. This classification enables the podiatrists to identify people at risk and ensure proper assessment at regular intervals to prevent amputations. Patients come to specialized centers after a foot complication has gone to a state where it cannot be managed by a general physician. This delay increases the rate of amputation. This is attributed to the misclassification/ underestimation of the risk category of the foot. Hence, there should be an automated risk classification system that assesses the foot of patient based on various clinical features, past history and present symptoms. There are different guidelines for the risk classification of diabetic foot. Gustav Jarl [4] identified two such guidelines [5] and [6] based on which they have built two decision trees. Each node represents the level of risk and consists of simple questions. Based on yes/no for each of these questions, the foot is classified into a particular category. This is constructed manually. The IDF has also classified the risk category of diabetic foot and have made it available as a pocket screening card [7] based on different clinical observations and symptoms. But it is too simple to include all conditions. In [8] the authors have built a decision tree based classifier for amputation risk assessment of limb. They observed that the Doppler flow measurements and Wagner based ulcer grading were the most important features that contributed to the classification. They have not considered the clinical foot assessment tests done to evaluate the risk of neuropathy. This article focuses on these tests conducted in the foot care center and the proposed classification system matches with those recommended by the various schemes [7-8].
III. METHODOLOGY
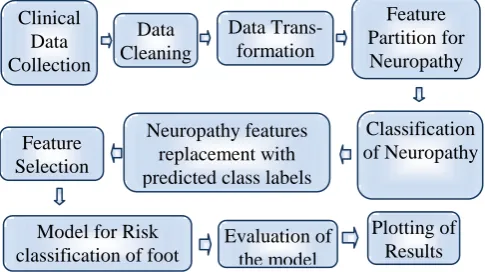
[image:2.595.307.550.55.191.2]An automated system for risk classification of diabetic foot is proposed using machine learning algorithm. The predictive modeling pipeline for the risk classification is shown in Fig 1. But the automated system built should be easy to use, easily understandable and without any ambiguity. It should also be flexible enough to add more features as and when there is a need. It should be a white box which is transparent and clearly explains the decision made. One algorithm that comes as a natural choice which satisfies all these conditions is the decision tree which is easily interpretable and readable. Simple if-then conditions are readily accepted by medical experts as it easily captures the mechanism followed by a medical expert to arrive at the decision. Fig. 1 shows the predictive modeling pipeline for risk classification of diabetic foot.
Fig 1. Predictive modeling pipeline for the risk classification of diabetic foot
It combines all the features mentioned in the guidelines [7-8] that mimics the decision process followed by medical experts. Data Collection
The decision tree for risk classification is learnt and built from the data using CART (Classification and Regression Trees) algorithm. The tree is built and evaluated on the clinical data set consisting of 32 features collected from 112 diabetic patients. All the data was collected at Karnataka Institute of Endocrinology and Research (KIER), Bangalore, Karnataka, India. Written informed consent was taken from all the study participants. The identity and privacy of the participants is protected in all aspects. The study was approved by the Institutional Review Board (IRB) of KIER. Subjects with Diabetes Mellitus type 1 or type 2, with or without existing complications were included in this study. The clinical data consisting of 32 features collected from 112 instances is detailed in Table I below.
Table I. Attributes/Data collected 1.Age
2.Gender,
3.Type of Diabetes 4.Duration of Diabetes 5.HBA1C
6.Numbness 7.Pain 8.Burning 9.Monofilament R 10.Monofilament L 11.Vibration Perception
Test R
12.Vibration Perception Test L
13.Cold Perception Test R 14.Cold Perception Test L 15.Hot Perception Test R 16.Hot Perception Test L
17. Swelling 18. Deformation 19. Skin Discoloration 20. Dry Skin
21. Trauma 22. Heredity 23. Training
24. Training retention 25. Amputation 26. Special Footwear 27. Previous other
Complications 28. Present foot
complications
29. Ankle Brachial Index R 30. Ankle Brachial Index L 31. Peak Pressure R 32. Peak Pressure L
R stands for Right foot and L stands for Left Foot in the above features. The number of classes targeted is 5: Active – Class 4, Very High Risk - Class 3, High Risk - Class 2, Moderate Risk - Class 1 and Low Risk – Class 0 based on the combination of both the schemes in [7, 8].
Classification of Neuropathy Neuropathy features
replacement with predicted class labels
Evaluation of the model Model for Risk
[image:2.595.306.549.433.652.2]Data Preprocessing
Integer encoding is followed for the features Gender, Numbness, Burning, Swelling, Deformation, Skin Discoloration, Trauma, heredity, Foot Care training, Previous Amputation, Special Footwear and Previous other complications. The “present foot complications” feature has different values such as infection, ulcer, callus, corn etc. Hence this is elaborated into different features using one hot encoding. Thus these features are added. Also, these can be present now or it has been in the past. Hence these features are added to the present foot complications feature. Thus when there is a current complication, the present foot complication feature will have a value 1 corresponding to that instance and a 0/1 in the additional feature specific to the complication present. Thus there are 36 features.
Theme Based Partitioning
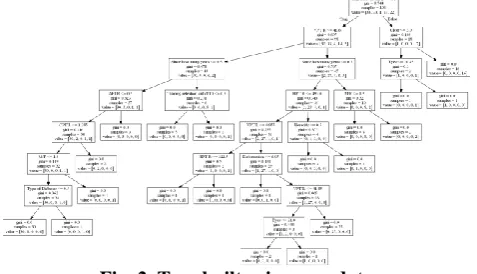
[image:3.595.50.289.535.672.2]A decision tree was built using all the features of the dataset. Two classification decision tree models are considered here. The decision tree (CART) classifier and an ensemble classifier – the Random Forest. Since the dataset is small, over-fitting is a problem. Hence to ensure fair decision making and to improve the accuracy, the dataset is split into train and test data using 5-fold cross validation and leave one out cross validation (LOOCV) techniques. This takes care of the over-fitting problem. The default gini index criteria is used for node splitting. All the algorithms are implemented in python 3 using numpy, pandas and sklearn libraries. Matplotlib and excel is used for plotting the results. The tree built was huge as seen in Fig. 2 with lot of nodes which is very confusing and not easily interpretable by health care professionals. Also the accuracy was only 57% with DT-LOOCV and 55% with RF-CV5. In-fact, to get at this value, not all the features is used. Also, the features contributing to different conditions were spread all over the tree and are mixed up which confuses the decision made. For example, CPT, ABI, PP are seen in the middle sub tree and also CPT which contributes to neuropathy is seen in the right sub tree which contribute to neuropathy. Hence we explored ways for partitioning the tree such that a subset of features represents neuropathy.
Fig. 2. Tree built using raw data
We implemented the theme based partitioning method presented by Shankru [9] with slight modification to suit our requirement. Consider N training data instances with m features, which are denoted by (D) N×m [D1 D2 ... DN], where ith data instance is given by (Di)m×1 [di1, di2, ... dim ]. The theme identified here is Neuropathy and hence we grouped features that contribute to Neuropathy and a partition is created for this theme. Thus there are two subsets or partitions in total. Partition the features of Di into subsets {D
1 i, D
2
i }, where Di ⊇
Dji ; j = 1, 2. Here, the number of themes is 2 and hence the no. of subsets is 2. Note that the number of features in a subset, D j
i, is equal to or greater than 2.
1. Build a local decision tree for the theme (Hj) N×mj ; j = 1 using CART and RandomForest
2. Follow the same for the test data instances. For each test data instance, I: (a) Create a subset, I1, and I2 based on the theme, in the same way as given in Step 1. (b) Classify each subset, Ij, using the local decision tree, Tj, as given by (pj)c×1 = predict(Ij ,Tj ); j = 1
3. For each test instance, compute final class. In the original dataset replace all the features selected for creating the theme Neuropathy by its class prediction.
4. Repeat 4(b) such that the prediction is the class prediction of the entire dataset.
The same is explained below:
11 features with 8 clinical physiological assessment data (Monofilament, Vibration Perception, Hot and Cold Perception test results (two each) for the left and right foot) and 3 features based on 3 symptomatic data such as pain, burning and numbness were identified. Thus the dataset was split into two subsets, one with only these 11 features and the remaining features + 1 feature (the Neuropathy subset class prediction) as another subset. Decision tree was built using these 11 features to classify the instances as Class 0 - No_DPN, Class 1 - Small Fibre Neuropathy, Class 2 - Large Fibre Neuroapthy and Class 3 - Polyneuropathy.
Subset of features selected for partition 1: Numbness, Pain, Burning, MF R, MF L, VPT R, VPT L, CPT R, CPT L, HPT R and HPT L = 11 features.
The decision tree for this subset of features to classify the type of neuropathy was constructed using CART with Leave One out cross validation (LOOCV) and Random Forest with 5 fold cross validation and LOOCV. LOOCV was chosen since this takes care of the class imbalance and also the small size of the data to prevent over-fitting. Also Random forests help in tackling over-fitting by using ensembling approach. The importance of each feature in decision making is shown below in Table for DT-LOOCV, RF-CV5 and RF-LOOCV.
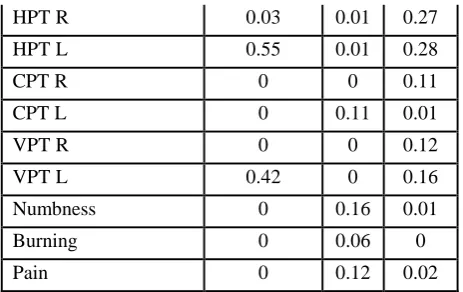
Table II. Feature importances under various models for Neuropathy Classification
Bias, Variance And Class Imbalance
CHARACTE-RISTICS DT-LOOCV
RF-CV5 RF-L OOC V
Accuracy 98.11 91.4
6
91.5
No. of Features for 95% importance
2 6 6
Importance MF R 0 0.27 0
[image:3.595.308.549.589.832.2]HPT R 0.03 0.01 0.27
HPT L 0.55 0.01 0.28
CPT R 0 0 0.11
CPT L 0 0.11 0.01
VPT R 0 0 0.12
VPT L 0.42 0 0.16
Numbness 0 0.16 0.01
Burning 0 0.06 0
Pain 0 0.12 0.02
Clearly from the above table, it can be seen that the accuracy is high in the case of DT-LOOCV and it takes only two features to arrive at a decision. This is an example of high variance. This is due to the fact that only one instance is tested against the rest. Numbness, burning and pain are additional contributing factors but considering only these symptoms with normal clinical diagnostic values, one cannot quantify or classify neuropathy which is the case observed. It may be useful if it is a binary classification. On the other hand, RF-CV5 uses 6 features including symptomatic ones but it is not consistent with the feature importances of DT-LOOCV. Also the accuracy reduces to 91.46%. RF-LOOCV models the data in a similar way as DT-LOOCV but variance is reduced and the feature importances are retained as that of DT-LOOCV. This is because the model takes care of both bias and variance. But accuracy is almost the same as that of it cv5 counterpart. This model would be able to captures all possibilities well in future also. Thus, RF-LOOCV gives a very stable model that can be used for early prediction. Even
though the accuracy is less, this is the model that should be considered as valid as it overcomes over-fitting and under-fitting. Accuracy as an outcome measure will lead to a wrong conclusion as discussed in [10]. This is even more appropriate when there is class imbalance as in our case. The section below shows python code generated for the decision tree built. This function can be embedded in any python code to do the classification. So, once the model is built and corrected for various performances, this code is sufficient to run as part of another big system computer aided diagnostic system. This makes it simple to get the output of a single instance in real time without fitting the model again. def tree(Numbness, Pain, Burning, MF R, MF L, VPT R, VPT L, CPT R, CPT L, HPT R, HPT L):
if HPT L <= 42.25: if VPT L <= 15.5: if HPT R <= 42.5: return [[55. 0. 0. 0.]] else: # if HPT R > 42.5 return [[0. 1. 0. 0.]] else: # if VPT L > 15.5 return [[0. 0. 2. 0.]] else: # if HPT L > 42.25 if VPT L <= 15.5: return [[ 0. 26. 0. 0.]] else: # if VPT L > 15.5 return [[ 0. 0. 0. 21.]]
[image:4.595.53.285.48.194.2]The accuracy of CART is the highest with 98.11%. The wrongly classified instances are shown below:
Table III. Misclassified instances
Numbness Pain Burning MF R MF L VPT R VPT L CPT R CPT L HPT R HPT L Type Pred
0 0 0 1 1 10 10 21.4 21 42.6 40.7 1 0
1 8 0 1 1 16 16 21.1 21.5 41.3 41.7 2 0
These are the border values that are misclassified. Feature values that cause the misclassification are highlighted in bold. In the first case, HPT R > 42.4 which is categorized as mild small fiber neuropathy – Class 1 but still the DT-LOOCV model predicts it as non neuropathic – Class 0. The second case is diagnosed as mild large fibre neuropathy – Class 2 but was wrongly classified as non neuropathic – Class 0. But, since these are only mild cases and as per literature these values are not considered to classify them as neuropathic. This is the beauty of the model. It models real world scenario based on the cases reported in the institute.
The second case is also misclassified as non-neuropathic by RF. But this depends on the test instances selected by the random forest. And the accuracy of Random Forest is always less at all times compared to the DT-LOOCV owing to the small size of the dataset. Since the interest lies in using this output as one of the features for modeling the next level tree, maximum accuracy in the predicted result is desired. The subset of features that contribute to the presence or absence of diabetic peripheral neuropathy as this is considered the most important contributing factor for high risk of amputation along with the presence of other co morbidities. This is like splitting a decision tree into sub-trees that do a particular task
with ease and increased accuracy. Hence in our dataset, the theme identified was that of neuropathy and the contributing features to neuropathy. The decision/ outcome from this subset of features can be fed as a feature for the construction of the next higher level tree. Thus the 11 features are replaced by a single feature. This in-fact reduces the number of features to be considered for final decision making. This subset is
trained on two different target variables, one being the type of neuropathy and the other being the severity of neuropathy.
Thus in the final dataset after partitioning, there are 36 – 11 + 1= 26 features. The decision trees CART-LOOCV and Random forest with LOOCV were employed to see the accuracy. But much to our dismay, the accuracy further reduced to 39.62 and 43.35%. Precision and recall values are also 0.41 and 0.44 respectively. Hence features had to be selected based on the importance and relevance to the classification. There are two options here. Either ask the expert – the podiatrist in our case or do it automatically using evolutionary algorithms. The authors podiatrist suggested removing heredity, foot care training, special footwear and complication of eyes from this set as these were not contributing to either neuropathy or to any foot complication. So there are total of 22 features.
Feature Selection using Evolutionary Algorithms
[image:5.595.307.547.49.225.2]Automation of feature selection was done using different evolutionary algorithms shown in [13, 14] such as Particle Swarm Optimization (PSO), Genetic Algorithm (GA), Cuckoo Search (CS), FireFly (FF), Dragon Fly (DF) and Gravitational Search Algorithm (GSA). Since every algorithm gives a different set of features in each run, the features are selected by running each algorithm for seven times and the features with mode>3 are selected under each algorithm. Here the classifier accuracy or more precisely, the misclassification rate was used as the fitness function. Thus is thus a minimization function. The number of features selected in each run of the algorithm is shown in Fig 3.
Fig 3. No. of features selected by various evolutionary algorithms
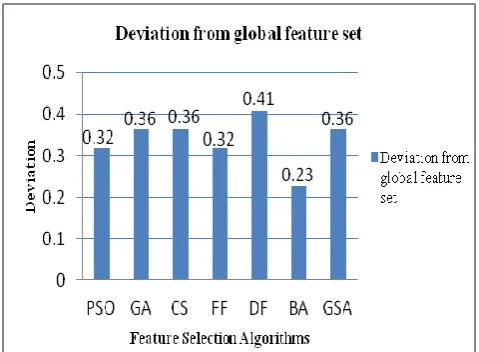
From Fig.3 it can be seen that the Genetic Algorithm and Bat Algorithm gave consistent results considering the number of features selected each time. To select the final set of features based on these algorithms, the count of the number of each features under all algorithms is computed and the features which are consistently selected is found by taking mode>20. Thus the total no. of features selected was 12. They are Type of Diabetes, Duration of Diabetes, Deformation, Skin Discoloration, Trauma, Previous Foot Complication, Current Infection, Ulcer, Kidney, Dry skin, Neuropathy and ABI. The deviation of the features selected by each feature selection algorithm against the final set of features is shown in Fig. 4.
Fig. 4. Deviation of features selected from final set of features
[image:5.595.55.283.393.519.2]The features selected by PSO, Firefly algorithm and Bat Algorithm shows minimal deviation and hence are consistent with the final set of features. The model is evaluated for the different set of features using One Vs Rest Classifier using Random Forest with 5 fold cross validation. This classifier gives better results compared to the traditional multiclass classifiers. Accuracy of the model based on different FS algorithms is shown in Fig 4. The model built on features selected by Firefly algorithm gives the highest accuracy followed by PSO. The standard deviation of the features selected by each algorithm from the global set of features selected is shown in Fig 5. Seven evolutionary algorithms are run seven times and the mode > 3 is used for selecting the features under each algorithm. Finally, the features that have mode >2 by summing up all the features from each algorithm is selected. Thus there are 12 features.
Fig. 5. Accuracy of the classification model using features from different evolutionary algorithms
IV. RESULTSANDDISCUSSION
[image:5.595.306.548.465.612.2]Fig 6. ROC curves of the classifier for all classes (a) 22 features (b) 12 features.
The features selected by podiatrist and also based on the schemes in [8, 9] is 10. Finally, Deformation, Amputation, Previous Foot Complication, Current Infection, Ulcer, Callus, Kidney, Heart, Neuropathy and ABI were identified as the main contributors to the risk classification in accordance with the risk classification schemes. Note that ABI L and ABI R were replaced with a single feature – ABI which takes a value 1 if either of the foot has abnormal ABI. Hence instead of all the features, features that had less importance in the decision tree building were removed. Age, gender (M/F), HbA1c, Skin Discoloration, Dry skin, Type of Diabetes, swelling, Duration of Diabetes, Peak Pressures, trauma were found to be of less importance and also not in accordance with the features used for risk classification schemes. So finally there are 22-11-1 =10 features. The ROC curves of the classifier considering these features is shown in Fig 7. It can be seen that there is a significant improvement in accuracy of all the classes. But still the performance of the features selected by the system is in comparison to the expert.
Fig.7 (a) ROC of the classifier using features selected by podiatrist (b) Feature Importances of features by
RF_LOOCV using the features from EA
Fig 7. (b) Feature importances
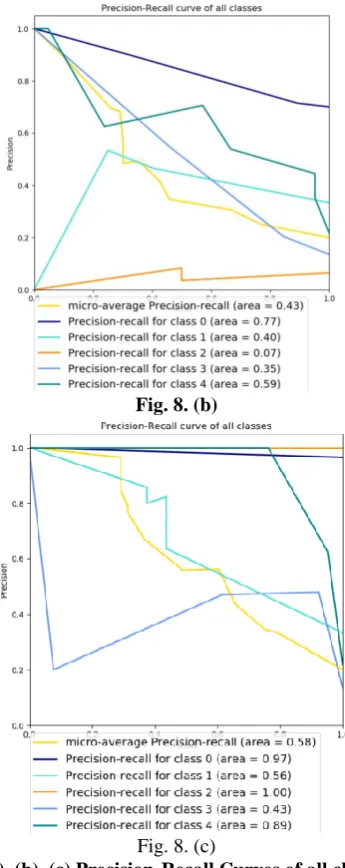
From Fig 7(b) it can be seen that the feature importances match the feature importances by a podiatrist which shows that the classifier models the data appropriately and precisely as done by a podiatrist in accordance with the schemes in [7,8]. The precision-recall curves of the classification with 22 features, 12 features and 10 features are shown in Fig. 8(a), 8(b) and 8(c).
[image:6.595.349.503.51.205.2] [image:6.595.319.532.187.457.2] [image:6.595.325.550.552.838.2]Fig. 8. (b)
Fig. 8. (c)
Fig. 8(a), (b), (c) Precision-Recall Curves of all classes for 22, 12 and 10 features respectively
The precision-recall curves show that the average precision for all classes increases with the features selected by the evolutionary algorithms and further with the features selected by podiatrist. The features are good in detecting low risk, high risk and active cases. Even though the model is not effective in detecting medium risk and very high risk, it detects low risk and high risk cases effectively which is important to identify cases well in advance before it progresses to very high risk category.
V. CONCLUSION
The study in [11] shows that small fiber neuropathy is reversible and hence should be given at most importance in the prevention of DFU. So, this study shows how to detect the presence of Small fibre neuropathy using decision tree. Also, theme based partitioning captures the themes in set of features and was explored to detect the category of neuropathy. Feature selection was done using Binary PSO, Genetic algorithm, Cuckoo Search, FireFly, Dragon Fly, Bat and Gravitational Search algorithms. It was found that the PSO, Firefly and Bat algorithms gave consistent results and better accuracy. Thus feature set reduction increases the accuracy of classification. The classifiers OneVsRest and Random Forest
with Leave One Out Cross Validation gave better accuracy. The ROC curves and precision-recall curves shows that the features selected by the evolutionary algorithms is in comparison with the features selected by podiatrist. The final feature importances mimic the real world situation of importance given to various attributes contributing to the final classification as in the two schemes.
ACKNOWLEDGMENT
This work is supported by the Technical Education Quality Improvement Programme (TEQIP – III) of the MHRD, India and B.M.S. College of Engineering by providing facilities for conducting the research.
REFERENCES
1. Singh N, Armstrong DG, Lipsky BA. Preventing foot ulcers in patients with diabetes. JAMA 2005 Jan;293(2):217-228.
2. Apelqvist, J.; Bakker, K.; van Houtum ,W. H.; Schaper, N. C. Practical guidelines on the management and prevention of the diabetic foot. Diabetes/metabolism research and reviews. Diabetes Metab Res Rev 2008; 24 (Suppl 1): S181–S187.
3. Bakker, K.; Apelqvist, J.; Schaper, N.C. Practical guidelines on the management and prevention of the diabetic foot 2011. International Working Group
4. Jarl, Gustav, and Gustav Jarl is Prosthetist. "Decision trees for risk stratification of the diabetic foot." The Diabetic Foot Journal 21.4 (2018): 218-23.
5. Stang, D., and G. P. Leese. "The Scottish diabetes foot action group 2016 update of the diabetic foot risk stratification and triage system." The Diabetic Foot Journal 19.4 (2016): 182-6.
6. National Institute for Health and Care Excellence (NICE) guidelines. Diabetic foot problems: prevention and management (NG 19). Published 25th August 2015. Available:
https://www.nice.org.uk/guidance/ng19/resources/diabetic-foot-proble ms-prevention-and-management-pdf-1837279828933
7. International Diabetes Federation E-library. Diabetic foot screening pocket chart. Available:
https://www.idf.org/e-library/guidelines/124-diabetic-foot-screening-p ocket-chart.html
8. Kasbekar Prasad Umesh, Goel Pranay, Jadhav Shailaja Prakash, “A Decision Tree Analysis of Diabetic Foot Amputation Risk in Indian Patients”, Frontiers in Endocrinology Vol. 8, (2017) (25) DOI=10.3389/fendo.2017.00025, ISSN=1664-2392
9. Guggari S., Kadappa V., Umadevi V. (2019) Theme-Based Partitioning Approach to Decision Tree: An Extended Experimental Analysis. In: Sridhar V., Padma M., Rao K. (eds) Emerging Research in Electronics, Computer Science and Technology. Lecture Notes in Electrical Engineering, vol 545. Springer, Singapore
10. CrossValidated Discussion Forum, Author: Stephan Kolassa. Available: https://stats.stackexchange.com/questions/368949/example-when-usin g-accuracy-as-an-outcome-measure-will-lead-to-a-wrong-conclusio/36 8979#368979
11. Boyko, Edward J., Amber D. Seelig, and Jessie H. Ahroni. "Limb-and person-level risk factors for lower-limb amputation in the Prospective Seattle Diabetic Foot Study." Diabetes Care41, no. 4 (2018): 891-898. 12. Malik, R. A., A. Veves, S. Tesfaye, G. Smith, N. Cameron, D.
Zochodne, G. Lauria, and Toronto Consensus Panel on Diabetic Neuropathy. "Small fibre neuropathy: role in the diagnosis of diabetic sensorimotor polyneuropathy." Diabetes/metabolism research and reviews 27, no. 7 (2011): 678-684.
13. Brezočnik, Lucija, Iztok Fister, and Vili Podgorelec. "Swarm intelligence algorithms for feature selection: a review." Applied Sciences 8, no. 9 (2018): 1521.
[image:7.595.80.253.52.487.2]AUTHORSPROFILE
B G Sudha is a PhD Research Scholar in the Department of Computer Science and Engineering, B.M.S. College of Engineering. Her research work is funded partially by Amoudi Scientific Research foundation of Majmaah University, Kingdoem of Saudi Arabia. She has published her work in International conferences and authored a Book Chapter in “Machine Learning in Bio Signal Analysis and Diagnostic Imaging” , published by Elsevier Academic Press. Her research is on machine learning and infrared thermography for Diabetic Foot Complications assessment. Her research interests are data science, artificial intelligence, machine learning and deep learning for computer vision based problems.
Dr. Umadevi V, obtained her Ph.D from IIT Madras and currently working as Associate Professor and Head for Computer science and engineering Department at B.M.S. College of Engineering, Bengaluru. She has published her work in many reputed international conferences and also published many articles in leading journals with well known publishers (Elsevier etc.,). She served as resource person for many Workshops and Faculty development programs. Recently she got international grants from Amoudi Scientific Research Foundation of Majmaah University, Kingdom of Saudi Arabia to conduct research in the area of Medical Thermography.
Dr Joshi Manisha Shivaram is working as a Professor in the Dept. Of Medical Electronics, B.M.S.College of Engineering, Bangalore. Her research interest includes, development of wearables in healthcare, development of algorithms in medical image processing and machine learning. She has Published 16 technical papers in peer reviewed journals and a Book Chapter in a book titled “Machine Learning in Bio Signal Analysis and Diagnostic Imaging” , published by Elsevier Academic Press. She has worked on 7 funded research projects and filed 3 patents. She has been awarded Karnataka State Innovation Council Award ‘Amulya 2012 ‘ for innovation in Healthcare. She has won SAP (Startup Accelerator Program) Top performer award by IIT-Bombay (IITB) in faculty development program on‘Use of ICT in Education for Online and Blended Learning’ October 2016.
Dr. Mohamed Yacin Sikkandar had completed his Bachelor's in Instrumentation and Control Engineering from Madurai Kamaraj University, Master's and PhD in Biomedical Engineering at Indian Institute of technology Madras in the year 2003 and 2011 respectively. He is presently working in the Department of Medical Equipment Technology, CAMS, Majmaah University, Saudi Arabia. He has 20 years of professional experience. He is a Senior Member of IEEE and EMBS and very active members in professional bodies such as ASME, IE (India) and ISAM. His research interests are developing computerized signal and image analysis and feature extraction tools to facilitate synergistic and correlative analysis of human pathological conditions for early diagnosis. He is also a Chartered Engineer (India).
Dr Belehalli Pavan is a podiatric Ankle and Foot surgeon at Karnataka Institute of Endocrinology & Research (KIER), Bangalore. He is also an assistant professor in the Department of Podiatry at KIER. He served Past Secretary of Research Society for the Study of Diabetes in India – Karnataka, Chapter (KRSSDI). He is holding the post of Treasurer of Indian Podiatry Association – Karnataka Chapter. He is the NABH auditor for ethical committees and hospitals. He received many awards for best paper presentations in the past at state and national levels. Interested in Diabetic foot, Deformity corrections for lower limbs, Paediatric
Orthopaedics and Clinical Research.