The phytotoxic effects and biodegradability of stored rapeseed oil and rapeseed oil methyl ester
12
0
0
Full text
(2) AGRICULTURAL AND FOOD SCIENCE Vauhkonen, V. et al. The phytotoxicity and biodegradation of RSO and RME. Introduction The use of diesel-like renewable fuels is increasing due to the decisions made by the European Union. The amount of renewable fuel used by the end of 2010 should have reached 5.75% of all transportation fuel used. The next goals are 10% by the year 2020 and 25% by the year 2030. These goals have been set to decrease the total CO2 emissions produced by vehicles. These goals mean that the use of renewable fuels will also increase in agriculture. Agriculture will continue to use mainly diesel-like fuels in the near future. The renewable fuels used in agricultural diesel engines are at the moment vegetable oils, certain animal fats and biodiesels. This study focuses on two main renewable fuel types used in Finnish agriculture; rapeseed oil and rapeseed oil methyl ester. Esters produced from various vegetable oils and animal fats are commonly known as biodiesel (Demirbas and Karslioglu 2007). Biodiesel and vegetable oils are the only liquid transportation fuels that it is possible to produce on a farm scale. The production of other transportation fuels such as ethanol, pyrolysis oil and renewable diesel (Knothe 2009) need much larger facilities and more complex methods. The use of neat oils and fats means that the diesel engine is run with a fuel that it hasn’t been designed to use. The vegetable oils and fats have a greater viscosity which can cause problems when using the engine. The transesterification process is done to improve the physical properties of the fuel to make them similar to those of crude oil based diesel fuel (Demirbas 2008). This process also changes the characteristics of the fuel with the result that the produced fuel can actually weaken the fuel lines and gaskets of the engine. These characteristics increase the risk of engine failure and the probability of a fuel leakage and therefore contamination of the soil or water systems. The fatty acid compositions are still similar and therefore the biodegradation rate and intermediate non-volatile biodegradation product levels are close despite the chemical alteration (Lapinskiené & Martinkus 2007).. This means that the effects on the ecosystems must be studied thoroughly so that in cases of fuel spillages adequate responses can be taken. The renewable liquid fuels (biodiesel and bio-oils) are said to be biodegradable (Sendzikiene et al. 2007) but nevertheless these still have an impact on the ecosystem (plant growth etc.) if an oil or fuel spill happens (Lauhanen et al. 2000, Lapinskiene et al. 2006, Peterson and Möller 2004, Gong et al. 2008). Biodiesel is reported to biodegrade more rapidly and to be less toxic than normal crude oil based diesel fuels (Lapinskiené et al. 2006, Mariano et al. 2008, Zhang et al. 1998). In those reported tests the biodiesel has filled the EN 14214 standard. Also the biodegradation rate of vegetable oils is faster in comparison to mineral based oils (Aluyor et al. 2009, Kuokkanen et al. 2004). It has been shown that both mineral and bio-oil contamination in forests have a negative effect on wood growth; when the foliage has been contaminated (Lauhanen et al. 2000). Vegetable oil processing residues such as olive processing waste is also found to act as an herbicide to certain types of weeds (Boz et al. 2010). In this work we used rapeseed oil and rapeseed methyl ester that were stored in storage tanks for over a year. Both of these were still usable in fuel production and as a fuel for tractors and combine harvesters. The RSO and RME studied didn’t have any detectable properties which would have led us to believe that they had gone rancid (appearance, smell, viscosity). However, the storage life for vegetable oils and biodiesels is limited: because they all contain fatty acids that tend to oxidize (Vauhkonen et al. 2009). As a result of oxidation the chemical and physical properties, such as: acid value, viscosity and peroxide value start to change (Knothe 2007, Thompson et al. 1996). Oxidation also causes formation of formic acid and other organic acids (e.g. acetic acid) in the oils and biodiesels. This means that the toxicity of these substances changes when compared to fresh oil and biodiesel. These oxidation products might therefore change the biodegradation rates of these studied substances. The main aims of the current study were to determine 1) the phytotoxicity of RSO and RME. 132.
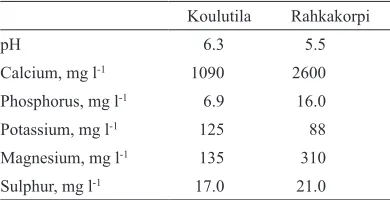
(3) AGRICULTURAL AND FOOD SCIENCE Vol. 20(2011): 131–142. on barley growth when typical fuel-leakage type contamination takes place, 2) the biodegradability of stored RSO and RME in OECD 301F conditions and in ground water.. Table 1. Results of the soil analyses from the year 2007. Koulutila pH Calcium, mg l. 1090. 2600. 6.9. 16.0. Potassium, mg l. 125. 88. Magnesium, mg l. 135. 310. Sulphur, mg l-1. 17.0. 21.0. -1. The RSO used in this study was cold pressed in Ilmajoki at Seinäjoki University of Applied Sciences, School of Agriculture and Forestry, using a screw press. The rapeseeds were harvested in the autumn of 2006 and the oil was pressed in the summer of 2007. The rapeseed oil was therefore two years old at the beginning of these experiments in 2009. The RME used in this study was taken directly from its storage tank at the school of agriculture and forestry in Ilmajoki and was being used as a fuel for tractors during the spring and summer of 2009. Rapeseed oil methyl ester was produced using a commercial biodiesel processor manufactured by Preseco Ltd, Espoo, Finland. The processor uses a transesterification process where the oil is allowed to react with an alkali based catalyst and methanol to remove glycerol from the fatty acid chains. The fuel properties of RSO and RME were measured at the Biofuel Laboratory of Vaasa Energy Institute and at the Department of Chemistry, University of Oulu. These measurements were made to evaluate the quality of the liquids used in this study.. Test sites and experimental design Two different test sites were chosen for this study. The test sites were cultivated with two different barley (Hordeum vulgare) cultivars during the summer of 2009. The “Koulutila” test site (62°43’N 22°31’E) was cultivated using spring barley cultivar Saana (two-rowed) and the “Rahkakorpi” test site (62°45’N 22°39’E) with Vilde (multi-rowed), also a spring barley cultivar.. 133. 5.5. Phosphorus, mg l-1. -1. -1. Material and methods. Rahkakorpi. 6.3. The Koulutila soil was classified as very fine sand and Rahkakorpi as mould when the nutrient analyses of these test fields were carried out in the year 2007. The pH value and nutrient contents of the soils at the test sites are presented in Table 1. The amounts of minerals, besides potassium, were higher in the Rahkakorpi soil than in the Koulutila soil. Both of these sites were cultivated in 2008 and therefore the nutrient levels in these soils had changed from those determined in 2007.. Cultivation of test fields The field where the Koulutila test site was located was harrowed using a disk harrow at the end of May 2009. Sowing was made two days after the harrowing. The field had been fertilized with dry manure in the autumn of 2008 (10 tonnes ha-1) and again in the spring of 2009 (18 tonnes ha-1). The last fertilization was done during sowing using 40.5 kg N ha-1 (Suomensalpietari, N-P-K: 27-0-1, Yara International ASA). The total fertilization of the test field was 79 kg N ha-1. The Rahkakorpi test site was rotary harrowed in May 2009 and was fertilized with 60 kg N ha-1 (YaraMila Pellon Y1, N-P-K: 26-2-3, Yara International ASA) at the same time as the sowing of the field took place. Pesticide treatment was made for both test sites using K-MCPA (active substance: MCPA, 1.00 l ha-1, BASF, Ludwigshafen, Germany) and Express 50T (active substance: Tribenuronmetyl, 7.50 g ha-1, E. I. du Pont Nemours & Co, (Inc.), USA) at the end of June..
(4) AGRICULTURAL AND FOOD SCIENCE Vauhkonen, V. et al. The phytotoxicity and biodegradation of RSO and RME The total yields from the Koulutila and Rahkakorpi test fields were 2800 kg ha-1 and 3350 kg ha-1, respectively.. site. The difference in the rainfalls according to the measurement data can be explained by harder local rainfall at Koulutila test site on 3 to 4 days during the total growing season.. Founding the test sites The test matrices were established 3 weeks after cultivation. The barley sprouts were approximately 10–15 centimeters long and the overall growth had been normal up to that point. At both of the test sites the test matrices had 15 test plots (50 cm × 50 cm). The test matrices had three reference plots with zero contamination and three plots for each of the two contamination levels: 0.5 and 2.0 l m-2 for both contamination substances RSO and RME. The test plots for the different contamination levels were chosen at random within the matrix. The RSO and RME were poured on the barley sprouts. This method was chosen to resemble an oil or fuel leakage from a tractor or combine harvester. However, the spreading of the contaminants was still made as evenly as possible on the test plots. After the spreading there was a distinct film of RSO and RME on the leaves that had been in direct contact with the substances used. Most of the contaminants settled on the soil surface under the barley sprouts. At the Koulutila test site both of the contaminants left a puddle on the surface of the soil. At the Rahkakorpi test site both of the contaminants were absorbed into the soil.. Climate conditions during the study The climatic condition (temperature and rainfall) was followed at two different locations (Saari’s Weather Station at Jouppila, Seinäjoki and at the School of Agriculture and Forestry) that were close to the test sites Rahkakorpi and Koulutila, respectively. The effective heat sum was 1090 °C during the growing season (109 days) for the test matrices. The total rainfall during this time was 110.8 mm at Jouppila weather station and 175 mm at the Koulutila test. Phytomass measurements The influence of the contaminants with different contamination levels at different test sites were determined by measuring the total phytomass growth of the test plots. In these tests the measured values were total wet mass, dry mass and the weight of 1000 kernels that were harvested from each test plot. The effect of the contaminants was also determined using visual inspection (for withering). The barley crop from the tests plots were harvested and collected into sheaves at the start of September 2009. The weight of the sheaves (total wet mass) from the test plots was measured. The crop was then dried using a cold air dryer for a period of 3 weeks. After the sheaves were dried the dry masses of the sheaves were measured and the kernels were separated from the straw by hand and stored in air tight containers. The harvested kernels were weighed at the Biofuel Laboratory of Vaasa Energy Institute in Vaasa. To determine the weight of 1000 kernels 50 kernels were counted from each test plot and weighed. After each measurement the kernels were mixed back into the kernels harvested from the same test plot. These measurements were repeated three times for each batch of kernels harvested from the test plots. The official measurement for the mass of 1000 kernels should be made by weighing a mass of 500 kernels. This was impossible to do due to the small test plots and therefore small kernel yield. The moisture contents of the kernels were determined using the ISO 712 oven method (ISO 712).. Statistical analysis Statistical analyses were performed by using the IBM SPSS Statistics 18.0 statistical software. The. 134.
(5) Corg + O2(g) → CO2(g). 179. A G R I C U L180T U R A L A N D COF(g)O+ 2NaOH(s) O D S→CNaI CO E N(s) C+ HEO(l) 2. 2. 3. 2. (1) (2). 181 182 179. When oxygen isCconsumed the gas phase the pressure falls and at the same time carbon Vol. 20(2011): 131–142. → CO (1) org + O2(g) from 2(g). 183 but2(g) in this method the is absorbed onto solid sodium hydroxide 180 dioxide gas is produced;CO + 2NaOH(s) → carbon Na2COdioxide (2) 3(s) + H2O(l) 184 181 pellets and therefore it does not affect the measured pressure, Equation (2). The measurement time of measurement fully automated and for measureinfluence of the contamination level on growth was 179 (1) Corg + O2(g) → COis2(g) 185 was oxygen used inis consumed our biodegradation tests. Thethemeasurement automated for 182 28 daysWhen from the gas phase pressure falls isandfully at the same timeand carbon conducted by using one-way ANOVA for both conments in solutions instrument calculates the CO2(g) + 2NaOH(s) → Nathe 180 + H2O(l) (2) 2CO3(s) -1 measurements in solutions the instrument calculates the BOD value in the unit [mg L 186 ] using Equation 183 dioxide gas is produced; but in this method the carbon dioxide-1is absorbed onto solid sodium hydroxide taminants RSO and RME separately. BOD value in the unit [mg L ] using Equation (3) 181The influence 187 184 (3) pellets and therefore it does not affect the measured pressure, Equation (2). The measurement time of of the test site and contamination level was analyzed 182 When oxygen is consumed from the gas phase the pressure falls and at the same time carbon 188 185 28 days was used in our biodegradation tests. The measurement is fully automated and for by using 2-way ANOVA where the183 contamination dioxide gas is produced; but in this method the carbon �� dioxide is absorbed onto solid sodium hydroxide ���� � ��� � ��� -1 �� � calculates measurements in solutions the instrument the��� BOD value unit [mg 186 ] using Equation 189 �������� � �pressure, � in �the � ���� � L(3) (3) � level and the test site were used as factors. Thisandwas 184 pellets therefore it does not affect the measured Equation time of �� ��� �� (2). The�measurement 187 (3) done for both contaminants separately. The effect 185 190 28 days was used in our biodegradation tests. The measurement is fully automated and for 188 -1 of the contamination level on the 186 weight of M 1000 where M (O2of) calculates is the (32000 molecular of[mg oxygen measurements the instrument the BOD in Rtheis unit L-1] using Equation where (O2)inis solutions 191 the molecular weight oxygen mgvalue molweight ), a gas constant (83.144 l hPa ��� -1 ���� � ����� ��� � �� −1 −1 (32000 mg mol kernels was also conducted using one-way ANOVA. ), R is a gas constant (83.144 � � (K), T0� is� 273.15 K,�Vtot is�the 189 (3) �������� � ���� � l hPa(ml), Vl(3) 187 mol K ), Tm is the measuring 192 temperature bottle� volume is the ���. ��. ��. The effect of the test place wasn’t evaluated due mol−1 K−1), T is the measuring temperature (K), T0 difference 188 193 190 liquid phase volume (ml), α is a Bunsenm absorption coefficient (0.03103) and Δp (O2) is the to the fact that the test sites had different types of is 273.15 Vtotby��� isWTW. the bottle volume (ml), Vl isof the ����� �� �� -1 �� �� 194 partial pressure (hPa)weight asK, given degree the(83.144 substance in �� where M oxygen (O2) is the 191 in molecular oxygen mg mol a gas� �constant �of� 189 �������� �(32000 � The � of),�biodegradation �R� is���� (3)l hPa ��� (ml),�α �� � is a Bunsen barley cultivars. liquid phase volume absorption −1 −1 can be calculated from the Equation (4): 195 percentages mol K ), Tm is the measuring temperature (K), T0 is 273.15 K, Vtot is the bottle volume (ml), Vl is the 192 190 coefficient (0.03103) and Δp (O2) is the difference 196 193 liquid phase volume (ml), α is a Bunsen absorption coefficient (0.03103) and Δp (O2) is the difference where M (O2) is the molecular 191 weight of oxygen (32000 (hPa) mg mol-1as ), R is a gas (83.144 l hPa in partial oxygen pressure given byconstant WTW. ��� 194 in partial oxygen pressure (hPa) as given by WTW. The degree 197 ��������������������������%� � of biodegradation � ���% of the(4)substance in −1 −1 ���� mol K ), Tm is the measuring 192 temperature (K), T0 is 273.15 K, of Vtot is thesubstance bottle volume in (ml), Vl is the The degree of biodegradation the 195 percentages can be calculated from the Equation (4): 198 liquid phase volume (ml), 193 α is a Bunsen absorption coefficientfrom (0.03103) and Δp (O2) (4): is the difference percentages can be calculated the Equation. Biodegradation tests. 196 199 in,where is the theoretical demand and isThe calculated here from the carbon content of the in oil 194 partialThOD oxygen pressure (hPa)oxygen as given by WTW. degree of biodegradation of the substance ��� -1 197 ��������������������������%� � is calculated � ���% (4) [mg L-1] [mg mg-1]. BOD 200 Equation (4) isthe also in the unit from the can beincalculated from Equation (4):[mg mg ] and RME195 werepercentages measured (4)BOD. Biodegradation of RSO and ���� 201 value by Equation (5): 196 both in OECD 301F tests conditions (OECD 1992) 198 ���fromdemand 202 and in the ground water provided by197 the water where ThOD is the theoretical 199 ,wheretreatThOD is the theoretical oxygen demand and is calculated here the carbonand content ��������������������������%� �oxygen � ���% (4) of the oil ���� ������� -1 -1�� -1 �� ment plant Paavolan Vesi Ltd in Ruukki. is calculated here from the carbon content thetheoil [mg mg ]. BOD in Equation 200 (4) is also in �the [mg mg ] and from BOD [mg � �is calculatedof � unit �������� 203 ��������� (5)L ] ������� 198 -1 The biodegradation in OECD 301F conditions [mg mg ]. BOD in Equation (4) is also in the unit 201 value by Equation (5): 199 demand and is calculated here from the carbon content of the oil 204 ,where ThOD is the theoretical oxygen is used to measure the biodegradation [mg mg-1] and is calculated-1from the BOD [mg L-1] 202 in optimal mgV-1sample 200 ]. BOD in Equation is also[L] in and the m unit [mg ] andofisthe calculated from the BOD [mg L-1] where 205 [mg is the volume of(4) sample is mg the mass sample [mg]. sample ������� value by Equation (5): conditions. The biodegradation in203ground water �� � �� � � �������� � (5) 201 value by Equation (5): ��������� ������� was measured for ground water 206 protection Results pur202 204 substances poses to have information on how these ������� (5) �� � �� � where Vsample 205 though of sample [L] and of the sample [mg]. � m�������� � 203 ��������� (5) sample is the mass behave if contaminants leak and transfer theis the volume ������� 7 soil into the ground water. 204 206 Results The biodegradation tests were205 carried out uswhere Vsample[L]isand themvolume of sample [L] and m where Vsample is the volume of sample sample is the mass of the sample [mg]. sample ing the manometric respirometric BOD (Biological is the mass of the sample [mg]. 7 206 This Results Oxygen Demand) Oxitop® method. method is based on very accurate automatic pressure mea7 surements in closed bottles under constant temperature (here 20.0 ± 0.2 °C). When organic matter degrades, it requires a certain amount of oxygen, Equation (1):. Results. Fuel specifications of RSO and RME. Corg + O2(g) → CO2(g) (1) CO2(g) + 2NaOH(s) → Na2CO3(s) + H2O(l) (2). When oxygen is consumed from the gas phase the pressure falls and at the same time carbon dioxide gas is produced; but in this method the carbon dioxide is absorbed onto solid sodium hydroxide pellets and therefore it does not affect the measured pressure, Equation (2). The measurement time of 28 days was used in our biodegradation tests. The. 135. Some physical properties of RSO and RME were measured to evaluate the quality of these liquids. The density, surface tension, water content and oxidation stability were measured at the Biofuel Laboratory of Vaasa Energy Institute. The higher heat value, viscosity and acid number were measured at the Department of Chemistry, University of Oulu. Measured values are presented in Table 2..
(6) AGRICULTURAL AND FOOD SCIENCE Vauhkonen, V. et al. The phytotoxicity and biodegradation of RSO and RME Table 2. Physical and chemical properties and elemental analyses of the rapeseed oil (RSO) and rapeseed oil methyl ester (RME). Property Density at 20°C, kg m. -3. Surface tension at 20°C, dyn cm-1 Water content, mg kg-1 Oxidation stability, h Higher Heat Value, MJ kg. -1. Viscosity at 20°C, mm2 s-1. RSO. RME. Standard. 918.0. 880.0. ISO 649. 32.9. 31.4. ISO 6889. 414.0. 462.5. ISO 12937. 1.97. 1.64. EN 14112. 39.4. 40.0. ASTM D240. 58.0. 6.4. ASTM D2983. Acid Number, mg KOH g-1. 5.45. 0.86. EN 12634. Carbon, %. 77.8. 74.8. EN 14538. Hydrogen, %. 12.1. 11.6. EN 14538. Phosphorus, mg kg-1. 16.0. 0.1. EN 14538. 0.8. 0.5. EN 14538. <0.1. 0.3. EN 14538. 13.5. 0.2. EN 14538. 2.7. <0.1. EN 14538. Calcium, mg kg. 35.4. 0.4. EN 14538. Copper, mg kg. <0.1. <0.1. EN 14538. 0.2. 0.1. EN 14538. Sodium, mg kg. -1. Iron, mg kg-1 Potassium, mg kg. -1. Magnesium, mg kg-1 -1. -1. Zinc, mg kg-1. Effects on the vegetation The barley sprouts showed signs of stress and started to wither straight away at the beginning of. the experiment. After one week the barley vegetation inside the test plots with the RME contamination started to wither from where the RME had been in direct contact with the leaves.. Fig. 1. The withering effect of rapeseed oil (on left) and rapeseed methyl ester (on right) with contamination level of 2.0 liters per square meter at the Koulutila test site.. 136.
(7) AGRICULTURAL AND FOOD SCIENCE Vol. 20(2011): 131–142. This effect was not detected at the same time on test plots with RSO contamination. However, later on the effect of the RSO increased and the sprouts in the test plots with RSO contamination started to wither rapidly (Fig. 1). When the harvesting of the barley vegetation from the test plots was started, the vegetation with the highest contamination level of both contaminants was almost totally withered. Three months after the actual test ended there were noticeable differences in the test matrices. The test plots with the largest concentration of contaminants RSO and RME, had only a small amount of undergrowth compared with those with zero contamination. The soil surface inside the plots which had had 2.0 liters of RSO contamination had also turned dark (Fig. 2).. Effects on phytomass The contamination with both RSO and RME had phytotoxic effect on the barley growth at both test sites. Both RME and RSO caused significant losses of vegetation by the end of the test period (Table 3 and Fig. 3). The RSO contamination at the Koulutila test site reduced (F = 13.13, p = 0.01) the harvested wet mass by 29% with a contamination level of. Wet mass, grams 700 0.0, l m⁻². 0.5, l m⁻². 2.0, l m⁻². 600 500 400 300 200 100 0. RSO (Koulutila). RME (Koulutila). RSO RME (Rahkakorpi) (Rahkakorpi). Fig. 3. The measured phytomasses (±SD) of barley crops with different contamination levels of rapeseed oil (RSO) and rapeseed oil methyl ester (RME) at the Koulutila and Rahkakorpi test sites. Table 3. The relative reduction of phytomasses caused by the contaminants rapeseed oil (RSO) and rapeseed oil methyl ester (RME). Rahkakorpi Koulutila Contamination level. RSO. RME. RSO. RME. 0.0 l m-2. 0%. 0%. 0%. 0%. 0.5 l m-2. -29%. -41%. -41%. -46%. 2.0 l m-2. -84%. -55%. -77%. -71%. 0.5 liters per square meter and by 84% with a contamination level of 2.0 liters per square meter. At the same test site the RME reduced (F = 18.68, p < 0.001) the recovered wet mass by 41% with a contamination level of 0.5 liters per square meter and by 55% with a contamination level of 2.0 liters per square meter. RSO contamination levels of 0.5 and 2.0 liters per square meter decreased (F = 24.67, p < 0.001) the amount of harvested wet masses at the Rahkakorpi test site by 41% and 77%, respectively. The wet mass reduction (F = 167.51, p < 0.001) in the test squares, with RME as a contaminant, was 46%. Fig. 2. The effect of rapeseed oil (RSO) in the Koulutila test matrix 3 months after the test ended.. 137.
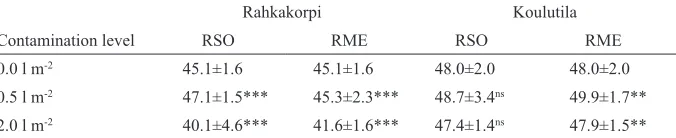
(8) AGRICULTURAL AND FOOD SCIENCE Vauhkonen, V. et al. The phytotoxicity and biodegradation of RSO and RME with 0.5 liters per square meter and 71% with 2.0 liters per square meter. There was considerable variations between some of the test plots (RSO 0.5 liters per square meter at Koulutila and RSO 0.5 and 2.0 liters per square meter at Rahkakorpi). This might be the result of the uneven spread of the contaminant. The mass reduction was similar at both of the test sites despite different cultivars and the fact that the Koulutila test site was partly contaminated with oat growth. The oat was transferred to the test site along with the dry manure. The cold air drying reduced the total mass of the sheaf’s by 34.80 ± 1.06% (mean value ± SD) and because of the consistent reduction of mass, after the drying, the effects on the phytomass was only evaluated using harvested wet masses. The variance analyses using dry masses showed similar dependency between contamination levels vs. harvested dry masses.. The weight of 1000 kernels The measured kernel masses from the plots without contamination were higher compared to those reported with the Saana and Vilde cultivars; 46.1 g and 41.9 g, respectively (Kangas, et al. 2009). The moisture content of the kernels was determined for kernels harvested from the test plots. The barley harvested from the Koulutila test site had a moisture content of 9.2 ± 0.2% and at Rahkakorpi it was 10.4 ± 0.2% (mean value ± mean error). The weight of 1000 kernels was also influenced by both of the contaminants (see Table 4). The. changes in the kernel masses were influenced by the contamination level introduced to the test plots. The RSO (F = 13.59, p < 0.001) and RME (F = 10.87, p < 0.001) showed a small increase in kernel masses with the 0.5 liter contamination level at the Rahkakorpi test site and the 2.0 liter contamination level decreased the kernel masses. The effects of RSO at the Koulutila test site was similar to other measurements taken but they were still insignificant (F = 0.47, p = 0.63). RME contamination at the Koulutila test site slightly increased (F = 3.69, p = 0.04) the kernel masses with contamination level of 0.5 liters per square meter and the 2.0 liter contamination level decreased the kernel masses.. Biodegradation The biodegradations of RSO and RME in OECD 301F conditions are presented in Fig. 4. The biodegradation levels (BOD/ThOD) after a time period of 28 days for RSO and RME, were 65.8% and 60.6%, respectively. The small difference between the biodegradation levels can be explained by the differences in the chemical compositions of RSO and RME, and therefore their different biodegrading components. The studied liquids had been aged which can be seen with the increase in their acid value. The differences in chemical compositions mean differences in the oxidation components in the RSO and RME which can inhibit the biodegradation of these substances. The RME should actually biodegrade more rapidly than the RSO because the RSO was more stable in the oxidation stability test.. Table 4. The effect of rapeseed oil (RSO) and rapeseed oil methyl ester (RM) to the measured dry masses (g) of 1000 kernels harvested from the test plots. Data are mean ± SD Rahkakorpi Contamination level. RSO. Koulutila RME. RSO. RME. 0.0 l m. 45.1±1.6. 45.1±1.6. 48.0±2.0. 48.0±2.0. 0.5 l m-2. 47.1±1.5***. 45.3±2.3***. 48.7±3.4ns. 49.9±1.7**. 2.0 l m-2. 40.1±4.6***. 41.6±1.6***. 47.4±1.4ns. 47.9±1.5**. -2. Statistically significant differences are indicated as follows: ns = not significant, *, p<0.05; **, p<0.01; ***, p<0.001. 138.
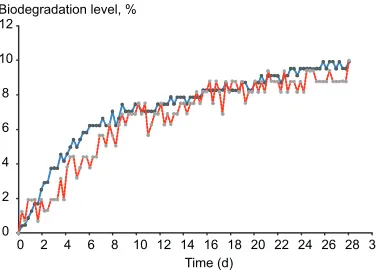
(9) AGRICULTURAL AND FOOD SCIENCE Vol. 20(2011): 131–142. The biodegradation results determined in the ground water differed from those measured in OECD 301F optimal conditions (Fig. 5). RSO and RME both started to degrade in an almost similar way when compared to each other. The biodegradation level after the 28 day period was 9.9% for RSO and 10.0% for RME. Both substances still started to degrade during this measurement period and therefore both are fairly biodegradable also in the ground water.. Biodegradation level, % 70 60 50 40 30 20 10 0. 0. 2. 4. 6. 8. 10 12 14 16 18 20 22 24 26 28 30 Time (d). RSO (OECD). RME (OECD). Fig. 4. The biodegradation of rapeseed oil (RSO) and rapeseed oil methyl ester (RME) in OECD 301F conditions. Biodegradation level, % 12 10 8 6 4 2 0. 0. 2. 4. 6. 8. 10 12 14 16 18 20 22 24 26 28 30 Time (d). RSO (Ground water). RME (Ground water). Fig. 5. The biodegradation of rapeseed oil (RSO) and rapeseed oil methyl ester (RME) in ground water.. 139. Discussion Fuel properties The physical parameters measured for RSO and RME are similar to the ones measured previously in our own studies (Niemi et al. 2009). The only properties that could indicate that these substances might have been stored for a period of time are the oxidation stability and acid number which doesn’t meet the limits set by the EN 14112 standard (6 h and less than 0.5 mg KOH g-1, respectively). Oxidation stability doesn’t have a straight correlation to the time that the RME is stored. The reasons for these changes in oxidation stability are related to: the fatty acid composition of the oil or biodiesel, the concentration of certain metals (e.g. Cu and Fe) and water content (Vauhkonen et al. 2009). The oxidation stability doesn’t therefore have a straight correlation to the age and/or the quality of the vegetable oil or biodiesel as a fuel. As a result of oxidation, formic and other organic acids are formed in vegetable oils and biodiesel. These substances increase the acid value. The RSO and RME investigated had high acid values 5.45 and 0.86 mg KOH g-1, respectively. This indicates that both RSO and RME have been partly oxidized. The RSO had large amounts of phosphorus (16.0 mg kg-1), potassium (13.5 mg kg-1), magnesium (2.7 mg kg-1) and calcium (35.4 mg kg-1) compared to those of RME. This might be a result of a high pressing temperature and a lack of adequate filtering of the oil. Phosphorus is normally fixed in the plant fibers and a high pressing temperature can transfer phosphorus into the pressed oil. If the rapeseed oil has a large phosphorus content it is dangerous to the engine because it is abrasive. Large amounts of phosphorus can also cause blocking of the fuel filters and deposits on valves and pistons (Thuneke 2006). Studies have also shown that phosphorus can have a poisoning effect to the catalyst materials in exhaust gas catalyzers (Kröger 2007, Rokosz et al. 2001). Magnesium and calcium can cause polymerization, similar to making soap with rapeseed.
(10) AGRICULTURAL AND FOOD SCIENCE Vauhkonen, V. et al. The phytotoxicity and biodegradation of RSO and RME oil (Baquero et al. 2010). High concentrations of these elements have also been related to the ash content of the oils and biodiesels in our previous measurements. Kröger (2007) has concluded that calcium also can decrease the catalytic activity of components used in automotive catalysts. The RSO used in these measurements therefore could not be used in diesel engines, as such. The alkali metals sodium and potassium are both measurable values in the EN 14214 standard for biodiesels. For RME these values are under the maximum limit (less than 5.0 mg kg-1) set for biodiesels. The concentrations of hazardous heavy metals copper and zinc were also measured in this work. The concentrations of these metals in both RSO and RME were lower than 0.2 mg kg-1, and therefore these metals shouldn’t cause problems in the soil or to the vegetation. The concentration of iron in RME was 0.3 mg kg-1 which is high enough concentration to have a negative impact to the oxidation stability. Sarin et al. (2009) reported that an iron concentration of 0.5 mg kg-1 decreased the oxidation stability of Jatropha oil methyl ester by an hour.. Phytotoxicity tests The results of this study indicate that both RSO and RME have a negative impact on barley growth. The phytomass growth (wet mass) was highly influenced by the amount of contaminant introduced to the test sites. Despite the contaminants not being spread evenly on the sprouts some of the test plots showed almost total loss of vegetation. Similar types of contamination measurements have been earlier carried out with pine seedlings (Lauhanen et al. 2000, Flykt et al. 2003) and in these studies there have been noticeable disorders in the plant’s physiology. In our study we used barley sprouts that are much more sensitive to contaminants than pine seedlings due to the larger respiration surfaces of the barley sprouts compared to those of pine seedlings. Gong et al. (2008) found that sunflower oil had an inhibitory effect on Brassica rapa L. bio-. mass growth, the effect increased with increasing amounts of sunflower oil. Similar effects, such as reduction of biomass, was also shown in this work with both of the studied contaminants RSO and RME. Boz et al. (2010) showed that the olive processing residues can also inhibit the growth of certain weeds. The contaminants left a noticeable film on the barley sprouts. The rapeseed oil and also rapeseed oil methyl ester, both being in contact with air, start to form polymers as a result of oxidation. This means that contaminants in the case of polymerization formation will suffocate the plant. Therefore stored rapeseed oil and rapeseed oil methyl esters can be said to act as herbicides. The dry weight of kernels was also influenced by both of the contaminants. Small contamination levels showed a small increase in kernel masses and higher contamination levels reduced the kernel masses. There could be several reasons for this effect. The studies with pine seedlings (Flykt et al. 2003) showed that the bio-oil contamination increased the amount of dissolving nitrogen in the soil at low oil contamination levels. This might partly explain the small increase of the measured kernel masses with small contamination levels in this study. The reduction of kernel masses might be explained by the uneven spread of the rapeseed oil and rapeseed oil methyl ester. The leaves that were contaminated by the substances used withered and therefore the natural growth of the barley was disturbed. The contaminants were absorbed into the soil more efficiently at the Rahkakorpi test site because the soil type was more porous than the soil at the Koulutila site. This means that the contaminants might have reached the root zone and damaged the root system. This could explain the reduction of kernel masses at the Rahkakorpi test site. Both the rapeseed oil and rapeseed oil methyl ester will also change the pH level of the soil and therefore also have an effect on the micro-organisms and their interrelationships (Lapinskiene et al. 2006). The contaminants used might have also therefore affected the normal metabolism of the microbes in the soil. Microbes have been reported to be able to consume small amounts of bio-oils and the amount of microbes has increased and larger contamination. 140.
(11) AGRICULTURAL AND FOOD SCIENCE Vol. 20(2011): 131–142. levels have decreased the amount of microbes in the soil (Flykt et al. 2003). Al-Darbi et al. (2005) showed that the different types of oils had different kind of effect to the amount of microbes in seawater and waste water contaminations.. Biodegradability tests The studied rapeseed oil and rapeseed oil methyl ester were effectively biodegradable in OECD 301F test conditions but also at a slower rate in ground water. The large difference in biodegradation levels between these two conditions is caused by the fact that the OECD 301F condition is the optimal condition for biodegradation and the ground water test is closer to the natural environment for biodegradation. The biodegradation rates of RSO and RME measured in these test vary from those reported in various studies in both; optimal and also in aquatic conditions (Peterson and Möller 2004, Zhang et al. 1997). The reason for this might be that the substances used in this study had been stored over a period of time and the fuel characteristics had changed. The acid values were higher due to the increased amounts of organic acids (e.g. formic acid) in these fuels as a result of oxidation. The organic acids can also be formed as a result of microbial activity (Schricher et al. 2009). It has also been suggested that the viscosity, structure and compostion of the oils and fats have an effect on the biodegradation rates and also oxidation products can either accelerate or inhibit the biodegradation (Al-Darbi et al. 2005). Lapinskiené and Martinkus (2007) studied the intermediate biodegradation products of biodiesel, sunflower oil, diesel and beef grease. These measurements showed that the biodegradation products that are formed consist of acetic acids and propionic acids that both are antibacterial substances. There is also evidence that the autoxidation as a part of the deterioration process can accelerate the biodegradation process by producing smaller and easier compounds to be biodegraded or inhibits it by producing antibacterial products (e.g. formic acid) (Al-Darbi et al. 2005). Therefore it can be concluded that the oxidation. 141. products could have affected the biodegradation tests in this study.. Conclusions This study concentrated on phytotoxic effects of stored rapeseed oil and rapeseed oil methyl ester and the biodegradability of these substances in OECD 301F conditions and ground water. Some of the fuel properties (acid value and oxidation stability) had been affected by the storing and did not meet the values set by the standards. The results indicate that the stored rapeseed oil and rapeseed oil methyl ester used in this study both had a phytotoxic effect when they were in direct contact with barley sprouts. Both substances biodegraded in the laboratory tests and therefore it can be concluded that, in small spill-like contaminations, they should not cause long term environmental problems to the soil or ground water. There were also indications that the seed masses could be affected by the contamination. Acknowledgements. The authors are grateful to the Oiva Kuusisto Foundation for the financial support of this study. The staff of Biofuel Laboratory of Vaasa Energy Institute are thanked for making part of the measurements for this study.. References Aluyor, E. O., Obahiagbon, K. O., & Ori-jesu, M. 2009. Biodegradation of vegetable oils: A review. Scientific Research and Essay 4: 543-548. Al-Darbi, M. M., Saeed, N. O. & Islam, M. R. 2005. Biodegradation of Natural Oils in Seawater. Energy Sources 27: 19-34 ASTM D240-09. Standard Test Method for Heat of Combustion of Liquid Hydrocarbon Fuels by Bomb Calorimeter. American Society for Testing and Materials. 2009. 9 p. ASTM D2983-09. Standard Method for Low-Temperature Viscosity of Lubricants Measured by Brookfield Viscometer. American Society for Testing and Materials. 2009. 14 p. Baquero, G., Esteban, B., Rius, A., Riba, J.-R. & Puig, R..
(12) AGRICULTURAL AND FOOD SCIENCE Vauhkonen, V. et al. The phytotoxicity and biodegradation of RSO and RME 2010. Small-scale production of straight vegetable oil from rapeseed and its use as biofuel in the Spanish territory. Energy Policy 38: 189-196. Boz, Ö., Ögüt, D. & Dogan M. N. 2010. The phytotoxicity potential of olive processing waste on selected weeds and crop plants. Phytoparasitica 38: 291-298 Demirbas, A. 2008. Comparison of transesterification methods for production of biodiesel from vegetable oils and fats. Energy Conversion and Management 49: 125-130. Demirbas, A., & Karslioglu, S. 2007. Biodiesel production facilities from vegetable oils and animal fats. Energy Source Part A 29: 133-141. EN 12634. Petroleum products and lubricants-Determination of acid number-Non-aqueous potentiometric titration method. European Committee for Standardization. 1999. 16 p. EN 14112. Fat and oil derivates. Fatty acid methyl esters (FAME). Determination of oxidation stability (accelerated oxidation test). European Committee for Standardization. 2003. 18 p. Flykt, E., Sarjala, T., Strömmer, R., & Lauhanen, R. 2003. Mineraali- ja bioöljypohjaisten hydrauliikkaöljyjen vaikutukset hajottajaravintoverkkoon. Metsäntutkimuslaitoksen tiedonantoja - The Finnish Forest Research Institute, Research Papers 909. 29 p. Gong, Z., G., Li, P., L., Wilke, B. M., & Alef, K. 2008. Effects of vegetable oil residue soil extraction on physical-chemical properties of sandy soil and plant growth. Journal of Environmental Sciences 20: 1458-1462. ISO 12937. Determination of water-Coulometric Karl Fischertitration method. International Organization for Standardization. 2000. 22 p. ISO 6889. Surface active agents-determination of interfacial tension by drawing up liquid films. International Organization for Standardization. 1986. 24 p. ISO 712. Recommendation ISO712-1979(E). Cereals and Cereal Products-Determination of Moisture Content. International Organization for Standadization.1979. 16 p. Kangas, A., Laine, A., Niskanen, M., Salo, Y., Vuorinen, M., Jauhiainen, L., & Nikander H. 2009. Virallisten lajikekokeiden tulokset 2002-2009. MTT Kasvu 6: 184 p. Knothe, G. 2009. Biodiesel and renewable diesel: A comparison . Progress in Energy and Combustion Science 36: 364-373. Knothe, G. 2007. Some aspects of biodiesel oxidative stability . Fuel Processing Technology 88: 669-677. Kröger, V. 2007. Poisoning of automotive exhaust gas catalyst components: The role of phosporus in the poisoning phenomena. Academic dissertation. Faculty of Technology, Department of Process and Environmental Engineering, Mass and Heat Transfer Process Laboratory, University of Oulu, Acta Universitatis Ouluensis C 283. 90 p. Kuokkanen, T., Vähäoja, P., Välimäki, I. & Lauhanen, R. 2004. Suitability of the respirometric BOD Oxitop Method for Determining the Biodegradability of Oils in Ground Water Using Forestry Hydraulic Oils as Model Compounds. International Journal of Environmental Analytical Chemistry 84: 677-689 Lapinskiene, A. & Martinkus, P. 2007. Research on Anaerobic Biodegradation of Fats, Biodiesel Fuel and Diesel Fuel in Soil Medium. Environmental Research, Engi-. neering and Management 1: 30-37 Lapinskiene, A., Martinkus, P., & Rebzdaite, V. 2006. Ecotoxicological studies of diesel and biodiesel fuels in aerated soils. Environmental Pollution 142: 432-437. Lauhanen, R., Kolppanen, R., Takasalo, S., Kuokkanen, T., Kola, H., & Välimäki, I. 2000. Effects of biodegradable oils on forest environment and forest machines. In: Proceedings of the International Scientific Conference Forest and Wood Technology vs. Environment, November 20-22, 2000, Brno, Czech Republic: 203-206. Mariano, A. P., Tomasella, R. C., de Oliveira, L. M., Contiero, J., & de Franceschi de Angelis, D. 2008. Biodegradability of diesel and biodiesel blends. African Journal of Biotechnology 7: 1323-1328. Niemi, S., Vauhkonen, V., Hiltunen, E., Salminen, H., Kyllästinen, J., Palmgren, P., Koskinen, N., Karhu, T. & Ekman, K. 2009. Performance and Exhaust Emissions of a Non-Road Diesel Engine Driven with Different Animal Fat and Vegetable Oil Based on Bio-Fuels. 7th International Colloquium Fuels: Mineral Oil based Alternative Fuels. Ostfildern: Technische Akademie Esslingen: 145-155. OECD 1992. OECD guidelines for the testing of chemicals. Section 3: degradation and accumulation. Test 301: Ready biodegradability. 1992. Paris, France: OECD. 62 p. Peterson, C. L. & Möller, G. 2004. Biodegradability, BOD5, COD and Toxicity of Biodiesel Fuels. Available on the internet http://www.uiweb.uidaho.edu/bioenergy/biodieselED/publication/04.pdf Rokosz, M. J., Chen, A. E., Lowe-Ma, C. K., Kucherov, A. V., Benson, D., Paputa Peck, M. C., McCabe, R. W. 2001. Characterization of phosphorus-poisoned automotive exhaus catalysts. Applied Catalysis B: Environmental 33: 205-215 Sendzikiene, E., Makareviciene, V., Janulis, P. & Makareviciute D. 2007. Biodegradability of biodiesel fuel of animal and vegetable origin. European Journal of Lipid Science and Technology 109: 493-497 Scheicher, T., Werkmeister, R., Russ, W. & Meyer-Pittroff, R. 2009. Microbial stability of biodiesel-diesel-mixtures. Bioresource Technology 100: 724-730 Thompson, J. C., Peterson, C. L., Reece, D. L., & Beck, S. M. 1996. Two Year Storage Study with Methyl and Ethyl Esters of Rapeseed. Proceedings on the 3rd Liquid Fuel Conference: 104-114. Thuneke, K. 2006. Rapeseed Oil Fuel-Production, Quality Demands and Use Experiences. Biomass for Energy-Challenges for Agriculture [online] [cited 22.5.2011]. Available at: http://w w w.nor thseabioenergy.org/ files/17397/Klaus_Thuneke.pdf. Vauhkonen, V., Hiltunen, E., Niemi, S., Salminen, H., & Pasila, A. 2009. The first generation biodiesel:the effects of raw material on physical properties, oxidation stability and emissions. 2nd International Conference on Clean Electrical Power, Renewable Energy Resources Impact: 117-123. Zhang, X., Peterson, C. L., Reece, D., Möller, G. & Haws, R. 1997. Biodegradability of biodiesel in the aquatic environment. Transactions of the ASAE. 41: 1423-1430. 142.
(13)
Figure


+2
Related documents
From the output images shown in Chapter 3, the image obtained from the median filter has no noise present in it and is close to the high quality image. The sharpness of the image
Results: Our analysis confirmed the presence of the autonomic response pattern of cardiac deceleration and increased phasic electrodermal activity following true positives,
Tab.2 The “potential” of periurban areas: a selection of possible functions and services that could be performed or offered by or in periurban areas of the Lombardy Region Pilot
disparity map estimation, stereo matching, mean-field optimization, graphical models, image processing, linear inverse prob- lems, image restoration, image deblurring, image
Banks are searching for ways to reduce the cost of branches – finding dollars to invest in alternative delivery channels. Half of all banks have average core deposits
Mosquito abundance and annoyance levels, and protective measures used by residents in 2 low-income communities in Pak Kret District, Nonthaburi Province, in central Thailand based
Deep drilling projects exploring supercritical resources such as these carried out in Iceland, Italy or Japan, where temperatures went significantly above the critical point
