Detecting Clone Radio Frequency
Identification Tags
by
Luke Thomas Mirowski, BComp
A dissertation submitted to the School of Computing
in partial fulfilment of the requirements for the degree of
Bachelor of Computing with Honours
University of Tasmania
Declaration
This thesis contains no material which has been accepted for the award of any other degree or diploma in any tertiary institution, and to my knowledge and belief, this thesis contains no material previously published or written by another person except where due reference is made in the text of the thesis.
Abstract
Acknowledgements
I would like to express my gratitude to everyone that has helped in some way make this thesis possible.
I would like to say thank you to my wonderful supervisor Jacky Hartnett. I am deeply indebted to her for the time, effort, and finances she contributed to this research.
I am grateful to Tony Gray for obtaining the Radio Frequency Identification (RFID) data set. Without it my research would have been considerably more difficult.
I am also grateful to Joel Scanlan for his advice and text books that I often relied upon.
I would like to say a big ‘thank you’ to the other students in the School of Computing who made the year fun and memorable.
Table of contents
1 Introduction ... 1
2 Literature review ... 3
2.1 RFID overview ... 3
2.1.1 RFID applications... 4
2.2 Problem of tag cloning ... 5
2.2.1 Active attacks ... 6
2.2.2 Passive attacks: Tag cloning... 7
2.2.3 Impact of tag cloning... 9
2.3 Proposed solutions to tag cloning... 10
2.4 Principles of intrusion detection... 11
3 Methodology ... 17
3.1 Description of data set ... 17
3.2 System architecture and operation ... 18
3.2.1 Target system ... 20
3.2.2 Feed ... 20
3.2.3 Audit log... 21
3.2.4 Knowledge base ... 22
3.2.5 Processing... 24
3.2.6 Alerts ... 28
3.3 Testing ... 29
3.3.1 Phase one: initial validation ... 29
3.3.2 Phase two: performance of classifying behaviour... 29
3.3.3 Phase three: performance at detecting attacks... 34
4 Results and Discussion ... 39
4.1 Phase one results ... 39
4.2 Phase two results ... 39
4.3 Phase three results ... 41
5 Conclusion... 46
5.1 Further work ... 46
6 References ... 48
7 Appendices ... 50
Appendix A – Communication with SpeedPass, USA... 50
Appendix B – Statistical Java code ... 51
Figures
Figure 1 - Tag identity threat model... 6
Figure 2 - Architecture of Deckard ... 20
Figure 3 – Hypothetical tag usage for tag 351 in audit log ... 26
Figure 4 - Microsoft Excel STDEVP formula... 26
Figure 5 – DFM confidence interval ... 28
Figure 6 - Audit log 10 fold cross validation ... 32
Figure 7 - Validation algorithm... 32
Figure 8 - Detecting attacks... 35
Figure 9 - True positive rate ... 35
Figure 10 - False positive rate ... 36
Figure 11 - Precision ... 36
Figure 12 - Synthesizing attacks in audit log ... 36
Tables
Table 1 - Proximity card data ... 18Table 2 - Reader two audit log extract ... 21
Table 3 - Structure of a tag profile ... 22
Table 4 – Location Frequency Profile ... 23
Table 5 - Tag activity at each reader ... 30
Table 6 – Standard deviation results for tag 351... 39
Table 7 - Lower and upper threshold results ... 40
Table 8 - Upper threshold results ... 41
Table 9 – Attack intensity and frequency results ... 42
1 Introduction
Identity crime, which involves the fraud or theft of people’s credentials, is one of the fastest growing crimes of the new millennium. Perpetrators can use an unsuspecting victim’s information for a range of crimes such as financial gain, people smuggling, drug trafficking, terrorism and money laundering (ACPR 2006). Agencies responsible for monitoring identity theft report the following statistics: in Australia it is estimated that identity fraud cost $1.1 billion during 2001-2002 (ACPR 2006); in the United States during 2003, almost 10 million Americans were victims of identity theft, with a total cost to business and consumers of almost $50 billion (FDIC 2004); in the United Kingdom, between 2002-2006 identity related fraud is estimated to have cost £1.72 billion (Home-Office 2006).
Radio Frequency Identification (RFID) is a means of uniquely identifying objects using a combination of tags, readers, and middleware. Every tag has a unique number which identifies the object that it is attached to. The role of a reader is to query tags to obtain their identification number and inform the middleware of each tag and associated object’s location. RFID is being used in many applications including physical access control, and supply chain visibility in the item level tagging of products. The global RFID market in 2005 was worth $1.94 billion, which is expected to increase to $24.50 billion by the year 2015 (IDTechEx 2005) as item level tagging becomes more prolific.
Unfortunately the tags are vulnerable to identity theft which can enable identity related crime to occur. In systems that use RFID, tag cloning may enable an attacker to gain access to a secure facility, make fraudulent purchases, or disrupt supply chains. They may even be able to carry out crimes like those often associated with mainstream identity crime. This is bad news for the more than 1.8 billion tags (IDTechEx 2005) that are in currently in existence.
strategically positioned on the edge of RFID systems, they could be capable of monitoring tag activity to defend against clone tags.
Intrusion detection may be one security paradigm that could be used to defend against tag cloning. Much like burglar alarms, they monitor the activity occurring within a system and respond when suspicious activity occurs. As the behaviour of a clone tag would be abnormal to an RFID system, an intrusion detection system may detect and respond to their presence.
The aim of this research is to investigate whether it is feasible to apply the principles of intrusion detection to detect clone RFID tags. The detection of clone tags would be the first step in defending against them and preventing RFID-enabled crime from occurring.
2 Literature review
This chapter will discuss how and why the principles of intrusion detection may be applied to detect clone tags. It will do this by firstly giving an overview of what exactly RFID technology is. Then it will examine the threat of tag cloning with several examples where clone tags have been used to demonstrate the threat that they pose. A brief discussion of why some of the proposed solutions are impractical to the problem is then given. And finally the principles of intrusion detection are outlined to illustrate how they may be useful in defending against tag cloning.
2.1 RFID overview
RFID consists of three components: tags, readers, and middleware. Tags can be attached to practically any objects in order to uniquely identify them; clothing, cars, animals, or people. When a tag is in range of a reader, it will respond with its unique identification number, its identity, which tells the reader which tag and hence which object is within range. RFID typically assumes, but is not guaranteed, that a tag is permanently attached to an object. This means when a tag is in range of a reader, the system believes that it must be the original object presenting the tag back to the system.
In Hamburg Germany, public libraries are using RFID to track the movement of books, magazines, and DVD’s. The technology allows patrons to check-in and check-out their items at self serve stations that have a reader at them (Wessel 2006). This is possible as every item in the library has a uniquely identifiable tag attached to it.
Specifically, the term “RFID” incorporates a number of contactless integrated circuit technologies that operate on the following radio frequencies: < 135 KHz, 13.56 MHz, 862-915 UHF, 2.45 GHz, 5.8Ghz (Schuermann 2000). These devices include proximity cards which are used for physical access control, and EPC Generation One and EPC Generation Two tags, a standard class of RFID tag commonly used for item level tracking of products in a supply chain.
they are powered from the radio signal that the reader emits they tend to be short range devices. This allows them to exist in an RFID system for an indefinite time period. And as a result are most the most widespread type of tag, of which there were 1390 million sold by the year 2005 (IDTechEx 2005).
In contrast, active tags have an onboard power supply which enables them to be read from a greater distance of 100 feet or more (Garfinkel & Holtzman 2005), but it means that their lifespan is determined by the duration of their power supply. As these tags are more expensive, they are used in a limited number of high cost applications. There were 410 million active tags sold by the year 2005 (IDTechEx 2005).
The reader is responsible for querying tags for their data, and in turn transmitting the results of a query back to the middleware. The middleware is typically a database that knows which tag has been attached to which object. Therefore the outcome of this process informs the middleware of where a tag and its associated object are located.
2.1.1 RFID applications
RFID technology is being used in many different applications; from supply chain management, to physical access control, and contactless payment systems. Often these systems rely on the uniqueness of each tag to not only identify objects, but also to authenticate them.
The pharmaceutical industry is moving toward the mass tagging of drug products by 2007. According to the U.S. Food and Drug Administration’s 2004 report on combating counterfeit drugs, their aim is to limit the potential for counterfeit products to enter the supply chain. The unique number that tags have, has been proposed as the means by which each drug purchaser can determine a drug’s authenticity (FDA 2004). The effect of clone tags in this system may mean that counterfeit drugs can be sold to consumers.
The proximity card RFID system is used to control physical access to facilities using credit card sized tags called proximity cards. Each human user in this system is given a proximity card that grants them access to, for example, a building. To gain access, the user swipes their card within range of the reader-enabled door which then verifies the access rights of the card. In the United States, King’s Daughters Medical Centre is using proximity cards to control access to medical storage cabinets that contain cardiac medical devices (Swedberg 2005). In such applications, if it is possible for the system to respond to a clone tag then the security goals of the system are completely invalidated.
Another use of RFID technology has been the Exxon Mobil SpeedPass contactless payment system. Its seven million users can make purchases at over 10,000 locations world wide by simply presenting their SpeedPass tag to a petrol pump (Bono et al. 2005). A reader-enabled petrol pump queries a SpeedPass tag to determine its identification number, which tells the system which customer’s account to debit. Clone tags in this system would result in some unhappy customers paying for the attacker’s free petrol.
2.2 Problem of tag cloning
RFID technology operates under the assumption that every tag is unique. That is, there is no tag with the same identification number. This assumption allows a reader to uniquely identify a tag, and know exactly which object is in range of the reader.
RFID-enabled crimes using the clone tag like: gaining entrance to facilities that are protected by proximity cards; making payments using SpeedPass tags; and even crimes typically associated with mainstream identity crime such as financial gain, people smuggling, drug trafficking, terrorism and money laundering.
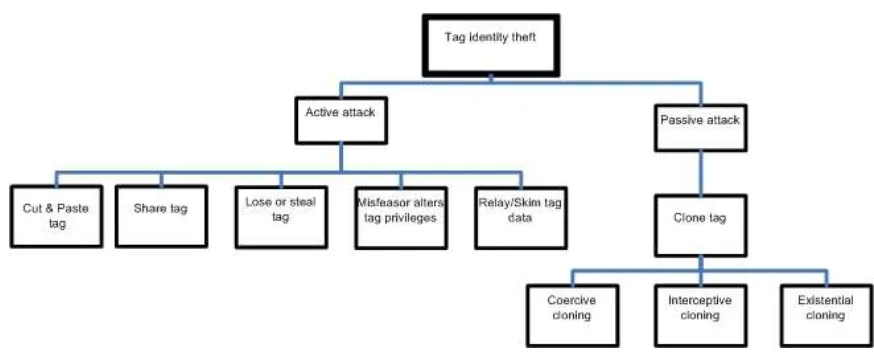
[image:12.595.123.560.293.471.2]In its most elementary form, an attacker only needs to know the identification number of a legitimate tag to clone it. Tag cloning is perhaps the most serious threat to the theft of tag identity, although there are several other potential threats that can be carried out by simply obtaining the identity of a tag, as illustrated in
Figure 1 - Tag identity threat model. These may be decomposed into two subgroups: active attacks and passive attacks.
Figure 1 - Tag identity threat model
2.2.1 Active attacks
Active attacks involve the real-time theft and replay of tag identity. Such attacks are limited in scope but have the same overall impact as most identity attacks. These attacks include when a tag is removed from an object and then attached to another object. For example, in order to pay less for a product in a supermarket an attacker may remove the tag from a bottle of wine, replacing it with a tag they obtained from a can of baked beans. Similarly, users may share their tags with other users; or tags may be lost or stolen. These attacks highlight the problem of assuming that a tag is permanently attached to a particular object.
would be possible for a nurse to change their tag’s privileges to grant themselves access to the medicine cabinet.
Kirschenbaum & Wool (2006) have demonstrated that an attacker does not even need to physically have possession of a tag to obtain its identity. Using a skimming device, a tag can be read from a distance of about 25cm without a user’s knowledge. Using this method an attacker could perform a relay attack which coerces a legitimate tag into revealing its identity, which is then re-presented back into the system by the attacker.
2.2.2 Passive attacks: Tag cloning
Passive attacks involve an attacker copying and storing a tag’s identity, and then replaying it at a later time. These types of attacks have greater scope than active attacks because they can be performed repeatedly over time. Tag cloning is one known example of a passive attack. In tag cloning, there are three ways in which an attacker can obtain the identity of a tag: coerce the tag into revealing it; intercept the communication channel between a tag and a reader; or simply guess a tags identification number. These methods are now discussed in greater detail.
Coercive cloning and interceptive cloning
Coercive tag cloning is when an attacker directly queries a tag for its identification number, whereas interceptive cloning is when an attacker intercepts the identity data that is flowing between a tag and reader. They both result in an attacker obtaining a copy of a tags identity.
Westhues (2005) has demonstrated that the Indala proximity card used by many organizations to control physical access to facilities is vulnerable to this sort of cloning attack. His research has demonstrated that with a budget of about USD $100, a cloning device can be built that is capable of obtaining a tag’s identification number and then replaying it back to the system.
Halamka et al. (2006) has demonstrated using a Prox Mark 2 cloning device that the human implantable VeriChip tag is vulnerable to tag cloning. The Prox Mark 2 can query a VeriChip, capture its response, and replay it back to the system. The Mexican government was relying on VeriChip tags to protect access to a secure records room to just eighteen of its workers (Albrecht & McIntyre 2005, p. 179). However such attacks now mean an attacker could clone a VeriChip tag and gain access to the facilities they are trying to protect.
Bono et al. (2005) has demonstrated that it is even possible to clone the cryptographically enabled Texas Instruments Digital Signal Transponder (DST). Although the tag itself is protected by a 40-bit secret cryptographic key, an attacker with modest resources can capture enough tag data in a short space of time to crack its encryption key, which then allows it to be cloned. Seven million of these tags are used in the Exxon-Mobil SpeedPass system worldwide. The researchers successfully cloned a SpeedPass tag and made purchases with it. Although there has not yet been a reported fraudulent purchase with a cloned SpeedPass device (see Appendix A – Communication with SpeedPass, USA), their research has shown just how easy it would be to make fraudulent purchases.
Existential tag cloning
Existential tag cloning, as defined by Halamka et al. (2006), is when the identity of a valid tag in a system can be guessed. In RFID systems that assign tag identification numbers sequentially, non-randomly, or using small number spaces, an attacker may simply guess a legitimate identification number which they can then replay back to the system.
2.2.3 Impact of tag cloning
Tag cloning not only enables RFID related crimes to occur; it has serious implications for the overall use of the technology. This section discusses the financial, security and consumer implications of tag cloning for RFID technology.
The financial impact of tag cloning to RFID technology may include the cost of defence and recovery. In attempting to defend against tag cloning, manufacturers may need to produce tags that can support anti-cloning measures. Such manufacturing additions may increase the cost of the tags. In addition, systems that already have tags present that are affected by tag cloning may need to be replaced with non-cloneable tags (if such tags were invented). The resulting upgrades would be costly, not only to the manufacturers but also to consumers. For example, if it had to replace the seven million SpeedPass tags, Exxon Mobil may need to pass the cost of new tags onto consumers.
The security impact of tag cloning may include the loss of confidentiality, integrity, and availability of the RFID system. For example, it may be possible for a clone tag to be the means by which attacker introduces an RFID virus like that proposed by Rieback, Crispo & Tanenbaum (2006). Such a virus could disrupt the entire underlying operations of the RFID technology.
Reported cases of tag cloning in the media may also impact the acceptance of RFID technology. When consumers hear that tags can be cloned or when business hears that the use of RFID may allow attackers to exploit their systems, the reputation of RFID may be tarnished. For example, a number of countries around the world including Germany, the United States, and Ireland have begun using RFID in passports. The United States passport uses a 64 Kb RFID chip (Martin 2006) to store a user’s personal information. Concerns about the security of these ePassports has been raised in recent examples where the German (Greene 2006)and Irish (Lettice 2006) passport chips have been cloned. Although some of these passports have added security to limit the threat, it would be easy to see how these news reports can be misunderstood by consumers and negatively influence their decision to use the technology.
forecast that in 2008, 6.8 billion tags will be sold for item level tagging and 15.3 billion tags for pallets (IDTechEx 2005). The threat of tag cloning is growing, and there need to be effective measures to defend against it.
2.3 Proposed solutions to tag cloning
Numerous solutions have been proposed in an attempt to defend against the threat of tag cloning. In Juels (2005b) review of RFID security solutions, it is evident most researchers have attempted to deal with the security problems by placing the security on or near the tag. Most of these solutions simply raise a fence around the tag. However the fence can only be raised as high as a tag’s capabilities dictate. As tag capabilities are minimal, the fence is also minimal.
The RFID industry’s desire to produce commercially affordable tags that cost around five cents has meant that the capability’s onboard the tag itself have been minimized (Sarma 2001). Some manufacturers already offer tags costing around five cents (Collins 2006), and as supporting increased security means an increase in production costs, this is not a priority.
Currently the power, storage, processing and gate resources that are available to low cost tags like the EPC tag are insufficient to support the necessary security like standard cryptographic functions (Weis et al. 2003, p. 204). The use of complex tag based security like cryptographic functions would require extra power for tags to make use of them. It may not be possible to provide passive tags with extra power because in the United States UHF regulations for frequency hopping, limits the time allowed for a tag-reader communication to 400 milliseconds. Also, readers may need to query tags less quickly if they are to participate in cryptographic exchanges. (Ranasinghe, Engels & Cole 2004)
At first thought, it makes sense to put the security on the tag. After all, it is the tag that is being targeted in a cloning attack. But with the limitations of tags in mind, it is hard to envisage a practical solution to the problem being invented in the near future. This thesis examines the possibility of defending against tag cloning at the reader or middleware components as these do not suffer from the constraints that make defending against cloning at the tag level so difficult.
spent on EPC readers and $0.75 billion for other types of readers (IDTechEx 2005). Therefore they could bear the cost of security. Also, as they are already positioned on the edge of RFID systems they could enforce security by permitting or denying a tag access to the system. It would be entirely feasible to extend their gatekeeper role to monitor the behaviour of tags to determine whether or not they are clones. Systems that perform this role for other devices are known as intrusion detection systems.
2.4 Principles of intrusion detection
‘Intrusion detection is the process of identifying and responding to malicious activity targeted at computing and networking resources’ (Amoroso 1999, p. 16). For example, when an attacker attempts to break into a computer network by repeatedly guessing a login password, may indicate that an attack is underway. Intrusion detection systems are like burglar alarms for computer systems; they monitor system activity in order to detect possible attacks and alert an administrator when an attack is detected. The activity of a subject (typically a human user) can include logging into a computer or accessing a file.
There are two intrusion detection paradigms: anomaly detection and signature detection. The successful detection of attacks is measured in terms of true positives, when a system alert detects a true attack, false positives, when they system incorrectly identifies activity as an intrusion, and false negatives, when the system fails to identify an attack. The hallmark of a good detection system is a high true positive rate, and low false positive and low false negative rate.
The advantage of anomaly detection is its ability to detect unknown attacks. As it learns what is normal in a system, anything that deviates from normal will be classified as anomalous. The disadvantage of this is typically a high false positive rate as subject behaviour is often open to sudden change, making the establishing of a “normal” profile difficult.
The second approach to intrusion detection, signature detection uses known attack descriptions to look for intrusions. When some activity occurs in the system, it checks the observed activity against a knowledge base of known attacks and triggers an alert if a match is found. Such intrusion detection systems are commonly used to detect computer viruses. A virus exhibits code that is quite distinct from legitimate code on the computer system, which makes it readily identifiable.
The advantage of signature detection is its low false positive rate, as the system has a clear understanding of what constitutes an intrusion. The disadvantage of this is when an intrusion differs from a signature; the intrusion goes undetected as the system does not recognize it. To achieve adequate performance the signatures in the knowledge base also need to be constantly kept up to date.
To actually process system activity to look for intrusions, a detection system needs to be fed data that represents the subject’s activity. Audit log files are one way of feeding data into a detection system. An audit log is a record of events that have occurred on a host or network. The variables that are recorded about an event may include: date/time of event, identification of the subject initiating the event, and identification of the object that subject is acting upon (Amoroso 1999, p. 41). The variability or number of variables that are recorded will determine how well the system can make a decision on what constitutes an intrusion. This is particularly relevant to RFID systems as the amount of data available is very limited.
The intrusions that can be detected will depend on where the audit data was captured, with the major differences being between data collected at a host or from a network channel. Host based systems can detect attacks that are targeted at that specific host; whereas network based systems can detect more attacks happening throughout the network.
inserted into the audit log, it can respond to intrusions quickly and may in fact prevent them from occurring. However, if updates only occur periodically, then the intrusion has probably already been successfully carried out before it has been detected. This trade-off between timeliness and response is ultimately determined by the systems capacity to perform the processing. (Amoroso 1999, pp. 51-2)
A key consideration in processing an audit log is how much of the audit log to use. In anomaly detection the age of the data will determine how accurate profiles derived using it will be. Although the audit log may span several months or years of observations, the behaviour of users will change over time. To overcome this problem, Hossain, Bridges & Vaughn (2003) used a sliding window approach to retrieve only the most recent audit records. The window filters out those audit records that are too old to be useful.
When an intrusion has been detected, the system may respond in any number of ways. A response can range from simply alerting an administrator of the intrusion to shutting down the offending user account or network session. The response is generally in proportion to the level of risk the threat poses. For example, a failed number of login attempts may result in the suspect account being suspended for 30 minutes.
A large proportion of the principles of intrusion detection have been exhibited in the IDES (Intrusion Detection Expert System) model, first proposed by Denning (1987). Since then, it has been used as the basis of many intrusion detection systems and the one developed for this thesis will also follow it. A brief overview of how IDES operates follows.
IDES is general purpose statistical anomaly detection system that monitors a system’s audit records to look for abnormal patterns of usage. It observes the standard operations that occur within a target system to detect intrusions, such as logins or file accesses. Observations of subject behaviour that significantly deviate from past observations are regarded as intrusions.
the profile to model the user’s log in behaviour which is stored in associated login profile.
A profile characterizes what “normal” behaviour is, using both a metric and a statistical model. The metric stores the value of the current observation and the model measures what occurred in the past. For example, the number of times a user logs into a computer today is stored in the metric, and the number of times on average they logged into the computer in the past are calculated by the model. The metric is classified as abnormal when it is significantly different from the value calculated by the model. The IDES model used the standard deviation and mean model to achieve this.
The standard deviation denotes a confidence interval that is a measure of how far away from the mean a new observation is allowed to be. The system compares a new observation to the threshold that was produced by the model. It then classifies the new observation as either normal, in that it fits the profile, or alternatively as abnormal, in which case it is regarded as an intrusion.
The IDES model proposed a “Location Frequency” profile to measure the number of times a subject logs into a system at different locations. The profile may be useful in detecting attackers that log in from locations that legitimate subjects never use.
Scenario: Proximity card cloning
Alice is a university lecturer that has a proximity card to grant her access to the School of Computing 24-hours a day. She likes to start work early, typically using her proximity card at reader one, between 8:00am and 8.30am during week days to unlock the building’s door. Alice likes to leave work at about 5.00 pm so she can get home in time for her favourite television program, in which case she again needs to pass by reader one to unlock the door.
Mallory, a technically savvy undergraduate student wants to access the computer laboratories during the evenings so he can download pirated music off the internet. Unfortunately, being an undergraduate he is only allowed to use the laboratories during normal office hours. However this is inconvenient for Mallory’s downloading, as it may be noticed by other users. He therefore decides to clone Alice’s proximity card so he can have 24-hour access to the building and come in when nobody else is around.
With the principles of intrusion detection in mind, an RFID based intrusion detection system similar in operation to the IDES model, could develop profiles to model the behaviour of Alice’s card. One such profile may characterize the expected behaviour of Alice’s card’s usage by examining the time of day when it is used.
When Alice’s card is used, a reader would create an audit record that detailed the usage. These audit records would be then used to update the profile. Over time the system would develop a model of Alice’s behaviour, of when she most often uses her card at what particular time of the day.
perhaps by terminating its access rights, hence preventing Mallory from committing any crime.
3 Methodology
The aim of this thesis is to determine whether it is feasible to detect clone Radio Frequency Identification (RFID) tags using the principles of intrusion detection. Detection may be seen as the first step in defending against clone tags and preventing RFID-enabled crime from occurring. It is important to note that intrusion detection has never been applied to RFID systems before.
In order to evaluate the hypothesis, the principles of intrusion detection have been applied in a statistical anomaly detection system. The detection system, called Deckard, was built using the Java programming language. It processes RFID audit log data to look for audit records that a clone tag may have generated. Its design and operation is similar to the detection model, IDES, first proposed by Denning (1987).
The overall feasibility of the system was evaluated by determining its ability to detect attacks (audit records that relate to a clone tag) in an audit log. This was done in three phases; the success of phase one and two would determine whether or not it was feasible, in phase three, to investigate the overall attack detection rate.
The name Deckard is a reference to the character played by Harrison Ford in the 1982 Ridley Scott movie Blade Runner. In the movie, Deckard is a special member of the Los Angeles police department who is employed to hunt down and retire Replicants; genetically manufactured humanoids (Wikipedia 2006). This is almost analogous to an intrusion detection system detecting clones - in this case clone RFID tags.
3.1 Description of data set
The data set which was used to develop and test the system was provided by the School of Computing (Launceston) in the University of Tasmania (UTAS). It consisted of four sanitized audit logs from their proximity card physical access control system. Briefly, the School of Computing proximity card system controls access to different parts of the computing building. Users of this RFID system are students and staff who have 24-hour access to different parts of the building. There are four readers that control access in the building, and a user must swipe their card within 2 inches of a reader to unlock the door.
replacing the original tag numbers with pseudonym numbers. It was still possible to observe that these pseudonyms belonged most probably to students or staff because of the reader at which they appeared. However, it was not possible to know the true tag number, and hence the identity of the particular user of any tag.
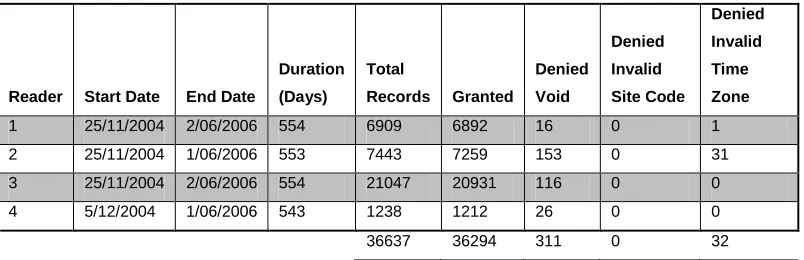
Reader Start Date End Date
Duration (Days)
Total
Records Granted
Denied Void
Denied Invalid Site Code
Denied Invalid Time Zone
1 25/11/2004 2/06/2006 554 6909 6892 16 0 1 2 25/11/2004 1/06/2006 553 7443 7259 153 0 31 3 25/11/2004 2/06/2006 554 21047 20931 116 0 0
4 5/12/2004 1/06/2006 543 1238 1212 26 0 0
[image:24.595.128.530.174.304.2]36637 36294 311 0 32
Table 1 - Proximity card data
It can be seen in Table 1 - Proximity card data, that there were 36,637 audit records in total that were generated from 25/11/2004 to 02/06/2006. The audit records detailed the activity of each user’s proximity card. Sometimes access was granted to the card, and in some cases, access was denied. Deckard was designed to only work with those audit records where access had been “granted,” of which there were 36,294.
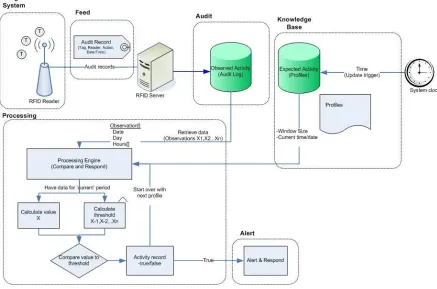
3.2 System architecture and operation
In its physical form, Deckard is a software program that is situated on a central computer that interconnects all of the readers in an RFID system. It may be regarded as a host based anomaly detection system for RFID because it processes audit log data that has been generated from activity occurring at a several readers. It uses the standard deviation and mean model to develop profiles of tag behaviour which it then uses to look for clone tag behaviour.
Firstly, intrusion detection has not previously been used in RFID therefore the model proposed by Denning (1987) is a worthwhile starting point as it was designed to be general purpose and useable in any environment. If the approach proves successful then it would be worthwhile exploring other techniques.
Secondly, the RFID environment and the data that it produces are quite different from typical intrusion detection domains, which means a specialized RFID detection system needed to be designed. An important consideration is the number of variables that are available. There are numerous intrusion detection systems that operate on TCP/IP networks, as detailed by Axelsson (2000, pp. 15-23), which typically use data that contains a large number of variables. In stark contrast, elementary RFID systems like the School of Computing proximity card system have a limited number of variables namely: tag number, reader number, action/operation, date, time. Therefore the intrusion detection system that would work in RFID needs to capable of making a classification decision with only a few variables. It is also therefore worthwhile beginning with a simple classification approach such as that provided by standard deviation and mean.
Figure 2 - Architecture of Deckard
3.2.1 Target system
The target system which Deckard has been designed to operate in may be any typical RFID system that has assets worth protecting from RFID-enabled crime. For example, in a proximity card system, it is worth protecting facilities from being accessed by attackers.
Deckard assumes that the target system is capable of producing data that summarizes the activity of its tags. This means that the system can record the details of when a tag is queried into an audit log for processing. Also, every tag and reader should be identifiable. This way it is possible to identify which tag generated an audit record and the reader at which it was generated.
The performance of Deckard will ultimately be determined by the behaviour of the tags. In this thesis Deckard has been applied to a human based RFID system, and it should be noted that configuration and results that are produced may differ completely from those produced in, for example, a static supply chain environment.
3.2.2 Feed
reader has queried a tag. A reader is responsible for recording the outcome of a RFID read/write operation to an audit record.
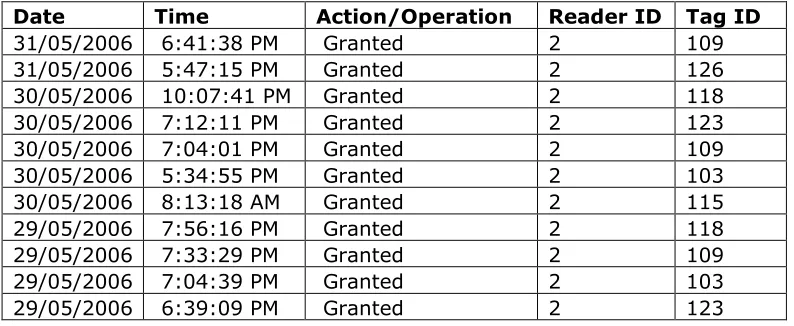
An audit record captures the essential details of an RFID operation as follows: <tag number, reader number, RFID action/operation, date, time>. The possible contents of these fields are visible in Table 2 - Reader two audit log extract. It is necessary to ensure that if readers are to be responsible for generating audit records, then they need to share a consistent system clock that way that can maintain an accurate view of the world. This enables the correlation of the activity of tags between readers.
3.2.3 Audit log
[image:27.595.132.532.451.614.2] [image:27.595.136.533.452.615.2]The system maintains an audit log file for each incoming reader feed on the computer that is running Deckard. In the current design, an audit log is simply a flat text file that contains audit records that are ordered sequentially by date and time. As each audit record is generated, it is inserted onto the end of the audit log.
Table 2 - Reader two audit log extract, illustrates the structure of the audit log and each individual audit record obtained from the UTAS audit logs. Looking at this it can be seen that the system has to work with only the five variables contained in it.
Date Time Action/Operation Reader ID Tag ID
31/05/2006 6:41:38 PM Granted 2 109 31/05/2006 5:47:15 PM Granted 2 126 30/05/2006 10:07:41 PM Granted 2 118 30/05/2006 7:12:11 PM Granted 2 123 30/05/2006 7:04:01 PM Granted 2 109 30/05/2006 5:34:55 PM Granted 2 103 30/05/2006 8:13:18 AM Granted 2 115 29/05/2006 7:56:16 PM Granted 2 118 29/05/2006 7:33:29 PM Granted 2 109 29/05/2006 7:04:39 PM Granted 2 103 29/05/2006 6:39:09 PM Granted 2 123
Table 2 - Reader two audit log extract
It was decided to maintain the audit logs on a central computer (in this case it was the computer running Deckard) as this would make it easier for the system to access the data. In the real world, it would also allow the system to more easily protect the log from attempted access from attackers that wanted to cover up their attacks.
3.2.4 Knowledge base
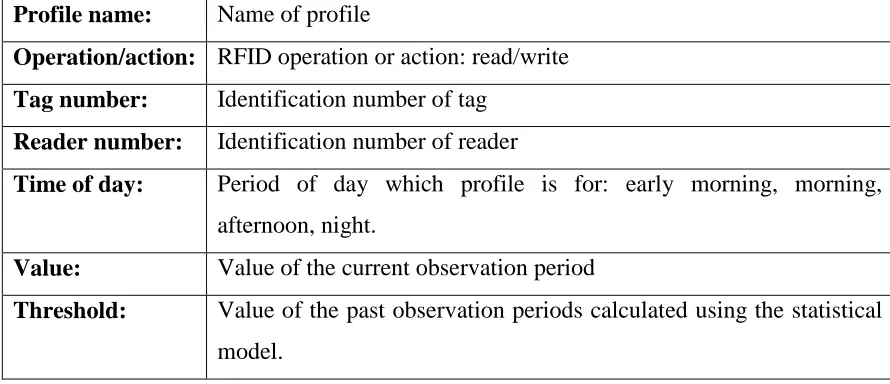
Deckard models the behaviour of each tag in the form of a profile. The profile describes the expected behaviour of a tag based on past observations that have been captured in the associated audit records. A profile follows a generic structure that has been adapted from Denning (1987). It is illustrated in Table 3 - Structure of a tag profile.
Profile name: Name of profile
Operation/action: RFID operation or action: read/write
Tag number: Identification number of tag
Reader number: Identification number of reader
Time of day: Period of day which profile is for: early morning, morning, afternoon, night.
Value: Value of the current observation period
[image:28.595.121.566.329.521.2]Threshold: Value of the past observation periods calculated using the statistical model.
Table 3 - Structure of a tag profile
A profile exists for every association between a tag and reader. This can be modelled as follows: <Tag + Reader + Operation + Time of Day>. For example, a profile would exist for: <tag 351 + reader 2 + “read” + “morning”>. This would characterize the behaviour of tag 351 at reader 2 for the RFID “read” operation in the “morning” period.
day. For example, in the UTAS proximity card system, the behaviour of tags would be different in the mornings when compared to the nights because most students come into the building to work during the day.
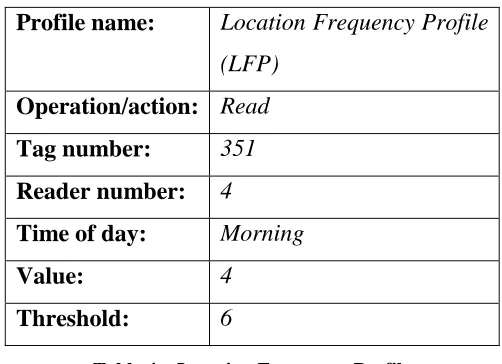
The system was designed and tested using a single profile; the “Location Frequency Profile” (LFP) that counts the number of times a tag has been used at a reader. Based on the information in section 2.4, it was decided that examining the usage frequency (how often) of a tag at a reader would be a sufficient indicator of whether or not it is a clone.
When an update occurs, the LFP calculates how many times a tag has been used in the current observation period and stores this in its value field. It uses the standard deviation and mean model to calculate a threshold which is the maximum number of times the tag could realistically be used based on past observations. An example of what the LFP for a tag looks like is given in Table 4 – Location Frequency Profile.
Profile name: Location Frequency Profile (LFP)
Operation/action: Read
Tag number: 351
Reader number: 4
Time of day: Morning
Value: 4
[image:29.595.207.458.379.561.2]Threshold: 6
Table 4 – Location Frequency Profile
3.2.5 Processing
In order to look for possible intrusions (clone tags), Deckard updates each profile every 24-hours. When an update occurs, it firstly retrieves all of the data that relates to that profile, it then calculates the value and threshold fields, and checks to see if the value field exceeds the threshold field. If the value does exceed the threshold, the observation is classified as an anomaly, that is, some audit records in the update relate to a clone tag, and an alert is triggered.
Amoroso (1999, p. 51) outlines a significant disadvantage of processing audit logs periodically: that the system cannot respond to attacks that are currently underway. However it was decided that Deckard should in fact update its profiles periodically for several reasons. Firstly, periodic updates would reduce the burden on the detection system’s processing engine. If for example, an RFID system is producing a large number of audit records for every query a reader performs on a tag, triggered updates would mean the processing engine would update after every audit record had been generated - which is a lot of processing.
Secondly, the concept of a session in RFID is not definable. That is, a tag and reader may undergo several read or write operations before a session is actually complete. Updating periodically ignores the difficulty in determining the start and end of a session.
3.2.5.1 Retrieve data
When an update occurs the first step is that the processing engine retrieves each profile in turn along with its data from the associated audit log. The data in the form of audit records represents the activity at a particular reader. For example, when updating reader two’s morning profile for tag number 351, the entire audit records relating to this profile would be retrieved from reader two’s audit log.
window to determine how much of this data should be used to get an accurate description of a tag’s current behaviour.
Deckard allows the window to be specified in terms of a percentage of the audit log size. For example, a window of 25% will retrieve the last 25% of audit log records if they are available.
The windowing approach has been used in Deckard for several reasons. Firstly, it does not discriminate audit records based on age. This would therefore be useful in systems that exhibited sporadic tag usage. For example, the distribution of audit records in an audit log would fluctuate according to seasonal factors like when a user was scheduled to work, or when university lectures were held.
The disadvantage of the windowing approach used by Deckard is that it simply does not consider the age of an audit record. If an audit record, for example, was generated one year ago, the window may actually catch that record in the retrieval process. The age of audit records will determine the accuracy of classifying a tag’s normal behaviour. It is common knowledge that over time humans change their behaviour, so old audit records may be completely irrelevant in describing how a tag is currently being used.
3.2.5.2 Statistical model to compute value and threshold
The second step the system undertakes after each profile and its associated data has been retrieved, is to calculate using the standard deviation and mean model, the new value and threshold fields. As proposed by Denning (1987) the standard deviation and mean statistics are applicable to event counters that have been accumulated over a fixed time period, such as the event counter the LFP uses to count the number of times a tag has been used.
Using the LFP as an example, the system computes the value and threshold as follows:
Date Number of audit records (number
of times tag has been used)
10/02/2005 2 11/02/2005 3 12/02/2005 5 13/02/2005 4
[image:32.595.197.469.71.220.2]14/02/2005 3 (current observation/update period)
Figure 3 – Hypothetical tag usage for tag 351 in audit log
To calculate the value field:
1. Count the number of audit records that exist in the current observation. That is, the number of audit records for the current update period.
• For the current update period (14/02/2005), tag 351 has been used 3 times.
2. Store this count in the value field of the LFP.
To calculate the threshold field:
1. Count the number of audit records that exist for each past observation for the profile.
2. Calculate the population mean and population standard deviation on these values.
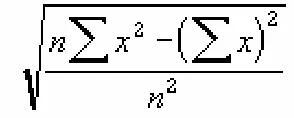
• The past observations are all of those dates before the current update period (14/02/2005). The code calculates the standard deviation on the entire population. It uses the same algorithm that Microsoft Excel uses which is illustrated in Figure 4 - Microsoft Excel STDEVP. And its accuracy was validated using Microsoft Excel STDEVP function.
[image:32.595.258.405.640.699.2]3. Using the administrator DFM (number of deviations from mean) value, determine the maximum number of times that a tag may be used for the current observation (the maximum possible value).
The standard deviation of an entire population (denoted by symbol σ)
represents the typical distance from any point in the data set to the centre value which is the mean value. Calculating the standard deviation, measures the distribution of the values (Rumsey 2003, p. 106).
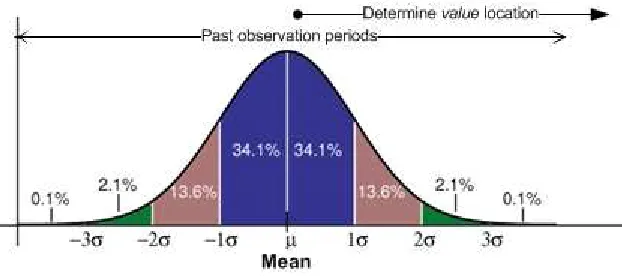
If the data is normally distributed, or has a bell shape, it is possible to use the Empirical rule to describe the distribution of the data set. The Empirical rule states that 68% of the values are one deviation away from the mean (σ1
or ± 1 deviation), 95% of values are two deviations from the mean (σ2 or ±2
deviations), and 99.7% of values are three deviations from the mean (σ3 or
±3 deviations). (Rumsey 2003, p. 148). Testing to see if the data was indeed normally distributed was undertaken in section 3.3.1.
The DFM is used by the profile to calculate the distance that the value field can be away from the mean in both directions (lower and upper, or ±). It has three possible values: σ1, σ2, σ3. Using a DFM of σ1, tells the system
that the value field can be no more than one standard deviation away from the mean that was calculated on the past observations. Whereas a DFM of σ3,
Figure 5 – DFM confidence interval
Using tag 351 as an example let the DFM equal σ2. The value field
would equal 3 for the current update that was carried out on 14/02/2005. The population mean of past observations would equal 3.5, and population standard deviation of past observations would equal 1.12. The threshold would be calculated to be 5.74, which is the value at 2 deviations from mean. Thus, the value (3) would be classified as normal because it is under the threshold (5.74).
3.2.5.3 Compare value to threshold
When the value and threshold have been calculated, Deckard simply uses an if-then statement to determine whether the value exceeds the threshold: “If the threshold is exceeded then trigger an alert.”
3.2.6 Alerts
An alert has been modelled in the system in form of an activity record. Activity records encapsulate the outcome of an update. An activity record is set to true when an alert is triggered by the statistical model.
3.3 Testing
To determine the system’s feasibility the system was tested in three phases using the Location Frequency Profile (LFP) for the morning period. Phase One was to determine the distribution of the data which would indicate if the system was using the correct number of DFM. Phase Two was to determine whether the system could model the behaviour of each tag without any attacks present. And, the key in determining the validity of the hypothesis, Phase Three was to determine whether the system could establish profiles of normal tag behaviour and then use these to detect clone attacks.
3.3.1 Phase one: initial validation
The aim of phase one was to determine if the data was normally distributed. The outcome of this would indicate whether the system is correct in using the Empirical rule and thus using only three DFM values of σ1, σ2, σ3. If this was not the case, the
system would need to use Chebysev’s Inequality theorem and thus more than three DFM values. Testing for this phase was undertaken on a subset of the UTAS audit logs using Microsoft Excel in the following manner:
For each tag in the test set:
1. Count the number of times it had been used on each date.
2. Calculate the population mean and population standard deviation of these values. The standard deviation formula used was STDEVP.
3. Using a chart of standard normal distribution determine where the values fall within the chart.
4. Verify that standard normal distribution exists by calculating the percentages of the values that occur at σ1, σ2, and σ3 from the mean.
3.3.2 Phase two: performance of classifying behaviour
actually be modelled. The ability to model a subject’s behaviour is an underlying requirement of anomaly detection as discussed in section 2.4.
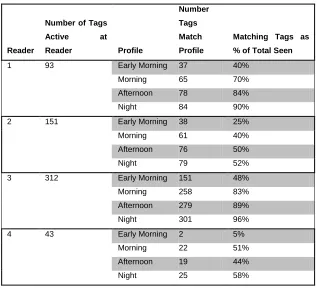
The tests in this phase were undertaken using the LFP (see 3.2.4) for the morning period for all readers, using all data that had been “granted”. Logically the data for this would act as the data feed (see Figure 2 - Architecture of Deckard) for Deckard. It can be seen in Table 5 - Tag activity at each reader, how many tags would be involved in this phase by examining the “morning” rows.
Reader
Number of Tags Active at
Reader Profile
Number Tags Match Profile
Matching Tags as % of Total Seen
1 93 Early Morning 37 40%
Morning 65 70%
Afternoon 78 84%
Night 84 90%
2 151 Early Morning 38 25%
Morning 61 40%
Afternoon 76 50%
Night 79 52%
3 312 Early Morning 151 48%
Morning 258 83%
Afternoon 279 89%
Night 301 96%
4 43 Early Morning 2 5%
Morning 22 51%
Afternoon 19 44%
[image:36.595.175.492.234.522.2]Night 25 58%
Table 5 - Tag activity at each reader
The ability of Deckard to model tag behaviour may be seen as a classification problem. Given an audit record, the system needs to classify it as either normal or anomalous. The performance of a classifier is typically measured in terms of its error rate: in Deckard this is the number of times it classifies an audit record as being anomalous when in fact it is normal.
executed a total of ten times, on different training sets to yield an overall error estimate known as the true error rate. (Witten & Frank 2000, p. 126)
It was decided that ten fold cross validation (with no stratification) would be undertaken for each DFM setting (σ1, σ2, σ3) as these would each produce different
optimum window’s and true error rate’s. This would indicate how the true error rate and optimum window were influenced by the DFM (or strictness of the system).
Prior to testing it was predicted that as the DFM increased (the system becomes less strict), the true error rate would decrease. The window was initially set at four fixed values (25%, 50%, 75%, 100%) with the aim of finding an overall window that would represent the optimum look back period for all tag profiles.
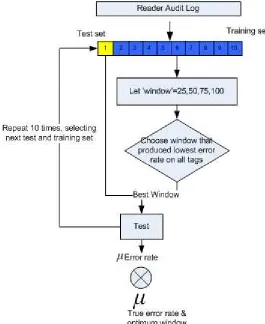
Ten fold cross validation was undertaken as follows:
1. Partition the audit log into ten partitions of approximately the same number of audit records in each.
2. Using the LFP: Hold out the first partition, called the test set, and determine the window that produced that lowest classification error using the remaining nine partitions, called the training set.
3. After determining the window that produced the lowest error rate on the training set, use it to determine the error rate of the test set.
Figure 6 - Audit log 10 fold cross validation
The pseudo code for the algorithm that was used to perform the validation process is illustrated in Figure 7 - Validation algorithm.
For each threshold (s1, s2, s3) {
-For each window w=25, 50, 75, 100; -For each training and test set combination; For window (w){
For each tag profile (training set) { Error RateUpdate profile (w); }
}
Optimum wWindow that produced lowest error rate for tag;
For each tag profile (test set) {
Error RateUpdate profile (optimum w); }
Average window & average error rate; }
[image:38.595.121.544.488.724.2]3.3.2.1 Limitations on the method
There are several known limitations on the method that may have affected the accuracy of the true error rate estimate.
Stratification of the data was not undertaken even though Witten & Frank (2000, p. 127) believe that stratification improves results slightly, it was not performed on the audit logs because the data is time series dependant. So changing the ordering of the audit records would have changed the semantics of the data.
The partitioning of the audit log may have overrepresented some tags audit records in the partitions. The potential issues that this may have caused have most likely been minimized however, using the standard partition size of ten. In addition, the cross validation of the datasets ensures that eventually all data is used in the testing and training phases (Gutierrez-Osuna, p. 7).
The audit log data that Deckard was tested on had been sanitized prior to it being made available for its use in this research. In order to preserve the privacy of individual users, the sanitization process changed every tag number with a pseudonym that was in no way related to the original tag number. Mell et al. (2003, p. 15) believes that sanitization may remove the content of the background activity and produce an unrealistic representation of the environment. However this is not believed to be an issue for these audit logs as the underlying association between tag identity and audit records was preserved.
There was also the potential for attacks to be present in the audit log without the systems knowledge. Without any way of verifying this, the system assumes that no attacks are present. In addition, the presence of pre-existing attacks may have been minimized as testing in this phase was repeated a number of times on a large sample size.
3.3.3 Phase three: performance at detecting attacks
The aim of phase three was to determine the systems ability to actually detect clone tags in an audit log. This would be the overall indicator in determining the feasibility of this intrusion detection system. The question that needed to be answered was: how different does attack behaviour need to be for it to be detectable?
An attack is represented in an audit log as an audit record representing when a clone tag has been used. This phase involved inserting a number of attack audit records throughout the UTAS audit log for reader four, and seeing if Deckard could identify these attacks from the normal records.
It can be seen that there would be 22 tags involved in this phase. In actual fact, this number was reduced to 11 tags because some tags did not have enough data to adequately represent the problem of tag cloning. For example, tags with less than four observations were discarded because inserting attacks at three points in the audit log (as this phase was about to do) would not work out fairly.
The testing for phase three was undertaken by first inserting attacks into the data. The data was then fed into Deckard, which went about updating the LFP; classifying the audit records as either normal or as anomalous. After the profile had been updated, the system checked to see if the data that was used in an update contained an attack record.
A confusion matrix recorded the outcome of each profile’s updates. It contained information about the system’s ability to make correct classifications and incorrect classification. True positives and true negatives are correct classifications when the system correctly classifies an observation as containing an attack or not containing an attack. The false positives and false negatives are classifications when the system misclassifies an observation as either containing an attack, when in fact it does not, or when it fails to detect the presence of an attack.
Figure 8 - Detecting attacks, shows the algorithm that the processing engine of the system used to determine if a classification was true or false. The system increments one of four counters each time a profile is updated to record the outcome of an update: the true positive counter is incremented when an attack is correctly detected; the false positive counter is incremented when an attack incorrectly detected; the false negative counter is incremented when an attack is missed; and the true negative counter is incremented when no attack is detected in an update that did not contain attacks.
If (value > threshold) {
++alerts;
if (alertsInPeriod > 0){ ++TruePostives; }
else{
++FalsePositives; }
else{
if (alertsInPeriod > 0){ ++FalseNegatives; }
else{
++TrueNegatives; }
}
Figure 8 - Detecting attacks
The values in the resulting confusion matrices could then be used to produce the detection rates. They allow the system to evaluate the classification in relation to the other values in the confusion matrix and are a better indicator then simply examining the individual values. The formulas of how they would be calculated were obtained from Kohavi & Provost (1998, p. 272):
Figure 9 - True positive rate
• The proportion of positive cases that were correctly identified. True Positive Rate =
Figure 10 - False positive rate
• The proportion of negative cases that were incorrectly classified as positive.
Figure 11 - Precision
• The proportion of the predicted positive cases that was correct.
3.3.3.1 Synthesizing attack data in the audit log
[image:42.595.135.538.585.708.2]As this phase was detecting the systems ability to detect attacks, it was necessary to insert some attacks into the data set. Attack audit records were inserted into the audit log in two of the ways that could represent the scenario in section 2.4. Firstly, an attacker could use a clone tag a number of times in a time period; this was labelled the attack intensity. For example, an attacker uses a clone tag three times in one morning on a particular date. Secondly, an attacker could use a clone tag several times over a sustained time period; this was labelled the attacked frequency. For example, an attacker uses a clone tag every two weeks. Figure 12 - Synthesizing attacks in audit log, illustrates how attacks were inserted.
Figure 12 - Synthesizing attacks in audit log
False Positive Rate =
True Negatives + False Positives False Positives
Precision =
It was hoped that elevating the frequency and intensity of the number of attacks would provide the answer to the question of how different attack behaviour needs to be from normal behaviour in order for it to be detected by Deckard.
Attack data for each tag was inserted as follows:
1. The audit records for each tag were extracted from the audit log and counted. 2. Three positions in the data were identified at locations 25%, 50%, 75% of the number of records in the audit log. For example, if the audit contained 100 records, then location 25% would be at record 25 of the log.
3. The audit record at this point that was present was copied and then reinserted into the same position n number of times based on the attack intensity setting. 4. This was repeated at locations 50% and 75%.
5. Then the process was restarted, at the next intensity level.
For example, the program initialized with a frequency of 25% and an intensity of one attack. This means that the audit log for each tag had a one attack audit record inserted into it at 25% of the data. The system would then update all its profiles in an attempt to detect this single attack and the results recorded into a confusion matrix. Then, the intensity was increased to two and process repeated up to an intensity of three.
At this point, intensity was reset to one attack, but the frequency of attacks was increased to two. This means attacks were now being inserted at two locations in the audit log - 25% and 50%. The process of increasing the attack intensity was repeated, until finally, attacks had been inserted at the three frequency locations (25%, 50%, and 75%).
3.3.3.2 Limitations on the method
There are several known limitations on the method that may have affected the results in the confusion matrices.
distinguishing attack records from legitimate audit records. The only way that this could be evaluated would be to compare the performance of the system using an audit log that did have “real” attacks in it. However this was not possible because such an audit log was not available.
The statistical model that has been used to model behaviour in the system is influenced by the attack audit records. The system does not remove those audit records that were classified as anomalous, therefore they go onto be used in the future classification of audit records. It was decided that discarding these audit records would not be suitable for this implementation because of the underlying true error rate that was determined in section 3.3. That is, discarding data may result in legitimate data or normal behaviour being removed from the audit log. On the other hand, it may be argued that in keeping those records that did not produce an alert may in fact be anomalous, as there are times when the system will fail to detect attacks.
Another limitation on the system may be that in some way it is predisposed to trigger alerts coincidently where attack records have been inserted in the audit log. It was demonstrated in section 3.3, that there is a degree of error already present in the classification of tag behaviour. Thus it may be possible that attacks have been inserted into those erroneous periods where alerts are already occurring. It would be possible to verify this by recording the locations in section 3.3 that triggered alerts and comparing them to the locations that triggered alerts in this phase. However in the real world this is hardly feasible. Therefore it was decided that the best way to overcome this would be to simply insert attacks at more than one location in the audit log to reduce this possibility.
4 Results and Discussion
The following chapter examines the results that were produced during the three testing phases (see 3.3) to determine the feasibility of using the principles of intrusion detection to detect clone RFID tags.
As is most often the case, as one setting in an intrusion detection system is changed, the results that the system produces will vary. Therefore Pearson’s correlation coefficient has been used throughout the results to indicate the association between different variables. More information on the theory behind Pearson’s correlation coefficient can be obtained from Jaisingh (2000).
4.1 Phase one results
The outcome of visual inspection of the standard deviation chart for those tags that were tested indicated that the data is normally distributed. Table 6 – Standard deviation results for tag 351, illustrates the distribution of values for tag 351. It can be seen that by three deviations from the mean (σ3), all of the data has been
described.
Deviations from Mean % of values at deviation
σ1 86%
σ2 88%
[image:45.595.204.465.426.514.2]σ3 100%
Table 6 – Standard deviation results for tag 351
These results correspond to the results one would expect if the data was indeed normally distributed. The results indicated that the data is indeed normally distributed, which means that Deckard is able to validly use the Empirical rule to generalize the data and it is therefore sufficient to use three DFM settings. Had this not been the case, the system would need to use Chebysev’s Inequality theorem and thus more than three DFM settings.