A structural examination of the Telfer gold-copper deposit and surrounding region, northwest Western Australia: the role of polyphase orogenic deformation in ore-deposit development and implications for exploration
227
0
0
Full text
(2) A Structural Examination of the Telfer Gold-Copper Deposit and Surrounding Region, northwest Western Australia: The Role of Polyphase Orogenic Deformation in Ore-deposit Development and Implications for Exploration.. VOLUME 2. Thesis submitted by Simon Andrew John HEWSON BSc (Hons) (Curtin) in October, 1996. for the degree of Doctor of Philosophy in the Department of Earth Sciences at James Cook University of North Queensland..
(3) CONTENTS of VOLUME 2. SECTION A. .................... Figures. SECTION B. .................... Figures. SECTION C. .................... Figures. SECTION D. .................... Figures. SECTION E. .................... Figures. APPENDICES. APPENDIX 1 - Stereographic data for Section A APPENDIX 2 - Location descriptions, field diagrams and stereo graphic data for Section B. APPENDIX 3 - Sample catalogue (referred specimens)..
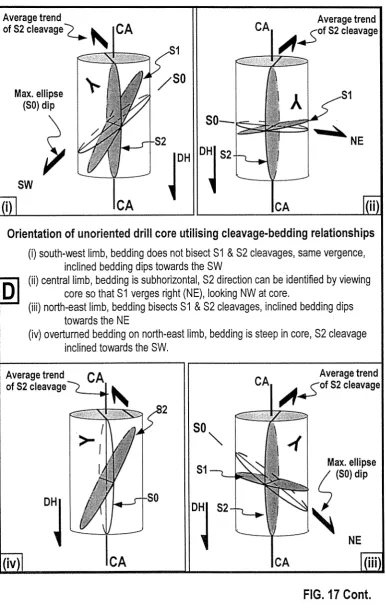
(4) CONTENTS of MAP CASE MAPS MAP 1. - Structural Geology of the Telfer Mine (1:7,500). MAP 2. - Structural Geology of the Telfer region (1:100,000). MAP 2B - Structural Geology of the O'Callaghans Corridor (1:50,000). EN CLOSURES: Laminated full A4 size versions of figures that are regularly referred to in the text (e.g. deformation chronology tables, regional maps etc.) are also enclosed in the Map Case. A number of regularly referred to figures are also enclosed in the Map Case. These have been included for the reader to hold/place in front of themselves so as to negate the need to search backwards through the Figure volume for reference to these figures.. EN CLOSURE 1 - Summary Table of the Deformation History in the Telfer Region ( For use with Sections A, C, D & E).. EN CLOSURE 2 - Geology of the Rudall Metamorphic Complex and Lower Yeneena Group, Paterson Province, and field locations. (For use with Section B).. EN CLOSURE 3 - Stratigraphic Distribution of Stratabound Mineralised Reefs in the Telfer Dome. (For use with Sections C & D).. ENCLOSURE 4 - Structural Geology of the Telfer DomelMine.. (For use. with Section D).. EN CLOSURE 5 - Regional Geological Map of the Telfer District (For use with Section E, and Section A).. TWO GENERAL USE ENCLOSURES: 1. Orientation of Unoriented Drill Core Utilising CleavageBedding Relationships.. 2. Conceptual Exploration Models for the Telfer Region/Paterson Province - schematic flow chart..
(5) SECTION A. Multiple Orthogonal Overprinting Deformation Events in the Telfer Region, W.A.: Preservation of a Complex Tectonic History in Weakly Deformed Rocks.. (FIGURES).
(6) Figures - Section A. Figure 1: Simplified geological map of the Paterson Province, northwest Western. Australia. This province, located at the SW margin of the Paterson Orogen, comprises two major litho-tectonic units; the early to middle Proterozoic Rudall Metamorphic Complex and the middle to late-Proterozoic Yeneena Basin that unconformably overlies it. The province is surrounded by various Archean (Pilbara Craton), Proterozoic (Savory, Bangemall and Karara Basins) and Phanerozoic (Officer Basin) rock units. The Yeneena Basin is divided into three geographic divisions (Williams, 1990a). The study area (outlined) comprised rocks of the North-western Zone surrounding the Telfer deposit, and immediately adjacent (SW side) to the Karakutikati Range. (Redrawn from fig. 3-67 - Williams, 1990a)..
(7) 121'30'. 21' WESTERN AUSTRALIA PILBARA CRATON. 22'. CANNING BASIN. 23' --'-- Thrust. V77l Karara Formation SAVORY k:::"LL.I BASI N OFFICER BASIN. YENEENA GROUP Northeastern Zone Central Zone. 24'. Western Zone. f"'~"'~"'] Rudall Metamorphic Complex ... ...... (gneiss, granitoid, schist). 50Km. 123'.
(8) Figures - Section A. Figure 2: Photograph of centimetre-scale monoclinal D1 folding within an interbedded siltstone unit in the Telfer Gold Mine. The hinge and NE dipping short limb are thickened relative to the SW dipping long limbs, which are attenuated. A coarsely spaced cleavage, S 1, is axial plane to the fold and preferentially developed in siltstone laminae. The photograph is looking NW, and the fold lies on the SW limb of West Dome in the Telfer Dome. (Location: NW face of Pit 11, Telfer Gold Mine; Mine Grid: 1501ON, 8850E / see Map 1).. Figure 3: Photomicrographs of Sl from a micaceous bed in the Telfer Mine. (A) Sl lies at a low angle to bedding and is penetratively developed in micaceous units, such as that in the lower half of the picture. The thin section was cut in the vertical plane and trends 020-200°; the scale bar at the bottom right represents O.2mm, and the box outlines the area shown in (B); (B) S 1 is a coarsely spaced and weakly differentiated crenulationlseamy cleavage that crenulates a micaceous bedding fissility. The orientation is as for (A), and the scale bar at bottom right represents O.04mm. (lCU Catalogue No. 48341 ).
(9)
(10) Figures - Section A. Figure 4: Cross-sectional field sketch (looking NW) illustrating Dl-Sl fold-cleavage relationships (main figure) and cleavage-bedding relationships along the long limbs of Dl folds (inset). S 1 lies axial plane to the Dl monoclines and exhibits a top-to-the-SW shear sense, locally producing an extensional crenulation (e.g. Platt & Vissers, 1980) geometry against bedding on the SW limbs. This is consistent with the apparent attenuation (extensional thinning) of the SW limbs during Dl.. Figure 5: Field sketch (looking NW - redrawn from photograph) of centimetre-scale parasitic Dl folding illustrating the SW directed shear sense indicated by fold asymmetry. The shorter NE fold limbs retain an original sedimentary thickness, whilst the longer SW limbs are attenuated along shear planes that parallel the axial plane. The deflection of bedding through these shear planes indicates a topto-the-SW shear sense consistent with other indicators. The folds are located on the shallow NE dipping limb of a macroscale Dl fold (see inset; see also fig. 4 Section D). (Location: NW face of Pit 7, Telfer Gold Mine; Mine Grid: 12500N 10250E / see Map 1)..
(11) NE. oI,._.....J._ _ _4cm I.
(12) Figures - Section A. Figure 6: Photograph of small symmetric intrafolial isoclinal folds on the SE limb of Trotmans Dome (see Map 2 for location of Trotmans Dome). The isoclinal folds formed within finely laminated units and commonly exhibit a low-angle truncation of the long limbs against the enveloping bedding surface. Note the presence of smaller asymmetric folds in the lower left comer of the photograph, the vergence of which is opposite to that of the larger folds suggesting local coaxiality in the deformation. (Location: AMG - 7584000mN, 436000mE - see Map 2).. Figure 7: Photographs of isoclinal fold styles at Trotmans Dome. (A) Metre-scale isoclinal folding (Fr) that is refolded by D2 (F2). The isocline has a steeply NW dipping (to the right in the photograph) axial plane suggesting that it either formed vertical (prior to D2), or was folded into this orientation post-D2. The photograph is looking WSW. The small box indicates the location of; (B) Parasitic Fr folding in the hinge of the mesoscale isocline. The photograph is looking SW. The folds are at the same location as Fig. 6..
(13)
(14) Figures - Section A. Figure 8: Summary sketches of different intrafolial isoclinal fold styles observed in deep core from the Telfer Dome. (A) Tight asymmetric folding of a finely laminar dolomite layer. The fold asymmetry suggests a potential shear sense across the fold as shown. (B) Symmetric intrafolial isoclinal folds that exhibit well formed parasitic folds along their limbs, and appear to be slightly discordant against the enveloping laminae. The laminae between the two symmetric folds are asymmetrically drag folded, with an opposite sense to that of the iSOClinal folds, suggesting post-isocline layer-parallel shearing and disruption. (C) Symmetric isoclinal folds that lie within faulted and disrupted laminae. (All examples observed in the Lower Limy Unit, Main Dome (see Section D). Diamond Drill Hole: MRC 185-30; Depth, 1023m)..
(15) Asymmetric fold produced by layerparallel shearing. A. Zone of disrupted laminae. Microfault. Isoclinal folding observed in deep diamond drill core from Main Dome, Telfer Dome. 8 Symmetric isoclinal fold with parasitic folding along the limbs. 45mm M. Location Diagram. c. MRC 185·30. Main Dome. Disrupted laminae surrounding symmetric isoclinal folds. Sample Location. (= 1023m depth).
(16) Figures • Section A. Figure 9: Sketch map and schematic development models for isoclinal folding on the NE limb of Trotmans Dome. (A) Sketch map of a metre-scale isoclinal fold (FI illustrated in Fig. 7 A), which is refolded by D2, illustrating the orientations of minor folds of different generations in the outcrop. The isoclinal fold also appears to have been refolded by Ds (axis marked on page). Trotmans Dome is located approximately 1O-15kms SE of Telfer (see fig. 1 in Section E; Map 2, 2B). (B) Schematic flow-diagram (cross sectional - looking NW) illustrating. potential development paths (large arrows) for the isoclinal fold. The isoclinal fold may have initially formed pre-Dl as an upright fold, which was subsequently rotated into a recumbent orientation during Dl (I); or may have formed during Dl as a recumbent asymmetric fold (ii). Either (i) or (ii) could then have been refolded by D2 onto the NE limb of Trotmans Dome (iii)..
(17) F2. \ \. \. \ \. \ ~ '\. \ \. /. N. \. '\. \. '\. \. '\. '-. '\ '\. -. 1km. Bedding dip - SO trace - - - - Fold axial trace .p Minor fold plunge. Upright folding resulting from layer-parallel shortening. PRE· 01. ~~OR. 01. -4. ~ .• '. •. 7tf\ ~ ~. (i) SW. ~. (ii). ....... Asymmetric folding produced by layerparallel shearing in 01. !. Asymmetric an recumbent fold refolded by 02 ~. Upright folds rotated towards the SW and a recumbent position during 01. 02. (iii) Cross section views lookingNW. B.
(18) Figures - Section A. Figure 10: Schematic cross section through a D2 fold showing Sl/S2 cleavage-. bedding and vergence relationships. On the SW limb both S 1 and S2 exhibit the same cleavage-bedding vergence, whilst on the NE limb the two are opposite. The insets illustrate the overprinting (crenulation) relationships between S 1 and S2 (C), and crenulation of S2 by bedding reactivation (Bell, 1986; R). For (C) note the changing shear sense of S2 crenulations on either side of the dome (observed in outcrop and thin section for S2 against SolS 1 foliations)..
(19) sw. NE 01~. 01-~. R)02. 02~. --so ------- S1 ----S2 o-? Vergence. 400m.
(20) Figures - Section A. Figure 11: Photograph of a mesoscale D3 fold in finely laminar units of the Isdell Formation, SW of Telfer (view looking NW along the axial trend of regional. ~. folding). A fine-scale semi-discontinuous fracturelcrenulation surface (parallel to the pencil) marks the axial plane, the asymmetry of which indicates a top-to-theNE shear sense/movement direction for D3 in this locality (Location: AMG 7591102mN 407508mE - see Map 2B).. Figure 12: Field sketch of discrete sub-horizontal spaced S3 crenulation cleavage (horizontal) overprinting S2 (vertical). S2 is evident as fine discontinuous traces, and the S3 crenulation asymmetry indicates a top-to-the-NE shear sense for D3 in this location. S3 is only sporadically preserved at this locality owing to the extensive obliteration of the rock matrix through subsequent metasomatic alteration that accompanied skarn mineralisation (albite porphyroblast formation) and weathering (Location: Minyari Test Pit; AMG - 7634000mN 422300mEsee Map 2)..
(21) 0. NE. ~2. SW. { (). 0I ). 10 1 0 /. i. () S3. ./. -----=-=. ". 0. V. I II( j 0 I. "\ \. \. S3. I IOmm I.
(22) Figures - Section A. Figure 13: Field sketches (presented schematically) illustrating the various stages of D2 and D3 folding that were observed in a laminar bedding-concordant quartz. vein in the Telfer Mine. Insets illustrate the location of the quartz vein within siltstones (i), at the SE comer of Main Dome (ii - filled box). (A) Parasitic ~ folding (exhibiting a SW vergence). The range of D3 styles, which exhibit an opposite (NE) vergence, includes: (B) A weak D3 perturbation with no axial plane cleavage; (C) Moderately tight D3 fold with no axial plane cleavage; (D) Tight D3 fold with a weakly developed axial plane fabric defined by limited shearing/dissolution; (E) Fully formed D3 fold with shearing/dissolution across the axial plane. (Location: NW face of old Pit 1 Ramp, SE comer of Main Dome, Telfer Gold Mine; Mine Grid: 10450mN 11350mE - see Map 1)..
(23) NE. sw. Main Dome. 3m. sw.
(24) Figures - Section A. Figure 14: Open D4 cross-folding of a D2 fold in a sandy carbonate unit of the Isdell. Formation near the Grace prospect (see Map 2, 2B), SW of Telfer. View is to the ENE and the D2 axial plane lies parallel to the plane of the page. D4 folding is of limited amplitude (3-5m) and cross-folded D2 folds where the angular difference between the two was sufficiently high (see text for discussion). The small box marks the location of Fig. 15. (Location: AMG 7573560mN 427125mE - see Map 2, 2B).. Figure 15: Photograph of coarsely spaced sub-vertical S4 crenulation cleavage lying. axial plane to the D4 fold illustrated in Fig. 14. Photograph is looking ENE, and the D2 axial plane is parallel to the plane of the page. (Location - as for Fig. 14).
(25)
(26) Figures - Section A. Figure 16: Ds kink folding styles observed in finely laminated calc-arenite and. dolomitic units of the Isdell Formation, immediately adjacent to, but south of, the Karakutikati Range (see Fig. 1). (A) Monoclinal kink folding, which commonly terminates in rounded monoclinal foldslflexures. The kinks occasionally exhibit fine-scale dissolution seams along the axial plane. (B) Angular kinkfcrenulation fold that exhibits strong dissolution along the axial plane. The shear sense across the axial plane for both samples is dextral, the photographs are in plan-view and the arrows mark true north. (Location (both A & B): AMG 7590000mN 408300mE - see Map 2, 2B).. Figure 17: Equal area plot (contoured) illustrating the orientational distribution of Ds-. style kink folds throughout the Telfer region. Two major groups are evident; the Ds trend (sub-vertical -> 290°) and a further group clockwise from this (subvertical -> NNW), with a minor spread between the two. The majority of readings come from the Isdell Formation immediately SW of the Karakutikati Range..
(27) Equal Area. N. C.I. = 1.0 sigma. 0= Maxima / Pole to average plane of best fit.
(28) Figures - Section A. Figure 18: Summary table of the proposed deformation sequence for the Telfer region including schematic illustrations of the overprinting relationships. ~. refers to an interpreted period of early horizontal shortening producing upright folds (see text for discussion). DS encompasses two separate episodes of compression, DS and DSb..
(29) Stvle. Event DEF. Upright open to tight and isoclinal. Orientation. Tectonic. NW -SE trending fold axes. now recumbent.. Dl. Recumbent monoclimil folding; locally. S 1 : 15,30· -7 SW,W. South-west directed slIb-. oveltumed NE (short) limbs; coarsely. F 1 : 2,15· -7 NW,N. horizontal thrusting/. spaced axial plane cleavage (S 1), which. (both strongly refolded by. vertical shortening;. D2). locally extensional. Upright open to tight NW-SE trending. S2 : 70,90· -7 SW, SSW. NE-SW directed bulk. regional folds, with a penetrative axial. Fg :0,50· -7 NW,SE. inhomogeneous tectonic. plane cleavage (S2).. L~. shortening (230-050·). exhibits a. D2. SW shear sense.. o. : steep pitch on S2. °EF. Q. ~ --:0". folding and discrete sub-horizontal. SJ: 10,20· -7 315,340·. thrusting/differential. crenulations. Most examples are meso-. F~. movement and vertical. scale; rare axial plane cleavage (S3).. ,F; :0,5" -7. NNW,. NNE. 01. 02. -=:.../. NE directed sub-horizontal. Recumbent asymmetric monoclinal. D3. ~. ~n7S).r/";;:-;- ..§l "~"}:Il:/ I".' ,III. .... 1!!:.Pfi~~/j ~~1. ?TTl!":':; ~9:-;:7X //.::.'./~:'~/;~:~.~J~. shortening. Gravity-. ...;- /S2. induced collapse post-D2. Upright cross folding of D2 folds with a. I S4 : 70,85"-7 255, 265. rare coarsely spaced axial plane D4. crenulation cleavage (S4); generally. F~. meso-scale folding.. Upright kink folds, cross folds with associated weak: coarsely spaced. veining, dolerite dikes, fault vation and kink folds.. inhomogeneous tectonic. shortening (255-075·). 320·. 04. S5: 70,85" -7 290,300·. WNW-ESE directed. (inc!. kink fold axial. inhomogeneous tectonic. cleavage (cf. Chin et al, 1982). (b) Mainly brittle structures including. : 40,45" (variable) -7. I. WSW-ENE directed. plane). shortening (290-110·). S5: 75,85· -7 350, 355". NNW-SSE / N-S directed. (inc!. kink axial plane). tectonic compression. Ci]. = 345-165" to N-S.. 05 '-. /S5. ~~. iN. ~,. 05. Seamy/stylolitic cleavage -. ~.
(30) Figures - Section A. Figure 19: Schematic illustration of two possible ways of forming Dl monoclines from an earlier fold phase. (A) Initial upright open folding, with an associated axial plane cleavage, is overprinted by NE directed sub-horizontal thrusting/ shearing. This produces an asymmetric flexure through bodily rotation of the initial upright fold. Rotation of the axial plane cleavage causes it to be reactivated (antithetic cleavage reactivation - ACR), producing a local top-to-the-SW shear sense that is antithetic to the bulk tectonic movement. (B) Initial upright open folds, with or without an axial plane cleavage, are overprinted by a SW directed thrusting! shearing deformation and associated sub-horizontal cleavage (Sl). Bulk movement, accommodated along S 1, causes attenuation of the long limbs of the now monoclinal folds. Cleavage shear sense (top-to-the-SW) is synthetic with respect to the bulk tectonic movement. (B) is the preferred model for Dl fold formation - see text.. Figure 20: Horizontal D3 kink folding in the Isdell Formation that is suggestive of vertical crustal shortening. The kinks developed with a markedly inclined axial plane (FtJ in sub-vertical finely laminar units (i), with the axial plane crenulation asymmetry suggesting top-to-the-NE shearing/movement. Two possible ways to produce this are; (ii) synthetic shearing along a shear band/micro-fault plane, inclined NE, during NE directed D3 movement. or (iii) vertical shortening of the sub-vertical beddingllaminae producing a kink fold, whose axial plane was inclined with respect to the layering and the prevailing compression. The latter (iii) is the preferred development history given the kink-like character of the crenulation plane and its occurrence in finely laminated units (see text); this implies vertical crustal shortening during D3..
(31) PRE·01. Early upright folding 1. Axial plane. Early upright folding. 1 cleavage. 1/. +. sw 01. NE SW. -. ./'. 01. A. PRE.01. B. """. IIIIIIII. + -. --. NE. Synthetic shear ~Iong S1 cleavage. -. jiIP. sw 47". 4'. ~. 117'. 03. ~S3. S3~ Synthetic shear on inclined micro·fault planes during D3. Bulk vertical shortening during D3 deformation. 03. (ii) Jiii"'". (iii).
(32) Figures - Section A. Figure 21: Schematic diagram illustrating the variable effects (observed/interpreted) of NE directed D3 deformation on a D2 fold. The main diagram illustrates a. ~. fold where D3 has refolded the hinge and axial plane cleavage (S2), and the insets illustrate the mesoscale effects around this fold: (A) The SW limb is more likely to be antithetically reactivated (bedding), rather than deformed, by D3 given its trailing orientation with respect to NE directed tectonic movement. S3 may form in zones of high D3 strain; where this occurs it will have an extensional crenulation geometry. (B) In contrast, the NE limbs, which are oriented against the bulk D3 movement, are more likely to be deformed resulting in sub-horizontal crenulation folding of bedding and S2. The crenulation asymmetry should mimic the larger bulk movement (Bell & Johnson, 1992). (C) In regions of steeply oriented bedding, sub-vertical D3 shortening may produce symmetrical crenulations (ie. coaxial deformation), in addition to asymmetric crenulations/folds as in (B)..
(33) 03. .".,. sw. NE. S2. 03. 800m. t.
(34) SECTION B. Structural Reconnaissance of the Lower Yeneena Group, Paterson Province, W.A.; Overprinting of an Ensialic Intracratonic Basin by Migrating late-Proterozoic Collisional Orogenesis and Resolution of Conflicting Tectonic Indicators.. (FIGURES).
(35) Figures - Section B. Figure 1: Map of western and central Australia showing the location of the Paterson. Province and Paterson Orogen with respect to other Archean and Proterozoic terranes. The Paterson Orogen trends NW-SE across northern and central Australia, lies marginal to the West Australian Shield (Myers & Hocking, 1988), and truncates the Albany-Fraser Orogen. A large gravity ridge under much of its length (the Anketell Gravity Ridge - Fraser, 1976) indicates continuity to central Australian orogens and sedimentary basins (e.g. Musgrave Complex, Amadeus Basin). The orogen is bounded to the east by the Archean Pilbara Craton, and the southwest by the middle Proterozoic Capricorn Orogen (e.g. Tyler & Thorne, 1990). It is covered to the north by the Canning Basin, and to the southeast by the Officer Basin (both Phanerozoic in age). The inset illustrates the geology of the Paterson Province (also shown in Fig. 2). The Yeneena Group (light stipple) overlies the basement Rudall Metamorphic Complex (cross stipple). Both are overlain by the Karara Basin (dark stipple)..
(36) 120'E. 135'E. 125'E. 15'S. 20'S. 30'S. 30'S 123'E. 21'S CANNING BASIN. ALBANY. I 22'S. Proterozoic sedimentary/volcanic rocks 1 :2: 1850 Ma 2 1850 to 1000Ma 3 <1000 Ma. Proterozoic weakly metamorphosed. ", E8J , , , ,, ,. sedimentary/volcanic rocks. Proterozoic metamorphic complexes. SAVORY BASIN. Archaean metamorphic complexes and sedimentary/volcamcs. 121'30'E.
(37) Figures - Section B. Figure 2: Simplified map of the Paterson Province illustrating the two main lithostratigraphic units, the Rudall Metamorphic Complex and the Yeneena Basin/Group. The Yeneena Group is divided into three geographic zones (after Williams, 1990a) whose stratigraphic succession is summarised in the table below the diagram. The Karara Basin unconformably overlies the Yeneena Basin..
(38) 121'30'. 21' WESTERN AUSTRALIA PILBARA CRATON. 3. 22'. CANNING BASIN. 23° --'-- Thrust. V77J Karara Formation SAVORY I::::::LLJ BASI N OFFICER BASIN. YENEENA GROUP Northeastern Zone Central Zone Western Zone. 24°. ~ Rudall Metamorphic Complex. h.::::.::::..J. 50Km. (gneiss, granitoid, schist). 123'. Western Zone. Isdell Formation -. -DISCONFORMITY- -. -. -. -. Northeastern Zone. Isdell Formation. Kaliranu Beds Wilki Quartzite Puntapunta Fm. TelferFm. Malu Quartzite Isdell Formation. -DISCONFORMITY- -. Choorun Formation Yandanunyah Fm. Brownrigg Sandstone Waroongunyah Fm. Googenama Fm. -UNCONFORMITY- -. Central Zone. -. -. -. -?- -?- -. Choorun Formation Basement not known. Broadhurst Formation Coolbro Sandstone -. Hamersley-Fortescue Gp. Manganese Subgroup. -. -. -. -UNCONFORMITY- -. Rudall Metamorphic Complex. -. -.
(39) Figures - Section B. Figure 3: Summary map of the geology of the Rudall River area (see Figs 1 & 2 for location), and the field locations in this study (see Appendix 2 for structural data at each location). Basement rocks (Rudall Metamorphic Complex) are unconformably overlain by lower units of the Yeneena Group (Coolbro Sandstone and Broadhurst formations). Numerous thrust faults along the southwest margin interleaved gneissic basement and Yeneena Group sediments. The Broadhurst Formation in this location is tightly folded, with closely spaced axial planes commonly inclined/overturned to the SW. In the Broadhurst Range area, the large Sunday Creek Syncline contains numerous parasitic antiformal and synformal folds, many exhibiting thrust/lag faulting along their limbs (Hickman & Clarke, 1993)..
(40) [~. Yeneena Group. Broadhurst Fm. Coolbro Fm. Basement Gneisses (undiff. Rudall Complex). ~o. Q1~. ~. ~ ~. \. 7,540,OOOmN. ~~I. ~.?,. ~$. ~. %.....1.9:.. ?j. Numerous closely spaced anticlinal and synclinal folds - commonly overturned (SW) ~. o I. 10km I. 7,520,OOOmN. -t--. +. Antiform Synform Fault. o. Location.
(41) Figures - Section B. Figure. 4:. Photograph. of highly-strained. boulder-conglomerate. containing. boudinaged gneissic cobbles. The rock is the basal erosional unit of the Yeneena Group, and the present fissility is the old So surface. Photograph is taken 0. looking NW. The zone now dips at 50 NE and movement was parallel to the dip direction (based on slickenside lineations on quartzose cobbles) and reverse (based on shear sense from porphyroclastic cobbles and grit grains). (Location No. 13). Figure 5: Dl intrafolial isocline preserved in finely fissile Broadhurst Formation and overprinted by S3. Photograph is looking SE on the moderately SW dipping limb of an anticline. These isoclines may commonly be sheared/attenuated along their limbs indicating bedding-parallel shear post-Dl. This could have occurred during D2 (see text) or from antithetic bedding reactivation during D3. (Location No. 19).
(42)
(43) Figures • Section B. Figure 6: Photograph and line diagram illustrating the formation of D2 monoclinal folding along the long limb of a tight Dl fold. The Dl fold was rotated during ~ such that the trailing limb was attenuated along discrete high strain zones, producing a D2 monocline. The short limb (low strain) of these monoclines may represent a relict sub-vertical bedding orientation produced by Dl folding. S2 is a coarsely spaced crenulation cleavage that lies ax:ial plane to the monoclines and is well developed in D2 high strain zones. Note the relative intensity of bedding attenuation along the long limbs (high-strain zones) of the monocline, with little or no thinning on the short limb (low-strain zones). This sample comes from the upper limb of a larger thrust-faulted Dl isocline illustrated in Fig. 7. (lCU Catalogue No. 48342; Location No. 22 ).
(44) NE. 02. ",. Partial 02 monocline formed on the limb of a rotated F1 fold.
(45) Figures - Sectiou B. Figure 7: Field sketch of a recumbent isoclinal fold with a thrust-faulted lower limb. The structure is interpreted to be a Dr fold that was rotated towards the southwest into a recumbent orientation during D2, with associated thrusting along the lower limb. The fold and the basal fault plane are refolded by. D:3. (regional folding). The location of Fig. 6 is indicated by the box. (Location No. 22). Figure 8: Photograph of small rootless monoclinal folds in which coarsely spaced S2 cleavage overprints the steeper short limb. These are overprinted by S3, and the long limbs have been subsequently unfolded by antithetic bedding reactivation during D3 (see Fig. 9). Note the small inclined asymmetric folds in the lowercentral left of the photograph (IFF). Photograph is looking SE at moderately SES dipping Broadhurst Formation on the SW side of a D3 anticline hinge.. (Location No. 18).
(46) Vertical Shortening. 5W D3/53. L. \ D~. +I. NE. 02. \ \. 52 of a 01 fold ...' '.'. OntoRotation a recum bent position •. 0. 52. $~~Si0iSi~~~~~~~~ "" .\ . •. \\ o I _ _ _ 1:n ~. \ \. \. \ 7. 02. t. Vertical Shortening. D3is3. w angl. thrushon. Lo - e SW movement) (top-to-th.
(47) Figures • Section B. Figure 9 : Schematic diagram illustrating potential development of structures observed in Fig. 8. (A) Initial Dl folds formed through layer-parallel shortening, in an upright or weakly SW inclined orientation. (B) These were subsequently rotated by SW directed horizontal movement and vertical shortening during D2, that produced a coarsely spaced overprinting cleavage (S2). (C). The latter was well developed on the short limb as this lay parallel to the compressional ,direction (ie. sub-vertical). (D) D2, folds were overprinted by S3 during subsequent D3 folding. Bold arrows mark the bulk fold movement. (E) Antithetic bedding reactivation (Bru late in D3 caused layer-parallel shearing that unfolded the relict DI-D2 folds obliterating the long limbs, which lay at a lowangle to bedding.. Figure 10: Field sketch (drawn from photograph) of the timing relationships between high-angle reverse faulting and D3 fold formation. The main diagram illustrates D3 folding and S3 cleavage development during bulk horizontal shortening with synthetic bulk fold movement (BFM) across bedding in the fold limb, which lies on the NE limb of a regional fold (inset). The shear sense on S3 is also synthetic (1), however late in the folding, as the limb steepens, antithetic shearing of. bedding (reactivation) crenulates S3 along the bedding plane (2). This is overprinted by the high-angle reverse faults (3) indicating these formed late- or post-D3 (Location No. 21 ).
(48) , 0'1. 0'1. ..... -.0'1. 01. A. Ciiiiii. 0'1. t. ...... 1. ~. .... c. ~0'1. 8. + 0'1. Scm. IF3. NE. sw High-angle thrust fault; SW verging I. I. / I. /. =6S,7S'NE. t 0'1. ). oI. SOcm I.
(49) Figures - Section B. Figure 11: Photograph of a D4 fold in finely schistose Broadhurst Formation The sub-vertical fabric is S3, which is coarsely crenulated (asymmetric) by D4. The F4 axial plane is sub-horizontal (parallel to the head of the hammer) where S3 is horizontal. In this locality S4 is marked by local and extremely fine dissolution of foliated (S3) country rock in high D4 strain zones. The photograph is looking south-east on the SW dipping limb of a D3 anticlinal fold. (Location No.6). Figure 12: Field sketch of a metre scale F4 fold on the SW dipping limb of a D3 anticline. Bedding, S3 and syn-D3 quartz veins are folded about a horizontal D4 axial plane. The fibrous quartz veins formed during D3 with their fibres parallel to S3 (a). However, D4 folding has rotated S3 in the matrix (b), with the vein preserving the initial vertical S3 orientation. The location of Fig. 14 is indicated by the small box marking the lower right inset. The section is drawn looking NW and both F3 and F4 verge NE. This locality is approximately 2.5krns SE of Fig. 11 (see Fig. 3) illustrating the potential for localised D4 vergence reversais.. (Location No.7).
(50) 53 /. I. I. sw. I. I. /. / I. /. 04 __ '~. I. f. NE. I. I. /. I I /. / / /. oI. f. I. 53 04. 2m I.
(51) Figures - Section B. Figure 13: Photomicrographs illustrating various styles of S4. (A) S4 is a coarsely. spaced asymmetric crenulation cleavage (horizontal) overprinting sub-vertical S3 in highly fissile Broadhurst Formation. The thin section is vertical and oriented as shown. In this location the differentiated S4 crenulation asymmetry indicates a top-to-the-SW shear sense on the F4 axial plane. The scale bar is 4mm long.. (lCU Catalogue No. 48343; Location No. 24 ). (B) S4 is a coarsely spaced symmetric crenulation of SoIS3 with weak differentiation along the fabric plane. Symmetric S4 crenulations are generally observed only in fabrics that are vertical/sub-vertical, suggesting shortening perpendicular to the layers (ie. vertical shortening). The thin section is vertical and oriented as shown. The scale bar is 3mm long. (lCU Catalogue No. 48344; Location No.7). Figure 14: Field photograph illustrating the preservation of S3 within quartz veins,. and its subsequent folding in the matrix by D4. Large fibrous quartz veins formed with their fibres parallel to, and preserving, S3. In the rock matrix, where S3 was not protected by the quartz, it was subsequently rotated/flattened during D4. Photograph is looking NW, and the movement sense for F4 is top-tothe-NE. The sample comes from the limb of the D4 fold illustrated in Fig. 12 (inset b in Fig. 12). (Location No.7)..
(52)
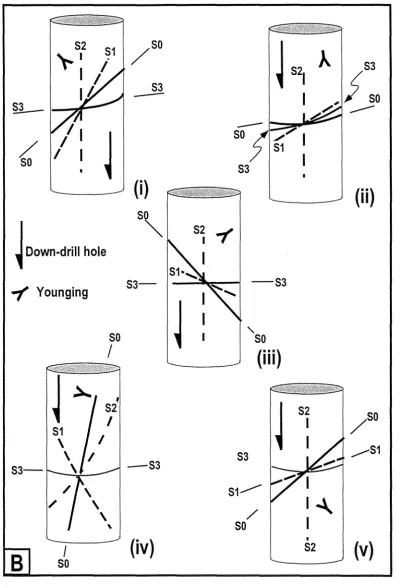
(53) Figures - Section B. Figure 15: Summary diagram of the effects and structures produced by D4 and Ds deformation in the Lower Yeneena Group. Main figure is a schematic D3 anticline-syncline pair illustrating the macroscale refolding effects of D4, which include flattening and rotation of F3 hinges. Mesoscale (centimetre) effects include; (i) - S3, in the hinge of an F3 fold is rotated into a horizontal orientation by D4. This flattened zone, an F4 hinge, is subsequently overprinted by Ds crenulations. (ii) - Crenulation of S3 along bedding arising from antithetic reactivation of the F3 limb by D4. Note the sense of crenulation is the reverse of that expected for bedding reactivated during D3 (cf Fig. 10). (iii) - D4 folding of sub-vertical S3. The F4 hinges were subsequently overprinted by Ds crenulations (this is a cross sectional view of the crenulation geometries shown in Fig. 16). (iv) - Asymmetric D4 crenulation of So and S3; these occur predominantly on the SW dipping limbs of D3 folds, which were favourably inclined for deformation during top-to-the-SW shear in D4. (v) - Symmetric D4 folding of S3 is observed in the central hinge regions of F3 folds where asymmetric crenulation formation was restricted. (vi) - Symmetric D4 folds developed in sub-vertical bedding (and S3) suggesting vertical shortening.. Figure 16 : Plan view photograph showing Ds crenulations overprinting D4 folds of S3 cleavage. The prominent fracture direction (N-S on the page) marks the trace of sub-vertical S3 that is sub-horizontally crenulated by D4 (see Fig. 15iii for section). These areas of sub-horizontal S3 were favourably oriented for overprinting by Ds crenulations. The latter lie at an acute angle to S3 (NNE-SSW on page) indicating that Ds shortening was approximately 20-25° anticlockwise from that of D3. Photograph is looking SE up the page. (Location No. 24 ).
(54) S3. 0"1. l. -J':-; :.-. -. -(. .... ". -S4. ~. \ i\. S4-. ~rm.?·S4. \. --. ~. SO/. (vi). (v).
(55) Figures - Section B. Figure 17: Photomicrograph of coarse Fs crenulation folding and localised differentiated Ss development in schistose Broadhurst Formation. The main schistosity is a composite SoIS3 foliation that is lying horizontal in the hinge of a D4 fold. The thin section is vertical and oriented as shown. The scale bar is 1.5mm long. (lCU Catalogue No. 48345; Location No.7). Figure 18: Photographs of D6 kink folding styles. (A) Coarsely developed D6 kinks within finely cleaved Broadhurst Formation. The prominent fabric (N-S on page) is S3. Associated with the kinks are fine discontinuous and continuous fracture planes that define a rough axial plane fracture cleavage (S6). The photograph is a plan view and NW is to the top. The scale bar is 6cm long. (Location No. 20). (B) D6 kinking of SoIS3. Photograph is looking sideways at an intermediate angle to the NE. So and S3 are roughly parallel in trend. Note the local weak development of dissolution seams along the axial planes of the kinks. (Location. No.9).
(56)
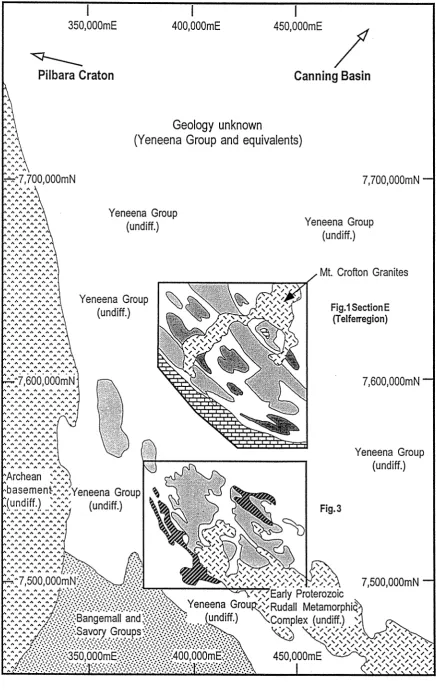
(57) Figures - Section B. Figure 19: Summary map of gravity and magnetic data for the Paterson Province (data sourced from regional surveys carried out by the Western Australian Geological Survey (GSWA-I :250,000)). The map illustrates the major gravity divisions across the province and prominent magnetic linears. The clear overlay illustrates the broad lithological divisions of the Paterson Province and shows the positions of the two study areas (Rudall Inlier and Telfer district). The broad Anketell Gravity Ridge is clearly visible, and in the SW corner large gravity depressions mark the edge of the Karara and Savory Basins. In the Throssell Range and Anketell regions major magnetic linears define complex patterns suggestive of transpressive (e.g. Mitchell & Reading, 1986, p. 503; Sylvester, 1988; Woodcock & Schubert, 1994) and faulted-fold geometries. Larger discordant linears are also evident in the NE area of the Paterson Province..
(58) 350,OOOmE. 400,OOOmE. 450,OOOmE. ~ Pilbara Craton. /. Canning Basin. Geology unknown (Yeneena Group and equivalents) 7,700,OOOmN Yeneena Group (undiff.). Yeneena Group (undiff.) Mt. Crofton Granites. Yeneena Group (undiff.). Fig.1 Section E (Telferregion). 7,600,OOOmN. Yeneena Group (undiff.). Fig.3. 7,500,OOOmN.
(59) 450,OOOmE. _ _-. Solid magnetic anomaly (sub-surface intrusive?). 7,700,OOOmN. ···G······ · .. ·.. · . .. . .. . . ... •. .. ...... . . ..... . . .. . '" ... ;::15mGal. E22J 0 -15 mGal l1li-15 - 0 mGal. o. o. -25 - (-15) mGal -35 - (-25) mGal -50 - (-35) mGal. ~ ~50mGal. 400,OOOmE'.
(60) (iEtl~\!j!8mij~~S). A,ew7" ue 0 uoew P!lOS - " I I 1'\1'\ 1"\. '". '09P 09v.
(61) Figures - Sectiou B. Figure 20: Schematic summary of the progressive development, and migration of the. core, of the Paterson Orogeny during the late-Proterozoic. (A) Initial shortening during DI, with the orogen core lying NE of the Paterson Province, produced weak folding of the sequence (FI). (B) Gravity induced collapse of the core during D2, produced SW directed thrusting across the Paterson Province. (C) Progressive widening of the orogen, and migration of it's core, produced stronger shortening in the Paterson Province during D3. CD) Continued SW migration of the orogen core and subsequent collapse during D4 resulted in the inflection line (see text) lying between Telfer and the Rudall inlier, thus explaining the development of opposite D4 vergence directions in either area. (E) The accretionary wedge model of Platt (1986) illustrating the various structural styles (extension and thrusting), and inferred bulk shear senses, in different levels of the wedge. The inferred position of the inflection line of Bell & Johnson (1989) is also illustrated. Such a wedge, encompassing the Paterson Province, may have lain on the foreland side of a collisional/subduction driven orogen (Inset). (F) Granite intrusion in the NE part of the Paterson Province may have induced local gravitational collapse causing co axiality in D4 deformation; a situation akin to a changing inflection line position. (G) Alternative explanations for the changing shear sense geometries between D2 and D4 across the Paterson Province, whereby the orogen core initally lay SW of the presently exposed province and Telfer and the Rudall Inlier were initially (DlD2) located in the upper NE quadrant of the orogen. Over time the orogen core may have migrated SW (i) or NE (ii) with burial of the province. These explanations are considered less likely (see text)..
(62) I. Rudall. A. I. Telfer. a1. ~. ..... B. I. Rudall. I. Telfer. I. Rudall. c. I Shifting Orogen Core. Original Inflection line New Inflection line. D. /7 /. \.. I. _-:::-yV ,.,. . ""'". --- --. I. Rudall. Previous orogen position. Telfer. -:0-'". ~. -,.,....""'". Infiection/demarcation. ~~~~10km. 20km 30km 40km. --. E 01. 11. ~. -----. F. G. • <f- •. ,/I_. 01·02 04(i) 04(ii).
(63) Figures - Section B. Figure 21: Summary map of the effects of NE-SW convergence across the Paterson. Orogen during the period 750-550Ma (redrawn from Myers, 1990a,b). These effects included deformation of earlier deposited sediments, and the formation of new sedimentary basins in response to thrust-loading of the foreland. The latter occurred over most of the length of the Paterson Orogenic belt during this time..
(64) ...(). 15-. ~. ~. SUSPECT TERRANES. ~. ~. r-=l ~. Sedimentary Basin deformed during the Paterson Orogeny. ~. Early-middle Proterozoic. :::: 640·600Ma. Yeneena Basin Rudall Metamorphic Complex·. ~. Amadeus Basin. ).. ..-%. ~ basement. ~~. \~ ~. .... \. ~. ~\ ~. \ ,"," , 'Sr,&0 '"":-.:::. '-::... ~ . . . ,, ~ OA '. "0. i'9(9". 30'. ~. West Australian Craton. 500km. :::: 640·600Ma. I. 250 km. 125-. ......,-. ....... . .. ...
(65) sw Concordant Quartz Vein (wk. mineralised). NE. WestD Axial PI. A. ~ NW ---,. --- ---. Discrete Lenses -. 10m 2m. B. Wall rock Fragments I. 50cm. SW. I. c.
(66) Figures. - Section D. Figure 28: Summary diagram of different styles of "pod" mineralisation in West. Dome. (A) Large fault-parallel pod mineralisation (stippled - Pod 7/8) occurs within a moderate SW dipping reverse fault in the northern section of West Dome. E-reef mineralisation (also stippled) is offset along this fault, and subsidiary pods have developed in the footwall (Pod 6). Additionally hingeparallel pods have developed in steepened asymmetric fold hinges (Pod 11). (B) A linear pod hosted within the hinge of a shallowly plunging antiformal fold. Insets (cross-sections looking NW) show the nature of smaller faulted bodies that occur on the limbs of the fold. These generally comprised local ramping of the strata by curviplanar reverse faults, which produced zones of dilation/gaping with resultant quartz infill and brecciation. This faulting postdates S2 development. (C) Large pod structure formed within bedding that developed through local disharmonic folding/flexing of bedding. This caused gaping of the strata with resultant implosive brecciation that is now evident as a zone of massive quartz infilllreplacement supporting large clastslblocks of bedding..
(67) S2. I. ~FM. ....,. J. Medium to thickly bedded silty-sandstone Finely laminated interbedded ] sandstone/siltstone (MVR) Medium to thickly bedded siltysandstone, fining upward. 1. 02. 1m. A. I. S2. !. SF. ~SF. ~ 02. ~. 02. B. 03 Extensional Opening. Asperity Opening. l. ~. 02 ~. c. 02. 1m.
(68) Figures. - Section D. Figure 34: Schematic diagram summarising the formation of the massive quartz. veining component of the Telfer reefs. (A) Compressive strain produced flexural flow/slip deformation that was partitioned into a mechanically favourable horizon that consisted of finely laminated sediments lying between more massive units. BFM = bulk fold movement during ~ developing an antiform to the right and a synform to the left.. BR. = bedding. reactivation. arising from folding during horizontal shortening. (B) Partitioning of flexural slip (FS). ~. deformation into this horizon enhanced structural. permeability through gaping and microcracking that assisted the infiltration of high-pressure siliceous fluids (SF) and resultant silicification. Gaping mechanisms may have included extensional opening of laminae (assisted by elevated fluid pressures) and asperity opening, both enhancing structural permeability. Brittle faulting along the base will also have been enhanced by elevated fluid pressures, and would have provided a pathway for siliceous fluids to enter the reef horizon. (C) Continued flexural slip deformation (D2Fs) and layer-parallel shortening would have caused the quartz veins to pinch and swell, producing smooth reef margins, quartz lenses and further silica addition (particularly along the upper contact). Layer-parallel shear, but with a reverse sense to that for flexural slip, may also have occurred through antithetic reactivation of bedding during D3 (D3R), initiating further fracturing and fluid infiltration. (All diagrams are cross-sections looking NW)..
(69) West Dome Deeps shears. A.
(70) Figures. - Section D. Figure 33: Schematic diagram illustrating the effects of D4 shortening across the Telfer Dome. (A) D4 horizontal shortening was slightly oblique to the Telfer Dome and is thus likely to have reactivated and re-used pre-existing domal structures, including bedding and axial plane cleavage (block diagrams). These effects include synthetic reactivation of S2 (1), and antithetic reactivation of bedding, with both dip-slip (2) and oblique slip (3) movement components. Because of the obliquity of D4 stresses these effects would have been strongest in both the NW and SE corners of the Telfer Dome. Large axial plane parallel shears (West Dome Deeps) have a left-stepping arrangement suggesting they were reactivated and further developed during weak sinistral transpression produced by the oblique D4 stress. (B) Unfolding of D3 folds by bedding reactivation during D4. Recumbent D3 folds, which were observed in the SE corner of Main Dome (1), were progressively unfolded and fractured by reactivation of the enveloping bedding surface during D4 (2). This reactivation was strongest along the SE limb of Main Dome as a result of D4 strain intensification into this corner of the Telfer Dome (as illustrated in A)..
(71) ~al. sw ... sw. : tBFM,. 02. :t. NE. NE BFM. Relict 01 fold ":--.--- shape refolded into a 02 fold. ~1. C. S2. (Jl~. sw. ........ 03 ....... 03. INSET. B. Rotation of SW limb approximates card-deck behaviour. D3----". c.
(72) Figures. - Section D. Figure 31: Schematic development of a D2 dome by re-folding of earlier folds. Early orogenic shortening (DEF - see Section A) forms broad flexures (A) that subsequently become the nucleus for Dl fold development (B - see also Section A). Refolding of the FI folds by D2 results in an antiformal fold with a characteristic asymmetry in the hinge, and a geometric axial plane that is not parallel to S2 (C). The small inset illustrates the potential for preferential D2 strain intensification along the pre-existing steep limb of a Dl fold, thus further steepening this limb and increasing the asymmetric character of D2 folds. This may occur in the Telfer Dome to enhance the domal asymmetry. Large full arrows marked BFM in all diagrams indicate the bulk fold movements.. Figure 32: Schematic diagram illustrating the potential effects of D3 on the Telfer Dome, and other D2 folds. Main diagram (A) illustrates the D2-formed Telfer dome with D3 (consisting of vertical shortening and NE directed horizontal movement) acting on it. Rotation of the SW limb during D3 would have caused antithetic layer-parallel shear (reactivation) along bedding (B), a situation analogous to rotation of a card deck model (e.g. Bell, 1986). This shearing produced intra-bedding tensional gashes (C - observed in Pit 14) whose asymmetry is opposite that of those developed during D2 flexural slip deformation. In contrast the NE limb and domal hinge would have been gaped (A) and refolded (D). Gaping would have been greatest where the limb and hinge were markedly rotated towards the NE by refolding during D3 (e.g. the I-reefs).
(73)
(74) Figures. - Section D. Figure 30: Characteristics of bedding-concordant laminar veins within the Telfer Dome. (A) Field relationships of the veins, which occur within siltstone laminae towards the top of upward fining sequences. (B) The veins are folded (F2) suggesting either pre- or syn D2 vein formation. However, S2 is steeper in the vein horizon suggesting that it's orientation was preserved by silicification associated with the veining, whereas in the matrix S2 was rotated by D2 reactivation of bedding; thus implying the veins developed syn-D2. (C) Field photograph of laminar and massive quartz veins within finely laminarlbedded siltstones of the Outer Siltstone Formation (scale bar represents 3Ocm; Location: NW face of Pit 9R, Telfer Mine; Mine Grid 13840mN 8665mB). (D) Photomicrograph of laminar veins illustrating the coarse blocky and optically continuous character of quartz crystals. The crystals are offset along fine fractures that define the laminar form of the vein; these pass diagonally NW-SE across the photograph. The scale bar represents 2mm, and the view is in cross polarised light. (lCU Catalogue No. 48358). (E) Photomicrograph of one of the lamination fractures illustrating the oblique mica growth along the fracture plane; the trace of the 001 mica crystal plane is marked. Note the small jog-like openings in which mica has precipitated. This suggests that the fractures formed through shearing, rather than dissolution. This would have had a top-to-the-right (in the photo) shear sense, resulting in tensional opening (TO) and oblique mica growth (m) along the shear plane. The scale bar represents OAmm, and the view is in cross polarised light. (lCU Catalogue No. 48358)..
(75) .' . . 9uartz. ~. :':':':.~.:~. VeU1$. •. Early hydrottlermal atteration (ON veins). . ..... o. :0 metres. Main-.taoe vein. (50-1,50-2. CeO/CeO, MVR) Late hydro~..rmal veininQ (EO, MO, Chert). Class/Timing. Qn veins(l). ...... .'. EQ - veins (3). MO veins (3). Chert dikes (3). Description. Orientation. Mineralogy. AssocIated Alteration. Thin, irregular qtz veins up to 3cm thick, with a characteristic lime-green alteration halo; abund:mt Massive qtz-sul phi de, vuggy, < 30cm thick. planar-irregular: common. North-south trending, subconcordant, discordant. Qtz (+ rare pyrite). Nontronite, silica, sericite, trace pyrite. West-southwest east-northeast trending, discordant. Qtz, pyrite, chalcopyrite, galena, sphalerite. Sericite, silica, Fe-staining, pyri te, adularia, albite, tourmaline. Massive qtz_-sulphide, oxide. < IOcm thick. irregular. planar: common Thin planar massive oxide veins; common. North-south trending, subconcordant to. Continuous. <Scm thick. locally folded: abundant Thin planar «3cm) qtz. veins. stockworks: common Massive sulphide. oxide; rare. Concordant. Massive pyrite, chalcopyrite, qtz., ankerite, fine te Ankerite, qtz, pyrite, chalcopyrite. muscovite. trace albite Quartz. Variable. discordant. Qtz (minor pyrite). Sub-concordant (CcO). discordant (DcO). North-south trending, subvertical North-south Grey or cream. stockwork like. locally trending, subvertical brecciate wall rocks and ~fVR: rare. Massive pyrite. chalcopyrite Cryptocrystallin e silica.
(76) Figures. - Section D. Figure 29: Summary diagram and table of the various veining styles identified by Goellnicht (1987). The shaded portion of the table represents the main veining stage within the Telfer system. (adapted from Goellnicht, 1987).
(77) Figures - Section B. Figure 22: Summary diagram of the major folding style (main diagram) and. macroscale effects (observed and interpreted) of progressive deformation across the Paterson Province during the Paterson Orogeny. Prominent magnetic linears are also indicated. Boxes A - E represent schematic summaries of the macrostructural development and potential for re-use of pre-existing structures in the major regions of the Paterson Province. Cross section views are annotated X (all looking NW) and plan views are marked P (north is towards the top of the page). Deformation episodes are annotated with their respective numbers. (A) The Anketell region illustrating closely spaced magnetic linears and curvilinears, many of which are truncated suggesting thrust folding. These faults may also have been reactivated sinistrally during Ds, and dextrally during D6. (B) Structural styles in the Telfer region, including doming during D3 (i), refolding of these by D4 (ii), and faulting of regional folds during Ds (iii). (C) Transpressive structures in the Vines Fault - Nifty region (after Dare, 1994). These include dextral N-S trending faults that formed late-D3 (i), truncating D3 folds and producing subsidiary faults. During D6 these faults may have been reactivated sinistrally, or new faults could have initiated truncating earlier ones (ii). (D) Structural development along the south-western margin and Broadhurst. Range included thrust-faulted D3 folding. Rotation and flattening of these folds during D4 may have caused lag fault formation (i). These faults would have been reactivated with a sinistral sense during Ds (ii),. which was weakly. transpressive. D6 compression could also have reactivated these faults in a dextral manner (iii). (E) Fault truncated folding (ENE plunging) developed in the Karara BasiniFormation by D6 deformation..
(78) o ~D6 (i). D. Shortening (folding). I77l Shortening (faulted folding). tL..LJ. l~l:~'1 Transpression Karara Formation (06 deformation only). •. o !. 50km I.
(79) Figures - Section B. Figure 23: Schematic diagram illustrating the potential tectonic setting of the Paterson Province as an ensialic (intracratonic) forelandlback-arc basin. Collisional orogenesis occurred to the NE, and may have involved oceanic crust subduction. The Paterson Province, along with this orogen, was accreted SW onto the Archean Pilbara Craton. Lithospheric delamination (A) may have produced asthenopheric upwelling (B) that resulted in magma underplating the Yeneena Basin (C). Such magma, and other crustal fluids, could have moved along deep basal thrusts and decollements towards the Paterson Province. Such fluids could have been sourced from subducting oceanic crust CD), or alternatively further inboard from broken pieces of oceanic crust that descended to deeper mantle levels (E). Similarly, metamorphic fluids, released from the core of the orogen, may have migrated SW to the Paterson Province (F)..
(80) PATERSON· OROGEN - COLLISIONAL. IIntracratonic (Back-arc?) Ensialic Yeneena Basin I .... TECTONIC. SETTING. Orogenic migrationl widening. A - Lithospheric delamination B - Asthenopheric upwelling C - Magma underplating of Yeneena Basin along basal thrusts; lowercrustal melt generation D - Volatile release from subducting oceanic crust. /. Volatiles. r-:=::=.:::J t.::=t Yeneena Basin. D..·. Yeneena Equivalent. E]. Early-middle Proterozoic (incl. Rudall Complex). ~ .m Archean Craton. Lower Crust (and newly accreted terranes) Lithosphere •. Oceanic Crust. Newly Accreting Terrane?. Rudall Metamorphic. / E - Deep inboard volatile release from broken-off ocean slab F - Metamorphic fluid derived from orogen; migrates to margins.
(81) SECTION C. Late Structural Timing of Mineralisation in the Telfer Au·Cu deposit and the Role of Orogenic Deformation in Regional Fluid Flow and Mineralisation.. (FIGURES).
(82) Figures. - Section C. Figure 1: Geometry of the Telfer Dome and areas sampled in this study. (A) Plan view of the Telfer Dome illustrating the position of the two lower order subdomes, Main and West Domes, and the distribution of stratabound reef mineralisation (MVR and E-Reefs). (B) Cross section of Main Dome (::: 11,1 OOmN - Mine Grid; NE-SW - magnetic; section line marked in A) illustrating the geology and distribution of stratabound reef mineralisation, as well as the location of the three sampled suites. Suite 1 , the Middle Vale Siltstone and Middle Vale Reef (MVR), was sampled from two locations; in drill core immediately SW of the domal hinge, and from underground workings on the NE limb. Suite 2 was sampled from the newly discovered M-Reef series in an exploration decline and associated drives and cross-cuts. Suite 3 was sampled from the newly discovered I-Reefs ("deeps") in diamond drill core from the deeper Main Dome hinge. These reefs commonly comprise extensive brecciation in the vicinity of the tightened and refolded Main Dome hinge. NOTE: the development of many of the deeper reefs away from the hinge is currently untested.. Figure 2: Photomicrograph of typical massive quartz veining in the Middle Vale Reef. Note the "dirty" appearance of the quartz (Qtz) resulting from numerous fine-grained silty inclusions, coupled with small clasts of wallrock (Cr) that were subsequently dolomitised (although much of this is now extremely weathered). The massive quartz was dynamically recrystallised during subsequent veining/deformation phases, and irregular sulphide aggregates (black) infilled along seriate quartz margins. The scale bar at the bottom right is 1.5mm long. (lCU Catalogue No. 48346).
(83) A. 10000mE. 2kms. Middle Vale Siltstone. Open Cut Operations . 11000mE ~Iddle Vale Reef.
(84) Figures. - Sectiou C. Figure 3: Photomicrograph of coarse-grained dolomite-quartz-sulphide veining and. alteration in the Middle Vale Siltstone. Veining comprises coarse-grained ferroan dolomite (Dol), which exhibits rhombic twinning, with interstitial quartz. Finer grained quartz grew syntaxially along vein margins (Qtz) following reopening of the vein after dolomite growth. The matrix is altered to sericite, calcite and dolomite, with lesser chlorite and epidote. Small clumps of chlorite-sericiteepidote alteration occur marginal to the veins (CS), and pervasive sulphide (pyrite ± galena/chalcopyrite/gold inclusions) alterationlinfill occurs through the matrix and along vein margins (Py). The scale bar at the bottom right is 3mm long. (lCU Catalogue No. 48347).. Figure 4: Photomicrograph of rhombic/rounded dolomite porphyroblast (Dol) alteration in the rock matrix. These porphyroblasts overgrew S2, are ferro an and. commonly show internal zoning. In this photo, the large, apparently well-zoned, porphyroblast is now altered to quartz-sericite in the core with a fine-grained sericite rim around the margin. The scale bar at the bottom right is 2mm long.. (lCU Catalogue No. 48348).. Figure 5: Photomicrograph of strongly deformed Middle Vale Reef illustrating. coarse-grained sulphide (mainly pyrite) growth (Py) associated with the first mineralisation phase, which was subsequently fractured and overgrown by fibrous quartz (Qtz Fb.). Relict pieces of "dusty" massive quartz (Qtz) lie in the matrix surrounded by newly recrystallised (and inclusion-free) quartz. The scale bar at the bottom right is O.5mm long. (Sample MVR SM-l - Newcrest Mining; Telfer Geology Dept., Telfer Gold Mine).
(85)
(86) Figures. - Section C. Figure 6: Photomicrograph of a metasomatic aggregate within a fine-grained argillaceous unit. The aggregate consists of a cluster of coarse-grained quartz (Qtz), and occasionally albite, grains that exhibit a helicitic texture comprising fine-grained sericite, muscovite and dolomite inclusions, that parallel S2. The aggregates were replaced and overgrown by dolomite (Dol), followed by sulphide grains and aggregates (Sulph). The scale bar at the bottom right is 0.5mm long. (lCU Catalogue No. 48349). Figure 7: Photomicrograph of the lower margin of the MlO reef. Massive quartz veining (Qtz) is subsequently deformed (progressively intensifying towards the margin) and dynamically recrystallised. This was followed by grey ferro an dolomite (Dol), both as infill and replacement/alteration that overprints the recrystallised quartz boundaries and hence formed syn- to post-quartz deformation. Sulphide mineralisation (opaque) replaces the dolomite. Pervasive dolomite alteration also occurred in the wallrock (Dol). This was subsequently overprinted by further silicification (Si), coeval with chlorite-calcite alteration/veining, and resulted in textural destruction of the dolomite alteration front. The scale bar at the bottom right is 2mm long. (lCU Catalogue No. 48350). Figure 8: Photomicrograph of coarse-grained grey ferro an dolomite (Dol 1) truncated by veinlets of a second white-pink coloured opaque dolomite phase (Dol 2). Note the dirty colouration of large euhedral rhombic grains, which represents the first dolomite phase being replaced (RP) by the second, particularly along grain boundaries. The scale bar at the bottom right is 4mm long. (lCU Catalogue No. 48351).
(87)
(88) Figures. • Section C. Figure 9: Photomicrograph of an altered wallrock clast, within the massive quartz (Qtz) of the MIO illustrating the successive alteration history. The clast was. initially altered to dolomite (Dol) and fine-grained epidote, which was subsequently altered (pervasively) to chlorite, calcite and muscovite (Chl.Muse) accompanying sulphide (mainly chalcopyrite) deposition. Fine-grained micas scattered across the clast and along its margins are related to the second alteration phase. Elsewhere, these occur as thick clusters at reaction fronts along chalcopyrite grain margins. The scale bar at the bottom right is 0.5mm long. (JCU Catalogue No. 48350). Figure 10: Photomicrograph of coarse brecciation in the Telfer "deeps" illustrating. angular breccia clasts supported in an exotic grey ferroan dolomite-quartz matrix. Note the fine-grained euhedral epidote crystals (Ep) that rim the clasts and precipitated just prior to the dolomite (Dol). The breccia clasts are pervasively altered to epidote-sericite-grey dolomite. "Dusty" areas within the matrix are a second opaque dolomite phase that replaces/infills the earlier grey ferro an dolomite, particularly along grain margins. This second dolomite phase was accompanied by chlorite-calcite alteration. The scale bar at the bottom right is 2mm long. (Sample ST 18 - Newcrest Mining; Telfer Geology Dept., Telfer Gold Mine). Figure 11: Photomicrograph of coarse-grained ferroan grey dolomite veining (Dol). in the Telfer "deeps", which has been subsequently replaced by a second white opaque phase of dolomite (Dol 2). This second phase infilled/replaced along grain boundaries and as fine-grained veinlets that cross-cut the earlier coarsegrained dolomite matrix. The scale bar at the bottom right is 2mm long. (Sample ST 18 - Newcrest Mining; Telfer Geology Dept., Telfer Gold Mine)..
(89)
(90) Figures. • Section C. Figure 12: Photomicrograph of highly altered wallrock (first phase of dolomitesericite-epidote) cut by fine-grained quartz (Qtz) veinlets that contain sulphides (Sulph). Associated with these are silica alteration halos (Si) that overprint the. earlier wallrock alteration. Also associated with the silicification are fine-grained muscovite grains that grew within the silica, and along reaction fronts on sulphide grain margins. The scale bar at the bottom right is 2mm long. (Sample ST 17 - Newcrest Mining; Telfer Geology Dept., Telfer Gold Mine). Figure 13: Photomicrograph of a coarse-grained rhombic grey ferroan dolomite aggregate (DOL) with infilling sulphides (mainly chalcopyrite - Cpy). The sulphides replaced dolomite along grain margins, and infilled interstices. Dusty opaque areas represent the second opaque-white dolomite phase that replaced the earlier grey ferroan dolomite. The scale bar at the bottom right is 2mm long. (Sample ST 16 - Newcrest Mining; Telfer Geology Dept., Telfer Gold Mine).. Figure 14: Photomicrograph illustrating the main phase of sulphide deposition in the "deeps" and associated alteration. Anhedral sulphides (Sulph - mainly pyrite with late chalcopyrite) infill fractures in the pervasively altered rock matrix. Associated with this, were silica alteration fronts (Si) and fine-grained muscovite-sericite growth (Muse) that were concentrated into reaction fronts along sulphide grain margins and which overprint the earlier wallrock alteration (grey dolomite veining phase). The scale bar at the bottom right is 2mm long. (Sample ST 11 - Newcrest Mining; Telfer Geology Dept., Telfer Gold Mine)..
(91)
(92) Figures. - Section C. Figure 15:. Line diagrams (drawn from colour 35mm slide) illustrating the textural relationships between galena and pyrite. (A) Euhedral pyrite grains (Py) are overgrown by galena (Gn), both on the margins and infilling fractures in the pyrite. Small aggregates of chalcopyrite (Cpy) infill fractures in pyrite and replace galena. (B) Large pyrite grain overgrown on the rim by slightly later galena (lCU Caialogue No. A- 48352; B- 48353)..
(93) Gangue.
(94) Figures. - Section C. Figure 16: Line diagrams (drawn from colour 35mm slide) illustrating the textural relationships between galena and chalcopyrite. (A) Large grains of galena (Gn), including cubic forms, lie within a matrix of gangue minerals. Later chalcopyrite (Cpy). replaces the galena, particularly. along. galena-gangue. margins.. Chalcopyrite is also scattered throughout the gangue material, suggesting that some gangue also replaced the galena, which is consistent with the prominent embayed boundaries on the large galena grain. (B) Massive galena is replaced by anhedral clusters of chalcopyrite. Note the curvature of cleavage pits in the galena suggesting syn- to post-precipitation deformation. Chalcopyrite also shows embayed boundaries suggesting it may also have been replaced by galena. (lCU Catalogue No. A - 48352; B- 48353).
(95) .. ~. .. Cpy~. q. o. ". ..
(96) Figures. - Section C. Figure 17: Line diagram (drawn from colour 35mm slide) illustrating the textural relationship between pyrite and chalcopyrite. Early euhedral pyrite (Py) crystals contain small chalcopyrite (Cpy) inclusions, and are surrounded by anhedral chalcopyrite aggregates that also infilled fractures in the pyrite grains. (lCU Catalogue No. 48354). Figure 18: Line diagram (drawn from colour 35mm slide) of gold mineralisation within the MIO reef. Large gold grains (Au), surrounded by chlorite (ChI), precipitated within fractures in the quartz-dolomite reef matrix of the reef and were associated with chalcopyrite (Cpy)-calcite-chlorite veining. (lCU Catalogue No. 48354).
(97) ... ':--. ;. \,.. ). Gangue. ".
(98) Figures. - Sectiou C. Figure 19: Paragenetic diagram summarising the mineral paragenesis across the three suites examined in Main Dome. The upper section represents gangue/silicate minerals, whilst the lower illustrates sulphide/gold relationships. Dolomite 1 is the grey rhombic ferroan phase that was proceeded by a second white-pink opaque ferroan dolomite phase (Dolomite 2). The interpreted timing-relationships to regional metamorphic/deformation events is given across the top with the Xaxis indicating relative time (see text for discussion).. Figure 20: Timing relationships for Phase 1 massive quartz veining in the Middle Vale Reef. (A) Preservation of S 1 in quartz as fine-grained inclusions indicating late- to post-Dl silicification. (B) Intensification of shearing strain in the Middle Vale Reef (MVR) horizon, also observed by Veamcombe & Hill (1993), that rotated S2 and deformed round (now elliptical) carbonate spots that grew parallel to S2. (C) If silicification occurred prior to the strain intensification, S2 would have been prevented from being markedly rotated; instead it would have been deformed outside the MVR horizon. CD) Silicification post-dates strain intensification in the MVR thus preserving the deformed and rotated S2..
(99) Phase. DIID2 Metamorphism. Veining/brecciation Domal reactivation (D4) (D3 -D4). Late stage veining. Quartz Sericite Albite Muscovite Epidote Nontronite Dolomite (1). -. f--. -. Dolomite (2) Calcite Chlorite Scheelite Chalcedony. -. I-. Clays Hematite. Pyrite Pyrrhotite Galena Chalcopyrite Gold. -. - -'" -. -- -. t--. sw. NE . __&ff}~~~ ----. 52 cleavage rotation nd Cb spot elongation. -$. B Albite-carbonate spots. NE. c. D.
(100) Figures. - Section C. Figure 21: Summary of microstructural mineralisation/vein timing criteria for the Telfer deposit (drawn from observations made in thin section). (A) Main stage veining in the country rock truncates S2. Alteration halos associated with the veining, including coarse-grained muscovite, sulphide and carbonate rhombs overprint S2. (B) Breccia clasts containing S2 are rotated within the veins (e.g. van Dijk, 1986) thus veining is late- to post- S2 formation. (C) Metasomatic aggregate exhibiting a weak curvature of inclusion trails within either end. These correspond with a very weak seamy cleavage overprinting S2 at a high angle in the matrix; interpreted to be S3. Aggregate growth therefore occurred early in D3. (D) Aggregate growth parallel to a weak S3 crenulation cleavage, which overprints S2 at a high angle, indicating an early D3 timing. The aggregates were subsequently altered to calcite (stippled area) and then replaced by sulphide, thus mineralisation is syn- post-D3. (E) Weak wrapping (anastomosing) of matrix S2 around the metasomatic aggregates is consistent with renewed shortening of the matrix during D4. (F) Tensional cracking of the quartz, with subsequent deposition of calcite-dolomite (stippled) occurred during D4 shortening and; (G) these effects were overprinted by further sulphide/gold mineralisation..
(101) A. Qtz. c ",I'. 1,\. NE. /I:!!. S3. NE. "","'I6f)'. /. "',. ". I ' I , ' ". \1 \ I It I ) . I I .. '; (. I. I. , I" I. ". I. I. 1::\. :. 1. I. II, I' I. I. ,'< :li.. I I J \\. I. f. ii:.:. \1 "\1':;,:;. J. 11 '1 , / 'I/'/. I. f. J. I'. I. \. I. I. I. ,I. I. II II'$?. ". ,'/,/,,'/. '/111,1,. '.",. <:. 11/' I I. 1,",'i{1 " { , I ',I .)1. • •, .. I. "/1\,'. f. ,.d)' " I \ I'. 9"'II! 111/. :". /'. > ./.: ift>/. I. t. l'/I~I'II~,'llIJ. I. I. I. -. I. j~. '. ~ ~ ____ ----I II /1,"":'-__ -:.-- - -. --. SO. ~~-5. ~....----c:::::.. :;::;-0;::::.. SW. S-::t/. It. /1'. . I. ::,'. 1/. 1. I I I. I. I. I.::.,.. 11 I I ' :','. It. J. ::.'. ,',. I! \. muscovIte. I. I. I I:: , ,: .. , <f, " " 'rtft! I. J /:. 1/ 'lht2 ,/\lil ,11/'\11'. l"1 ,\1 /.; "'. 1\. 1 I . .. I I. mm. 5mm. L--J. L---I. ';1\\\\\11152. ' \II \\ ,\. I. NE. 11\ /. '1/'. :'. : \I. D4-'. 1'1':' ,.. II. t'. ',\. I. I,. :,I. II:.. E. o. D3 metasomatic \S2. SWI1\1/,,1 I" , , I ; 'I " I, : D3 hydrothermal I III, \~ •. 'f' i I\I. SW. ,I". .-D4. .- D4 -+. CallDol. 5mm. L--....J. \ \ \ \' \. \ ~I\. Py. CallDol. NE. SvV. F. 5mm. L..---1. G.
(102) Figures. - Section C. Figure 22: Photomicrograph and line diagram of timing relationships between aggregate growth and SO, S2 & S3 foliations. In this example S2 in the matrix is overprinted by a shallow crenulation fabric (S3) with a top-to-the-NE shear sense suggested by the crenulation asymmetry (inset A -line diagram). Strongly fissile bedding layers, cleaved by S2, were overprinted and crenulated by the subhorizontal S3 foliation, which is coarsely spaced (inset B - line diagram). The metasomatic quartz aggregates overprint S2 and grew parallel to S3 suggesting a syn-D3 timing. The aggregates were subsequently altered to carbonate (Cb) and pyrite (Py) indicating that mineralisation occurred syn- post-D3 deformation. Locally, bedding and S3 were reactivated by subsequent shortening during D4.. (lCU Catalogue No. 48355).
(103)
(104) Figures. - Section C. Figure. 23: Summary diagram of the macroscale structural indicators of. mineralisation timing in the Telfer deposit. Small inset illustrates the general fold asymmetry and hinge tightening, with concomitant brecciation (Bx), in many fold hinges throughout the Telfer Dome. This rotation and tightening is interpreted to be the result of refolding during D3. Other indicators are a set of right stepping shear zones in West Dome (West Dome Deeps) suggestive of late sinistral movement that is consistent with D4 shortening that was oblique (=25 0. clockwise from that during D2) to the Telfer Dome. Ds faults, such as the Graben Fault, overprint reef mineralisation, thereby development of reef mineralisation to between D2 and DS.. constraining. the. Figure 24: Summary plot of isotope data (data from Rowins et aI., 1992; Rowins, 1994) for the Telfer deposit. The data were collected from hydrothermal carbonate veins in the Telfer Deposit, with a suite from regional carbonate formations for comparison..
(105) D4 West Dome Deeps shear zones. D5 Graben Fault. oI. 10~----------------------------------------~. 5ODD. .0. p;.. [[] 0-. 0(0. 8. 0. o ·5 -. .10 -. •. - Hydrothermal vein carbonate from the Telfer Deposit.. 0. -. Carbonate equivalent (lateral zoning) of the MVR.. o - Isdeli/Puntapunta Formations (regional carbonate units). I <::). ...-. I. I I.(). <::). N. M.
(106) Figures. • Section C. Figure 25: Schematic diagram illustrating the differences in fluid-flow mechanisms during different deformation events. (A) The major deformation, D2, produced strong regional folding with an associated penetrative axial plane cleavage (S2). Consequently, fluid was distributed pervasively throughout the rock moving along grain contacts (opaque blobs) in both quartzites and pelites as well as cleavage (particularly in pelites). Fluid movement along axial plane cleavage would have been assisted by shearing on this foliation during D2. (B) In contrast to the. ~. event, late weaker deformations were less pervasive throughout the. rock sequence and produced only localised structural permeability through D3 gaped fold limbs (stippled; see Section D), veins and reactivated bedding/faults. Therefore, fluid movement (opaque blobs) would have been highly partitioned into these discrete zones.. Figure 26: Schematic representation of potential alteration zoning in Main Dome. The upper regions (hinge) of the dome are characterised by strong silicification of the reef horizons, whilst further away down the limbs carbonate alteration was prevalent. Silicification (early) in the upper regions probably prevented massive carbonate infiltration (subsequent) in these areas due to the reduction of permeability arising from silicification, thus producing structurally controlled hydrothermal zoning. This implies that ore-fluid flow was strongly channelled into individual reef horizons. Additionally, the silicification appears to have controlled sulphide-gold deposition as the best grades of mineralisation correspond with thick quartz veining in these horizons..
(107) sw. NE Penetrative cleavage actively shearing during 02 strain. ~2. NE. '\. Highly channelised fluid flow during 03/04--'. -;,.. .Silicification. B. D.l::... Dolomite/calcite alteration. sw. 500m. NE. <. D3.
(108) SECTION D. Progressive Structural Development of the Telfer Dome and Controls on Gold-Copper Mineralisation.. (FIGURES).
Figure
Related documents
