Classification of EEG Signals Using Sampling Techniques
and Least Square Support Vector Machines
Siuly1, Yan Li1, Peng Wen2,
1 Department of Mathematics and Computing, 2Faculty of Engineering and Surveying,
Centre for Systems Biology, University of Southern Queensland,
Toowoomba, QLD 4350, Australia {siuly, liyan, pengwen}@usq.edu.au
Abstract. This paper presents sampling techniques (ST) concept for feature extraction from electroencephalogram (EEG) signals. It describes the application of least square support vector machine (LS-SVM) that executes the classification of EEG signals from two classes, namely normal persons with eye open and epileptic patients during epileptic seizure activity. Decision-making has been carried out in two stages. In the first stage, ST has been used to extract the representative features of EEG time series data and to reduce the dimensionality of that data, and in the second stage, LS-SVM has been applied on the extracted feature vectors to classify EEG signals between normal persons and epileptic patients. In this study, the performance of the LS-SVM is demonstrated in terms of training and testing performance separately and then a comparison is made between them. The experimental results show that the classification accuracy for the training and testing data are 80.31% and 80.05% respectively. This research demonstrates that ST is well suited for feature extraction since selected samples maintain the most important images of the original data and LS-SVM has great potential in classifying the EEG signals.
Keywords: sampling techniques (ST), simple random sampling (SRS), least square support vector machines (LS-SVM), electroencephalogram (EEG).
1 Introduction
Sampling is one of the main important techniques in Statistics. For a given population, if the sample size is adequately taken then it can tell the characteristics of the population. There are different types of sampling techniques used in Statistics [12]. The application of these techniques depends on the structure of the population. In the field of brain signal classification, various techniques are used for feature extraction but ST has not yet been investigated to extract the features of EEG brain signals. As sampling is a representative part of a population, it is a natural expectation that it could be used to represent the EEG signal of human body. This expectation is achieved in this paper where simple random sampling (SRS) is used in two stages to select a representative EEG signal from the whole data set. Using SRS technique, we compress many data points into a fewer parameters which are called features. These features represent the behaviours of the EEG signals and particularly significant for recognition and diagnosis purposes.
In the past a few years, many researches have tried to apply different techniques for classifying of EEG signals. Among them, the framework of support vector machines (SVM) is becoming extremely popular in the field of statistical pattern classification. Least square support vector machines (LS-SVM) are the modified version of support vector machines. LS-SVM has been used different purposes such as for adaptive communication channel equalization [3], to study the nonlinear time series prediction [4], on Morlet Wavelet kernel function [5], for facial gender classification [6] and for measurement of soluble solids content of rice vinegars [7]. Although LS-SVM is significant, it has not yet being used for analyzing and classifying EEG brain signals. This paper proposes a LS-SVM technique in order to separate EEG signals between normal persons and epileptic patients during epileptic seizure where selected feature vectors are used as inputs for training and testing purposes. In this paper, ST is applied to select representative features from EEG signals and the selected features are then processed by LS-SVM method. A significant improvement in accuracy is achieved by using the LS-SVM on extracted features.
The outline of this paper is as follows: in Section 2, the data used in the present study has briefly described. In Section 3, ST is explained to detect features from the EEG signals and LS-SVM is described to classify EEG records. In this Section, different performance evaluation measurements are also defined. In Section 4, experimental results are discussed. Finally, conclusions are drawn concerning the classification methodology in Section 5.
2.
Data Description
3.
Implementation Methods
3.1 Feature Extraction by Sampling Techniques
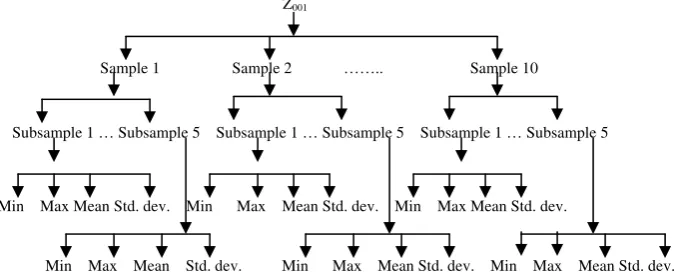
In this paper, SRS procedure is applied in two stages to highlight important features and to reduce dimensionality of the data. Here, 100 time series of 4096 data points are examined for each class. Two data sets, set A (normal persons with eye open) and set E (epileptic patients during epileptic seizure) are drawn on for EEG signals classification problem. Set A contains 100 data files, namely Z001, Z002 ,…, Z100 and each file has 4096 observations and set E also has 100 data files, denoted S001, S002 ,…,S100 containing 4096 data points in each file. At the first step, 70 data files from each class are randomly selected for the training data set and the rest 30 data files are used as the testing data set from each group. In the second step, 10 random samples of size 3285 are selected from each training and testing data, separately. In the third stage, we select 5 sub-samples of size 2742 from each of 10 samples (size 3285), which are obtained in the second stage for the training and the testing data. In each stage, the sample size is determined using an optimal sampling structure with 99% confidence interval considering 1% error. In the last stage, four statistical features, such as minimum, maximum, mean, and standard deviation are calculated from each sub-samples of size 2742. These features are used to reduce the dimensionality of the training and testing data and also to represent the valuable parameters for classifying the EEG signals. In this study, the training set consists of 700 feature vectors of 20 dimensions and the testing set is built up considering 300 feature vectors of 20 dimensions for each data set, respectively. MATLAB software package (Matlab version 7.4.0) is used for the experiments. Fig.1 shows how different samples, sub samples and statistical features are drawn from Z001 of the training data set A. In the same way, samples, sub samples and statistical features are selected from each training and testing data sets, respectively. Similar techniques are used in data set E.
Z001
Sample 1 Sample 2 …….. Sample 10
Subsample 1 … Subsample 5 Subsample 1 … Subsample 5 Subsample 1 … Subsample 5
Min Max Mean Std. dev. Min Max Mean Std. dev. Min Max Mean Std. dev.
[image:3.595.130.468.482.620.2]
Min Max Mean Std. dev. Min Max Mean Std. dev. Min Max Mean Std. dev.
3.2 Least Square Support Vector Machines
LS-SVM, a new kind of SVM [5], is gaining more and more attention, mostly because it has some very attractive properties, regarding the implementation and the computational issues of teaching. The LS-SVM solves a set of linear equations instead of a quadratic programming problem [3]. In this paper, LS-SVM with radial basis function (RBF) kernel proposed by Suykens [10] is used. The detail description of this method is avaiable in reference [10]. LS-SVMlab (version1.5) toolbox
(http://www.esat.kuleuven.ac.be/sista/lssvmlab/) for MATLAB is applied to perform the
classification of the EEG signals.
3.3 Performance Evaluation Measurements
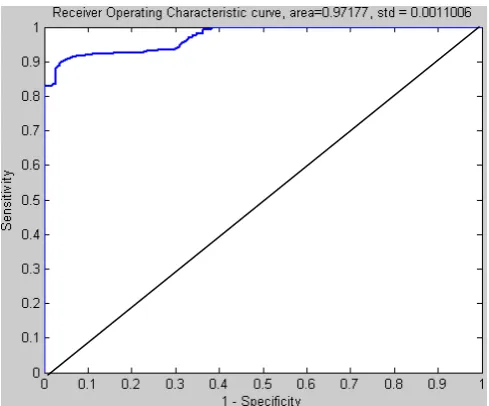
There are various types of methods for performance evaluation. In this study, different performance evaluation measurements are used for the analysis of EEG signals such as sensitivity, specificity and classification accuracy. Sensitivity is obtained through dividing the number of the true positive decisions by the number of the actual positive cases. Specificity is calculated through the number of true negative decisions divided by the number of the actual negative cases. Classification accuracy is obtained with dividing the number of the correct decisions by the total number of cases. These performance measurements have been calculated for the training and testing data described in Section 4. Receiver operating characteristic (ROC) curve has been drawn using the sensitivity and specificity values for demonstrating the performance of LS-SVM classifier.
4.
Results and Discussions
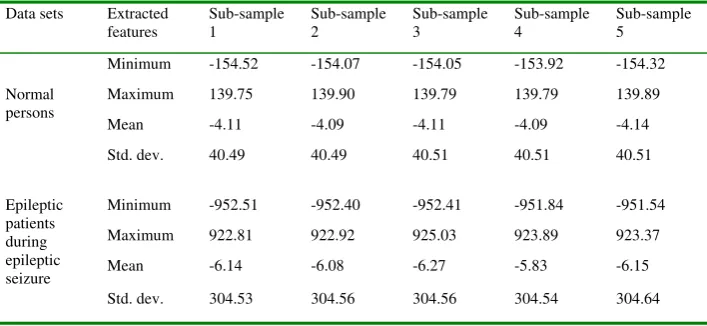
Table 1 displays the mean values of the extracted features of the EEG records for the training data set from the two classes. These statistical features of the five sub-samples of size 2742 are selected at the third stage (Section 3.1) from the EEG records of all the training data.
Table 1. The Mean Values of Extracted Features of the Training Data for Two Classes
Data sets Extracted
features Sub-sample 1 Sub-sample 2 Sub-sample 3 Sub-sample 4 Sub-sample 5
Minimum -154.52 -154.07 -154.05 -153.92 -154.32
Maximum 139.75 139.90 139.79 139.79 139.89
Mean -4.11 -4.09 -4.11 -4.09 -4.14 Normal
persons
Std. dev. 40.49 40.49 40.51 40.51 40.51
Minimum -952.51 -952.40 -952.41 -951.84 -951.54
Maximum 922.81 922.92 925.03 923.89 923.37
Mean -6.14 -6.08 -6.27 -5.83 -6.15 Epileptic
patients during epileptic seizure
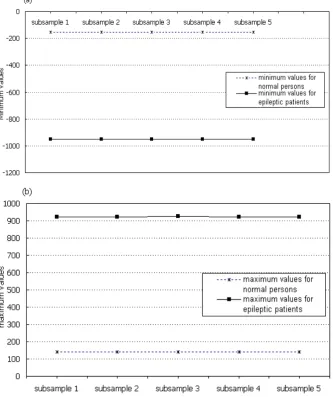
[image:4.595.122.476.531.694.2]Fig. 2. Comparison of EEG signals between normal persons and epileptic patients in respect of (a) minimum and (b) maximum values obtained from the mean values of extracted features of the training data from two classes.
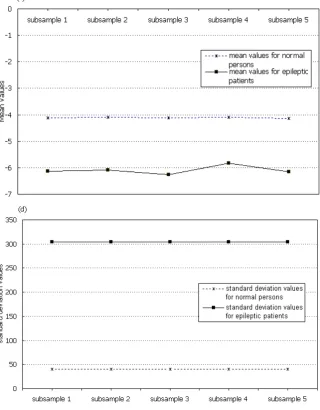
Fig. 3. Comparison of EEG signals between normal persons and epileptic patients in respect of (c) mean and (d) standard deviation values obtained from the mean values of extracted features of the training data from two classes.
Table 2 displays the sensitivity, specificity and classification accuracy of the LS-SVM classifier for the training and testing data, separately. Table 2 presents that nearly 87% specificity and 76% sensitivity are obtained for the training data and approximately 88% specificity and 75% sensitivity are achieved from the testing data. Classification accuracy for training data reaches 80.31% and for testing data is 80.05%. These results indicate that LS-SVM provides better classification accuracy for the training data than the testing data.
Table 2. Statistical Parameters for the Training and Testing Data Statistical Parameters Training data Testing data
Specificity (%) 86.67 87.70
Sensitivity (%) 75.81 74.97
Classification Accuracy (%) 80.31 80.05
ROC curve provides an analysis of the sensitivities and specificities when all possible sensitivity/specificity pairs for the full range experiment are considered. Fig. 4 displays the ROC curve to show the performance of LS-SVM for EEG recording data set of two classes. A good test is the one for which sensitivity (true positive rate) rises rapidly and 1-specificity (false positive rate) hardly increases at all until sensitivity becomes high [11]. ROC curve in Fig. 4 demonstrates the performance of LS-SVM on the training data. The best possible prediction method would be the point in the upper left corner or coordinate (0, 1) of the ROC space. From the ROC curve in Fig. 4, it is shown that all the points are located upper the diagonal line, which means all the data are successfully classified. The performance, therefore, indicates that the LS-SVM algorithm has effectively classified the EEG signals using the extracted features from the two class data sets.
[image:7.595.181.426.464.667.2]5.
Conclusion
In this paper we introduce SRS to extract features for classifying EEG signals in two classes. LS-SVM with RBF kernel is designed and implemented on extracted feature vectors obtained from the two classes. The classification accuracy of LS-SVM classifier is achieved 80.31% for the training data and 80.05% for the testing data. The results in this paper indicate that the ST is a better way for detecting features, which significantly represents the EEG signals and LS-SVM classifier can be used to classify the EEG signals accurately. This study focuses on the EEG spectrum-normal persons and epileptic patients during epileptic seizure. Our future work will include using other sampling techniques e.g. multistage sampling to incur the highest overall accuracy for feature extraction in EEG brain signals and obtained results will be compared with the existing methods.
References
1. Hazarika, N., Chen, J.Z., Tsoi, A.C., Sergejew, A.: Classification of EEG Signals
Using the Wavelet Transform. Signal Process, 59 (1), 61-72 (1997)
2. Adeli, H., Zhou, Z., Dadmehr, N.: Analysis of EEG Records in an Epileptic Patient
Using Wavelet Transform. J. Neurosci. Methods, vol. 123, no. 1, pp. 69-87 (2003)
3. Lin, C.J., Hong, S.J., Lee, C.Y.: Using Least Squares Support Vector Machines for
Adaptive Communication Channel Equalization. International Journal of Applied Science and Engineering, vol. 3, no. 1, 51-59 (2005)
4. Rui-Rui, X., Xing, B.G., Chen-Feng, G., Lun, C.T.: Discussion about Nonlinear Time
Series Prediction Using Least Squares Support Vector Machine. Commun. Theor. Phys., vol. 43, no. 6, 1056-1060 (2005)
5. Wu, F., Zhao, Y.: Least Square Support Vector Machine on Morlet Wavelet Kernal
Function and its Application to Nonlinear System Identification. Information
Technology Journal,vol. 5, no. 3, 439-444 (2006)
6. Quanhua, C.,Zunxiong, L., Guoqiang, D.: Facial Gender Classification with
Eigenfaces and Least Squares Support Vector Machine. Journal of Artificial Intelligence, 1 (1), 28-33 (2008)
7. Liu, F., He, Y., Wang L.: Application of Least Squares Support Vector Machine for
Measurement of Soluble Solids Content of Rice Vinegars Using Vis/NIR Spectroscopy. International Conference on Computational Intelligence and Security (2007)
8. Andrzejak, R.G., Lehnertz, K., Mormann, F., Rieke, C., David, P., Elger, C. E.:
Indication of Non Linear Deterministic and Finite-Dimensional Structures in Time Series of Brain Electrical Activity: Dependence on Recording Region and Brain State. Physical Review E, vol. 64, 061907 (2001)
9. EEG time series (2005, Nov.)[Online],
http://www.meb.uni-bonn.de/epileptologie/science/physik/eegdata.html
10. Suykens, J.A.K., Gestel, T.V., Brabanter, J.D., Moor, B.D., Vandewalle, J.: Least
Square Support Vector Machine. World Scientific, Singapore (2002)
11. Ubeyli, E.D.: Multiclass Support Vector Machines for Diagnosis of Erythemato-