promoting access to White Rose research papers
White Rose Research Online
Universities of Leeds, Sheffield and York
http://eprints.whiterose.ac.uk/
White Rose Research Online URL for this paper:
http://eprints.whiterose.ac.uk/7819/
Conference paper
Ruponen, M. and Tinker, J.A. (2007)
Novel method for measuring induction
rates.
In: Proceedings of the 10th International Conference on Air Distribution in
Rooms. Roomvent 2007, June 13-15, 2007, Helsinki, Finland. REHVA , Helsinki,
Finland. ISBN 978-952-99898-1-2
Novel method for measuring induction rates
Mika Ruponen and John A. Tinker
School of Civil Engineering, University of Leeds, UK
Corresponding email: [email protected]
SUMMARY
This paper introduces a new technique for measuring induction ratios for different nozzle and
combined flow geometries. The measurement technique only requires a single point velocity
measurement in the secondary air inflow and a static pressure measurement in the primary air
chamber. The design if the device allows the induction ratio to be determined for different
primary air nozzle arrangements with different geometries for combined air discharge outlets.
Experimentally measured data is compared with theoretical values. Four different sized
circular nozzles with different outlet geometries were used to supply primary air into the
device. The outlet geometries consisted of circular, slot and a rectangular shape. The results
showed that the outlet geometry has very little or no effect on the induction ratio. The most
important parameter in the induction ratio is the area ratio of the nozzle and the outlet.
INTRODUCTION
It is well a known phenomenon explained by jet theory as presented by Regensheit [1],
Baturin [2], Hagström, Sirén and Zhivov [3] and Awbi [4] that as a jet of air exits a nozzle
then entrainment of the ambient air takes place with a subsequent increase in flow volume.
This principle may also be exploited in ventilation devices whereby the primary supply air is
used to entrain room air through a finned coil or other type of heat exchanger where the room
air is either cooled or heated. The combined flow of primary air and ambient air is discharged
into the room via the outlet of the device. This paper presents a measurement method to
determine the induction ratio for a jet of air acting in a confined space such as the ventilation
ductwork in a building.
Devices utilizing the induction principle are also called jet pumps in which the main area of
interest is the pressure increase of the secondary (ambient) flow. The theory of jets pumps is
presented by Bonnington and King [5]. Donald and Singer [6] studied the entrainment of a
secondary fluid in a water tank where the nozzle and outlet tube was submerged and presented
a theoretical equation based on the nozzle and outlet diameter ratio. Ricou and Spalding [7]
developed a technique to measure the local entrainment of round jets at different distances
downstream of the nozzle.
A new method is proposed in this paper that is simple and accurate. The design of the measurement device is presented together with its mode of operation and calibration procedure. Measurements are made using different sized jet nozzles and outlets. Measurements are also made using slot and rectangular shaped outlets and results are compared with theoretical models.
METHOD
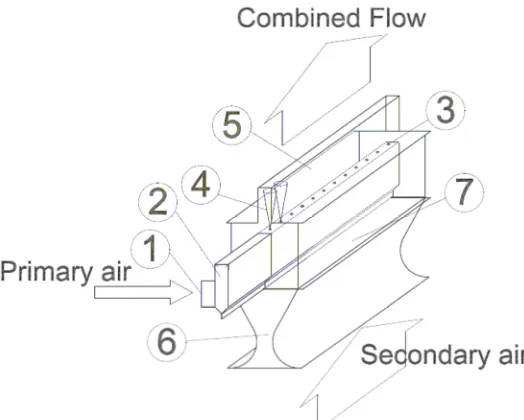
[image:3.612.174.436.287.497.2]A measurement device, later called an Induction Measurement Device (IMD), was developed as shown in figure 1 in which the primary air supply to the device was supplied via a spigot (1) into a chamber (2) which had holes to enable static pressure to be measured. Changeable plates (3) were installed on the top on the chamber which incorporated the primary air nozzles. The nozzles jetted primary into a mixing chamber (4). A combined flow outlet (5) was located at a specified distance away from the nozzles. The secondary air flow into the device was via an inlet (6). The device also had a housing to control the secondary air flow (7) but this was not used in this study.
Figure 1. Construction of the induction measurement device.
th
ro
a
t
W
id
th
(m
m
[image:4.612.97.294.73.211.2])
Figure 2. Geometry of the nozzle
80
60
40
SQRT(Ax/Ai)
2 3 4 5 6 7 8 9 10
Induction Qx/Qi
Figure 3. Induction ratios for different secondary air inlet throat widths
The design of the IMD also allowed adjustments to be made to the distance between the nozzle and the start of combined flow outlet. The distance was set to allow for maximum divergence of the primary air jet prior to it entering the combined flow outlet zone.
CALIBRATION
[image:4.612.112.396.255.388.2]a) b)
Figure 4 a) Measurement of static pressure inside the primary air chamber, b) Velocity measurement at the secondary air inlet throat
[image:5.612.88.525.65.249.2]The primary air flow through the nozzles was calibrated using an orifice plate. Correlation between the measured flow rate at the orifice plate and measured static pressure in the chamber was established and used to determine the actual primary air flow rate.
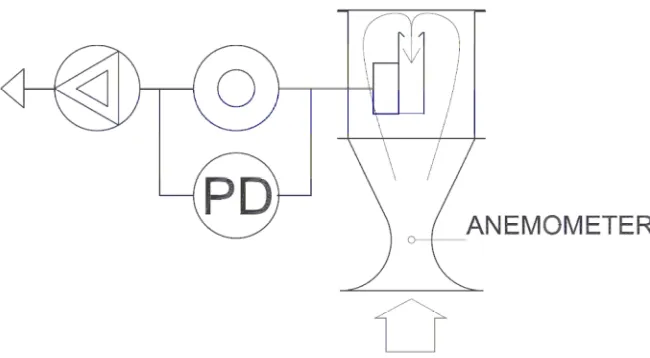
Figure 5. Secondary flow measurement calibration arrangement
The operation of the primary air chamber was reversed to enable the secondary air flow calibration as shown in Figure 5. Instead of supplying air to the chamber it was used to extract air from inside the device. The combined flow outlet was removed from the device and replaced by piece of sheet metal to ensure that the airflow into the device was only through the secondary air inlet. The volume flow of the extracted air was measured using an orifice plate and pressure differential meter. The volume flow was controlled using a frequency converter controlled fan. A unidirectional anemometer was used to measure the air velocity at the centre of the throat at three different longitudinal locations as shown in figure 4b. Air-tightness in the device was ensured by taping all the joints with duct sealing tape.
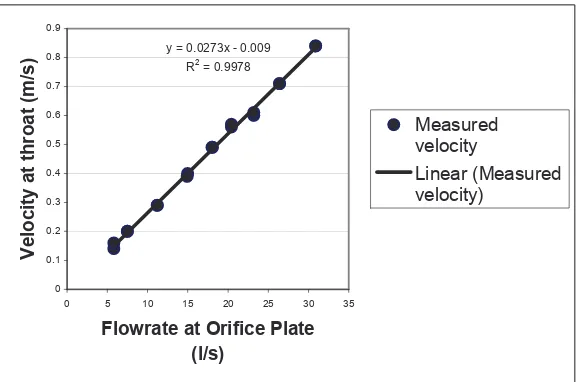
[image:5.612.144.469.343.522.2]procedure was then repeated but in the reverse order. The results are given in figure 6 which shows the correlation between the velocity reading at the secondary air inlet throat and the volume flow extracted through the orifice plate.
y = 0.0273x - 0.009 R2 = 0.9978
0 0.1 0.2 0.3 0.4 0.5 0.6 0.7 0.8 0.9
0 5 10 15 20 25 30 35
[image:6.612.163.454.120.311.2]Flowrate at Orifice Plate (l/s) V e lo c it y a t th ro a t (m /s ) Measured velocity Linear (Measured velocity)
Figure 6. Correlation between throat velocity and volume flow.
MEASUREMENTS
Measurement procedure
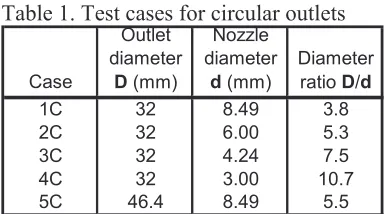
Induction ratio measurements were made for circular combined flow outlets according to Table 1. In the table, the letter C after case number stands for a circular combined flow outlet geometry. Test cases for rectangular shaped combined flow outlets were made according to Table 2. Letter L after the test case number stand for the slot type combined flow outlet geometry in which several nozzles supply into one rectangular or slot outlet. Letter R stands for the combined flow outlet part in which a single nozzle supplies a rectangular shaped outlet.
Table 1. Test cases for circular outlets
Outlet Nozzle
diameter diameter Diameter
Case D (mm) d (mm) ratio D/d
1C 32 8.49 3.8
2C 32 6.00 5.3
3C 32 4.24 7.5
4C 32 3.00 10.7
5C 46.4 8.49 5.5
[image:7.612.92.285.67.174.2]Each test case was allowed to stabilize for a period of five minutes before any measurements were recorded. After this, the air velocity was recorded over five by three minute periods and averaged.
Table 2 . Test cases for rectangular outlets
Outlet Nozzle Outlet Nozzle Nozzle
width spacing area diameter area SQRT
Case (mm) (mm) (mm2) d (mm) (mm2) (Ax/Ai)
6L 25 25 625 6.00 28.27 4.7
7L 25 50 1250 6.00 28.27 6.6
8R 50 48 2400 6.00 28.27 9.2
Theoretical results
The induction of ambient air into a jet is relative to the distance in outlet diameters and is constant regardless of the physical size of the jet. Therefore a small nozzle will induce more ambient air for same physical distance [1- 4]. This is also in agreement with Donald and Singer [6] who obtained a correlation between mass flux and nozzle diameter by assuming that the momentum across any radial section of a jet cone equals that at the nozzle exit. The resulting equation may be expressed as:
Q
xV
x=
Q
iV
i (1)Where
-Qx is combined volume flow rate (l/s);
Vx is combined volume flow velocity (m/s) and with subscript i is the same for the initial conditions at the nozzle exit. From continuity of flow, the following equations are obtained:
4Qx and 4Qi
Vx = 2 Vi = 2 (2 and 3)
πD πd
Where œ
D is diameter of combined flow outlet (mm) d is nozzle diameter (mm).
By combining equations 2 and 3
-Qx D
= (4)
In this study a further assumption is made in that the diameter relationship should comply with the rectangular shapes area ratio under the square root as follows -.
Qx Ax
= (5)
Qi Ai
Where œ
Ax is the cross sectional area of the combined flow outlet (mm2 ) and Ai is nozzle cross sectional area (mm2 ).
Equations 4 and 5 were then used to calculate the theoretical induction ratios for different geometries. In the figures 6 and 7 the measured and theoretical results from equations 4 and 5 are compared.
RESULTS
Test cases 1 œ 5 were all made using a circular outlet. The tests were started using circular combined flow outlets to minimize the uncertainty that other geometries may have had on the results. Test cases 6 and 7 were made using slot type combined flow outlets in which each slot was supplied by several nozzles. In cases 6 and 7 the same size outlet part was used, but the nozzle spacing was different. In these cases the divergence of the jet in the longitudinal direction was limited by the air flow from an adjacent jet. For maximum divergence in that direction, nozzles were spaced at 25mm and 50mm as presented in Table 2. In the cross-wise direction, the combined flow outlet walls limited any divergence. In test case 8, the combined flow outlet was partitioned into small rectangles so that the divergence of the jets was limited by the enclosing walls.
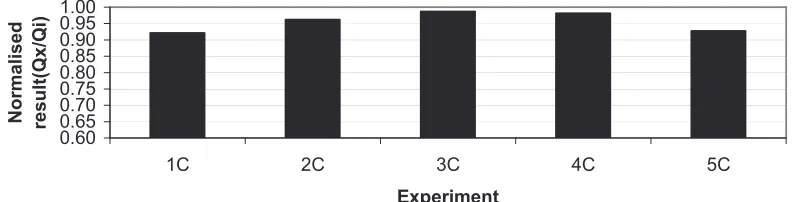
The results of different test cases are presented in Figures 7 and 8. The induction ratios are presented after being normalized (i.e. the measured results are compared to theoretical results using Equation 4 for circular outlets and Equation 5 for slots and rectangular outlets).
0.60 0.65 0.70 0.75 0.80 0.85 0.90 0.95 1.00 N o rm a li s e d re s u lt (Q x /Q i)
1C 2C 3C 4C 5C
[image:8.612.104.502.536.637.2]Experiment
Figure 7. Normalized measurement results for circular outlets
N o rm a li s e d re s u lt (Q x /Q i)
loss of momentum occurred in the form of a flow restriction. For test cases 1 to 4 results are approaching the theoretical value as the size of the nozzle reduces. This might be due to lower momentum loss. Even though smaller nozzle sizes have higher induction ratio for the same combined flow outlet geometry, the actual volume flow of the secondary air is less. This would result in lower flow restrictions and therefore better agreement with the theoretical results.
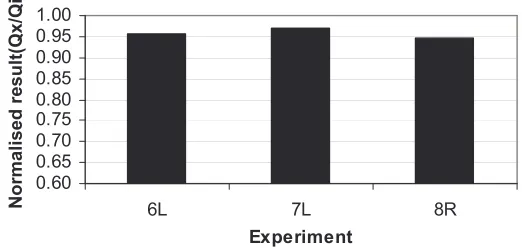
Results for the slot and rectangular outlets are shown in Figure 8 and are very similar to those obtained for circular outlets. The experimental results are again in good agreement with theoretical values. In test case 8, the measured value is slightly lower than for cases 6 and 7. A possible explanation of this could be the increase in friction effected by the partitioning walls in the combined flow outlet.
1.00 0.95 0.90 0.85 0.80 0.75 0.70 0.65 0.60
6L 7L 8R
[image:9.612.103.364.246.371.2]Experiment
Figure 8. Normalized measurement results for rectangular outlets
CONCLUSION
In this study, a novel method for induction measurement has been presented. The theoretical results are based on the assumption of constant momentum at the nozzle and exit plane of the of the combined flow outlet. Experimental results show good agreement with theoretical but tend to be slightly lower but within 0.92 œ 0.99. There can be many reasons for this
discrepancy, but the most likely is the flow restriction that occurs under all flow conditions in the conduit. The results presented for the circular outlets in figure 7 show a clear trend of higher nominal induction rates for reducing nozzle size. For the smallest nozzle, the mass flow rate through the device is the smallest and hence the flow restriction is also the smallest.
The effect of outlets geometry has also been presented in the paper and the results clearly show that the shape of the cross section of the outlet has very little or no effect on the induction ratio. The diameter ratio of the nozzle and the outlet can be clearly be extended to cover other shapes when the square root ratio of the outlet and nozzle area are used as proposed in equation 5.
ACKNOWLEDGEMENT
REFERENCES
1. Regenscheit, B. 1970. Die Archimedes-Zahl Kenzahl zur Beureilung von Raumströmung.
Gesundhheits Ingenieur 91(6).
2. Baturin, V. V. 1972. Fundamentals of industrial ventilation, 3rd English edition. Pergamon press.
New York.
3. Awbi, H. B. 1991. Ventilation of Buildings, Routledge. London. U.K.
4. Hagström, K. Siren, K. Zhivov, A.M. 1999. Calculation methods for air supply design in
industrial facilities. Helsinki University of Technology, HAVC Laboratory, Report B60, Finland
5. Bonnington S.T., King A.L., (1972), Jet Pumps and Ejectors; A State of Art Review and
Bibliography; Second Revised Edition, BHRA Fluid Engineering, England
6. Donald, M. B., Singer, H. 1959. Entrainment in Turbulent Fluid Jets. Transactions of Institution
of Chemical Engineers. U.K.
7. Ricou, F.B. Spalding, D. B. 1961. Measurements of Entrainment by Axisymmetrical Turbulent
Jets. Journal of Fluid Mechanics. Volume 11. pp. 21-32, U.K.
8. BS 4954-1. 1973. Testing and rating induction units for air distribution systems œ Part 1. British
Standards Institution. London. U.K.
9. ISO 5167-1. 1991. Measurement of fluid flow by means of pressure differential devices œ Part 1.