This is a repository copy of Immigrant Labour Market Assimilation and Arrival Effects: Evidence from the Labour Force Survey .
White Rose Research Online URL for this paper: http://eprints.whiterose.ac.uk/9911/
Monograph:
Clark, K. and Lindley, J. (2005) Immigrant Labour Market Assimilation and Arrival Effects: Evidence from the Labour Force Survey. Working Paper. Department of Economics, University of Sheffield ISSN 1749-8368
Sheffield Economic Research Paper Series 2005004
[email protected] https://eprints.whiterose.ac.uk/
Reuse
Unless indicated otherwise, fulltext items are protected by copyright with all rights reserved. The copyright exception in section 29 of the Copyright, Designs and Patents Act 1988 allows the making of a single copy solely for the purpose of non-commercial research or private study within the limits of fair dealing. The publisher or other rights-holder may allow further reproduction and re-use of this version - refer to the White Rose Research Online record for this item. Where records identify the publisher as the copyright holder, users can verify any specific terms of use on the publisher’s website.
Takedown
If you consider content in White Rose Research Online to be in breach of UK law, please notify us by
Sheffield Economic Research Paper Series
SERP Number: 2005004
Ken Clark and Jo Lindley*
Immigrant Labour Market Assimilation and Arrival Effects:
Evidence from the Labour Force Survey
January 2005
* Corresponding author
Department of Economics
University of Sheffield
9 Mappin Street
Sheffield
S1 4DT
United Kingdom
Abstract
We estimate models of earnings and employment outcomes for a sample of white and non-white male immigrants drawn from the Labour Force Survey between 1993 and 2002. Two hypotheses are investigated: (i) whether immigrant outcomes assimilate towards those of natives and (ii) whether labour market conditions at time of entry to the UK labour market have a permanent impact on outcomes. We find positive earnings assimilation for all immigrant groups and strong employment assimilation for those immigrants who complete their education in the UK. We find negative employment assimilation for South Asian immigrants who completed their education overseas. There is some evidence of unemployment rates at time of entry to the labour market causing permanently lower earnings for non-white immigrants.
Keywords: immigrants, assimilation, earnings, employment.
JEL numbers: J23, J7.
1. Introduction
The labour market performance of immigrants is central to political and public discourse on
immigration policy in the UK. In 2001 around 8.3 percent of the UK population were born
abroad and the Treasury has estimated that net migration contributes 0.5% to the economic
growth rate.1 Recognising the contribution that immigrants make to the economy, the government has endorsed future controlled and selective immigration. Equally, in response to
perceived public concerns about the scale of immigration and the motivation of immigrants,
the government has emphasised that immigrants should not be dependent on the state. In the
Prime Minister’s view, “All those who come here to work and study must be able to support
themselves”2 How immigrants fare in the labour market is important both for their ability to support themselves and for their contribution to the wider economy, hence in this paper we
analyse the earnings and employment outcomes of immigrants observed in the UK labour
market over the period 1993-2002.
We focus on two key hypotheses from the literature. The first is that, after arrival in the host
country, immigrant labour market outcomes will adjust towards those of non-immigrant or
native workers. This view is often known as the assimilation hypothesis and has received
much attention from economists3. Assimilation is thought to take place through human capital enhancement: immigrants acquire skills that are specific to the destination country,
including knowledge of the labour market and language proficiency, allowing them to
improve their labour market outcomes relative to natives. The longer the process of
1
The population figures were taken from the 2001 Census available from the Office for National Statistics website at http://www.statistics.gov.uk.
2
Prime Minister’s speech to the Confederation of British Industry, April 27th, 2004. The full text is available at http://www.pm.gov.uk/output/Page5708.asp.
3
assimilation takes, the less successful any cohort of immigrants is likely to be at any given
time since arrival.4
The second hypothesis we examine is the view that current labour market outcomes for
immigrant workers are influenced by labour market conditions when they arrived in the UK.
Labour economists often argue that early experiences of unemployment can permanently
increase an individual worker’s risk of unemployment and reduce their future earnings. This
is called the ‘scarring hypothesis’ (see Arulamapalam et al. (2001) for a recent symposium)
and may be relevant for immigrants arriving in a foreign labour market. Scarring can occur
for a number of reasons. On the supply side, unemployment spells lead to a loss of
firm-specific and general human capital. On the demand side, where information is incomplete,
employers may use past unemployment events as a signal of low productivity. This latter
mechanism may be particularly important for immigrants if employers are relatively ignorant
of the qualifications and skills of workers arriving from overseas. The tendency of
immigrants to cluster in particular geographic areas may also lead us to observe effects
consistent with scarring if those areas are persistently depressed and the compensating
benefits of co-ethnic proximity restrict geographic mobility.
We look for evidence of assimilation and scarring effects using a sample of native and
immigrant workers from the UK’s Labour Force Survey (LFS). The labour market outcomes
that we focus on are real weekly earnings and employment and we divide our sample of
immigrants along two dimensions. First, to account for well-documented racial differences in
4
labour market outcomes, we examine white and non-white immigrants separately. There is
considerable evidence that non-whites receive differential treatment in the UK labour market
(Blackaby et al. (2002) is a recent example) and separating the distinct contributions of
immigrant status and ethnicity is important. Second, and more unusually, we compare
immigrants who arrive in the UK to enter the labour market, having completed their education
at some time in the past, with those who arrive to complete their education in the UK and
subsequently enter the labour market. We call this first group “labour market entrants” and
the latter group “education entrants”. Note that the group of education entrants includes
foreign-born children who arrive with their parents as well as adults who arrive to undertake
education in the UK.
Clearly, compared to labour market entrants, those who enter education are affected
differently by the two labour market hypotheses outlined above. Kossoudji (1989) makes the
important distinction between labour market assimilation and pre-labour market assimilation.
For the education entrants, assimilation consists of labour market assimilation (time spent
after leaving full-time education) and pre-labour market assimilation (in the UK education
system). Most investigators of the assimilation hypothesis exclude those who arrive as
children or with incomplete education from the estimation sample; they therefore focus on
labour market assimilation. We explore whether, given their earlier exposure to the language
and culture of the UK, such education entrants have outcomes which are closer to their native
counterparts than to those immigrants who enter the labour market directly. Education
entrants represent around one half of all immigrants in our sample - excluding them risks
Our work builds on previous UK studies which have used cross-section survey data to paint a
picture of immigrant labour market performance. In an early paper Chiswick (1980) used a
single cross section of the General Household Survey (GHS) and found that white immigrants
earned as much as their native counterparts but that there was, other things equal, a 25%
earnings penalty for non-white immigrants. He found no statistically significant role for years
since migration, controlling for other things. Shields and Wheatley Price (1998) also
examined earnings and used LFS data from 1992-94. Like Chiswick they found earnings
differences between white and non-white immigrants. They also emphasised the differential
returns to human capital acquired in the home country compared to the host country, with UK
human capital generally better rewarded in the UK labour market. Using the same data
Wheatley Price (2001) examined the unemployment experience of immigrants and found that
more recent immigrants had higher unemployment rates than previous arrivals.
None of these studies attempts to separate the effects on labour market outcomes of changes
in the quality of immigrant cohorts from that of years since migration, however this is a
requirement of testing the assimilation hypothesis. In this sense our work is closer to Bell
(1997) and Dustmann et al. (2003) each of which used pooled cross section data to create a
‘synthetic panel’ of immigrant and native workers. Bell (1997), using GHS data from
1973-92, found positive assimilation for non-white immigrants and negative assimilation
(dis-assimilation) for white immigrants. That is to say, whites were predicted to arrive with higher
earnings than natives but this advantage eroded through time. Dustmann et al. (2003) using
LFS data from 1992-2000 distinguished immigrants by ethnicity and by region of origin.
Wages were broadly predicted to rise with time in the UK for non-white immigrants (positive
assimilation) and for whites from the British Commonwealth. There was strong evidence of
examined other labour market outcomes including employment rates where they found that
non-white immigrants assimilate towards native levels from an initially inferior position.
Compared to previous work the innovative features of our research are the following. First,
we use a larger sample of more recent data. Second, and as far as we are aware for the first
time using UK data, we investigate the impact of arrival year effects on immigrant earnings
and employment. Third, we make the (it turns out) important distinction between those
immigrants who arrive with their education complete and those who enter the education
system. Finally we employ a semi-parametric estimator, which places fewer restrictions on
the estimated assimilation profiles than previous work.
Amongst our key findings are:
• positive earnings assimilation for virtually all immigrant groups;
• strong employment assimilation for those immigrants who completed their education
in the UK;
• negative employment assimilation for South Asian immigrants who completed their
education overseas, and
• some evidence of unemployment rates at time of entry to the labour market causing
lower earnings for non-white immigrants.
The remainder of the paper proceeds as follows. Section 1 gives an overview of the data
while section 2 describes the econometric methods. Section 3 discusses the results and
2. The Data
The data are drawn from the Labour Force Survey (LFS), conducted by the Office for
National Statistics (ONS), and represent pooled cross-sections over the period 1993-2002.
The LFS collects information on earnings, employment and socio-economic characteristics
such as age and years of schooling. Further details on the sampling methodology and
questionnaires are available from the ONS.5
Our first labour market outcome of interest is real gross weekly pay in main job and we
analyse male, full-time workers aged between 16 and 65 at the time of interview6. Our second labour market outcome is whether the survey respondent was employed for pay at the
time of the interview. In all the results employment rates are expressed relative to a
denominator comprising the employed and the unemployed; in other words, the
self-employed and inactive are excluded from the analysis. Overall after excluding observations
with missing data and trimming outliers we have a sample of 148,528 native and 9,454
immigrant men.
An important component of the analysis is the distinction between those who enter the UK
having completed full-time education (labour market entrants) and those who have yet to
complete (education entrants). This requires dividing the sample based on information about
the year in which individuals left full time education and their year of arrival in the UK. We
make the assumption that education is obtained in a continuous block before (potential) labour
market experience is accrued. This is the standard assumption in the human capital
5
http://www.ons.gov.uk 6
literature.7 It is also worth noting that we adopt another standard convention of human capital studies: since we do not observe panel data or work histories, labour market ‘experience’ is in
fact potential experience.
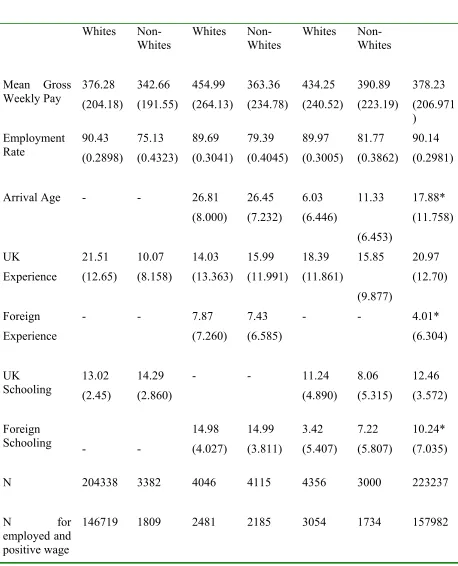
Table 1 provides sample means and standard deviations for some key variables by immigrant
and ethnic status (white or non-white). We also further divide our white and non-white
samples into labour market entrants and education entrants. The latter of course will have
some UK education and may have some foreign education, but have no foreign labour market
experience. Labour market entrants, by contrast, will have no UK schooling but may have
foreign schooling and foreign experience8. Native born men, white and non-white, are included for comparative purposes.
Comparing mean earnings, immigrants fare better than natives on average and whites better
than non-whites. White labour market entrants earn more on average than white education
entrants, although the reverse is true for non-whites. Comparing employment rates, relative to
white natives, all immigrants exhibit lower employment rates. Non-whites tend to under
perform whites in all cases and for non-whites, education entrants do substantially better than
labour market entrants.
7
Of course one could easily imagine an immigrant working either in the origin or destination country for some period before undertaking education in the destination country. Without more detailed panel or life history data it is very difficult to ascertain whether this is the case for any sample member. We can, however, examine the age at which individuals left full time education; if this is implausibly high then the assumption of a single continuous period of education may well be flawed. In the LFS data, the proportion of such workers was relatively small hence we proceed to make the standard assumption.
8
For natives, mean potential labour market experience is considerable larger for whites than
non-whites (non-whites are younger on average), whilst mean years of schooling are less for
whites compared to non-whites. For immigrants, white labour market entrants have less UK
labour market experience than their non-white counterparts, although their years of foreign
experience and schooling are the same. For education entrants whites have more UK
potential experience, more years of UK schooling and less years of foreign schooling
compared to non-whites. Not surprisingly, immigrants who arrived with their education
complete were older on arrival than those with education incomplete. Although for the latter
whites were younger on arrival than non-whites.
3. Modelling framework
Our investigation of immigrant labour market outcomes is based on the following
econometric model:
Zi = f(Yi) + Ci + Si + xiβ + i i = 1,…, n (1)
In equation (1), Z represents a measure of labour market status, Y is years since migration, C
is immigrant cohort, S is survey year (year in which the individual was observed), x is a
vector of other explanatory variables including human capital and is an error term.
Two measures of labour market status (Z) are used - real weekly wages in logarithmic form
and a discrete dependent variable taking the value 1 if the individual is employed and the
value 0 if they are unemployed. We follow the recent literature, particularly Dustmann and
Fabbri (2003) and Antecol et al. (2003), in two regards. First, given the difficulty of finding
identifying exclusion restrictions, we do not attempt to correct for sample selection bias in
if it is thought that selection bias is a problem. Second, in order to make computation of the
semi-parametric estimates more tractable, we use a linear probability model, rather than a
probit or logit, to analyse employment status. There turns out to be little difference in the
estimated marginal effects of the explanatory variables if a probit model is employed instead.
The years since migration variable Y will capture assimilation effects - how immigrant
earnings change with length of residence in the host country. The specification of the
function f(Y) is discussed in the next sub-section. C is the immigrant cohort to which an
individual belongs (thought of here as year of arrival) and captures otherwise unobserved
differences in immigrant cohort quality over time. It has been argued that cohort quality
changes have been important in explaining immigrant earnings performance in the US and
UK. For example, Borjas (1985) suggests that a secular decline in the quality of immigrant
cohorts to the US explains the relatively poor performance of some immigrant groups while
Bell (1997) using UK data emphasises how the different national origin mix of immigrant
waves has affected the overall picture of immigrant earnings. We model C using dummy
variables for decade of arrival but, since cohort effects are not central to our work, we do not
discuss the results in detail. It turns out that there are no clear, statistically significant,
patterns in the cohort dummies in the estimated models.
In order to identify cohort and assimilation effects separately it is necessary to have
observations at different points in time. Panel data would be ideal however, like most studies
of immigrant earnings, we have to make do with pooled cross section data, sometimes called
the ‘synthetic panel’ approach. The variable S reflects when the individual was observed and
The vector x contains other worker characteristics including human capital. We distinguish
between human capital (education and potential experience) obtained in the UK and that
obtained before arrival in the UK. It also contains marital status, region of residence and,
where appropriate, industry of employment.
For both labour market outcome measures we estimate separate equations for the following
four groups: (i) white labour market entrants , (ii) non-white labour market entrants (iii) white
education entrants (iv) non-white education entrants. It is worth noting that most previous
studies of immigrant assimilation do not estimate separate regression models for immigrants
and natives but rather pool the two groups of workers and allow certain coefficients to vary by
immigrant status. Two additional models for white natives and non-white natives are also
estimated for comparison purposes.
3.1 Modelling Assimilation
Not all of the parameters of equation (1) can be estimated since there is perfect
multicollinearity: S C + Y. In line with previous studies of immigrant assimilation we
adopt the normalisation of fixing the coefficient on S ( - the secular wage growth effect) and
estimating the effects of C and Y freely. An estimate of can be obtained from the sample of
native workers thus the constraint is equivalent to assuming that the period effect is equal for
natives and immigrants.
With respect to the specification of the function f(Y), most studies impose a non-linear
or divide Y into categories and use dummy variables to represent the categories (Antecol et
al., 2003). Since the shape of f is key to the measurement of assimilation we adopt a slightly
different approach, which imposes somewhat less structure on the model. Specifically we
estimate a semi-parametric version of (1) using a partially linear model (Yatchew, 2003).
Consider rewriting equation (1) as:
Zi = wi + f(Yi) + i i = 1,…, n (2)
where the vector w includes C, S and x from equation (1). The function f is assumed simply
to be some smooth function of years since migration. The data are ordered by Y and
quasi-differenced according to the formula:{wi – wi-1}/√2. Consider the estimated regression on
differenced data
1
ˆ ( ' ) '
D D D D D
−
ξ = W W W Z (3)
where WD is a matrix of quasi-differenced individual observations on the explanatory
variables (excluding Y) and ZD is the equivalent for the dependent variable. Yatchew (2003)
shows that
and that kernel regression methods applied to the ordered pairs {Zi – wiξˆD, Yi} yield a
consistent semi-parametric estimator of the function f. In the empirical application, the
non-parametric estimation was done using a Nadaraya-Watson kernel density estimator
implemented using a modified version of the Stata module kernreg1. We used a Gaussian
kernel and began from a bandwidth chosen according to the formulae in StataCorp. (2001, p.
167). The bandwidth was then adjusted (invariably upwards) to give an appropriate degree of
smoothing. The results were not particularly sensitive to choice of kernel function and were
qualitatively similar to results obtained using other smoothing techniques.9
In terms of the amount of structure imposed on the data, the semi-parametric estimator can be
thought of as lying somewhere between a polynomial in Y and modelling each year since
migration with a dummy variable. The former imposes a smooth shape on the function but is
restrictive in the sense that it requires symmetry around the function’s turning points while the
latter imposes no smoothness on the function but may, in a finite sample, be susceptible to
sampling error.
3.2 Modelling Arrival Effects
To investigate the impact of economic conditions at time of arrival to the UK we replace the
cohort dummies in (1) with two variables. The first is the male unemployment rate for the
UK in the year of entry to the labour market while the second is the rate of GDP growth. The
unemployment rate has been used in a number of studies including Chiswick et al. (1997) and
9
One further issue with the semi-parametric approach arises from the quasi-discrete nature of the variable Y
Chiswick and Miller (2002) for the US, and Aslund and Rooth (2003) for Sweden.
Conceptually this captures the essence of the scarring hypothesis. We have also included the
growth rate to investigate whether more general economic conditions at arrival have any
impact on future earnings and employment opportunities (Stewart and Hyclak (1984) do this
for the US). The ‘macro’ variables pertaining to the year in which the immigrant entered the
labour market are entered into the regression model: this is year of arrival for labour market
entrants and year left full-time education for education entrants. Following Chiswick et al.
(1997), we also experimented with entering an average unemployment or growth rate based
on a 3-year moving average centred on the year of entry to the labour market plus one.
4. Results
4.1 Assimilation
To discuss the results of our regressions pertaining to the assimilation hypothesis, we note
first that the variable Y in equation (1), representing years since migration, has a quite
different interpretation depending on whether an immigrant is a labour market entrant or an
education entrant. For those who enter the labour market, Y is identical to years of potential
UK labour market experience and whether or not such an immigrant assimilates towards the
labour market status of a similar native is a function of how labour market outcomes depend
on UK experience. For those who complete their education in the UK, years since migration
is some combination of years in the UK education system plus years of UK potential labour
market experience. Hence assimilation for this group will depend on their labour market
Thus a good place to start understanding how immigrant outcomes adjust with length of time
in the UK is to examine returns to human capital for immigrant and native groups. Table 2
provides estimates of the returns to immigrant and native human capital in the UK labour
market over the period 1993-2002.
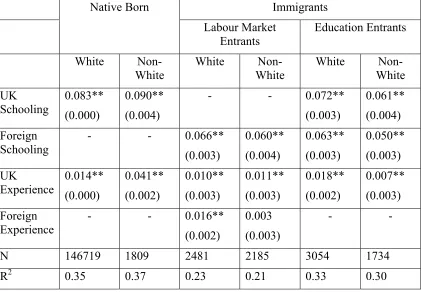
Panel (a) of Table 2 contains the results for the log of weekly earnings while panel (b) is the
equivalent for employment status. In each table we have reported the estimated coefficients
and standard errors for UK schooling and foreign schooling. For both labour market
outcomes both types of schooling have a positive and statistically significant impact. There
are, however, differences in the estimated returns to an additional year’s education depending
on where that education was obtained and to which sub-group the individual belongs. In the
earnings models an additional year of UK schooling benefits natives more than immigrants
and, for both outcomes, non-white natives have higher rates of return than whites. For those
immigrants for whom we observe both UK and foreign schooling (education entrants), it is,
perhaps unsurprisingly, the UK variety which offers the higher earnings and employment
return.
We also report, in Table 2, estimates of the returns to UK and foreign potential experience.
These are based on a quadratic specification of experience and represent an estimate of the
marginal return to an additional year’s experience calculated at the mean level of (UK or
foreign) experience for the sub-sample in question10. Considering earnings first, the return to an additional year of UK experience is estimated at around 1-2% for virtually every group and
10
These are estimated as = β1 + 2β2expwhere β1 is the coefficient on experience and β2 the coefficient on
experience squared and exp is the mean value of experience. The reported standard error and significance level
is highly significant. The exception is non-white natives where the return is estimated to be
around 4%. Similar to the findings of Shields and Wheatley Price (1998), foreign experience
is a statistically significant determinant of earnings only for the whites in our sample. This can
be interpreted in at least two ways: white immigrants to the UK are more likely to come from
a developed country labour market where acquired human capital will have value in other
developed countries. On the other hand, differences in returns to human capital between
racial groups are often seen as evidence of labour market discrimination and the differences
seen here between white and non-white immigrants may reflect such employer attitudes.
The results for the employment probability regressions in panel (b) have many broad
similarities with those for earnings. The main difference is for those immigrants who arrived
in the UK to enter the labour market for whom UK experience is statistically insignificant and
foreign experience has a significant negative coefficient. This may reflect that immigrants
with large amounts of foreign experience will tend to be relatively old; studies have found
higher unemployment incidence among older workers (e.g. Nickell, 1980).
However we should be careful about interpreting the marginal returns to UK experience as
indicative of how time in the UK affects the labour market status of immigrants relative to
natives. In particular, the results in table 2 might suggest that the experience-earnings profiles
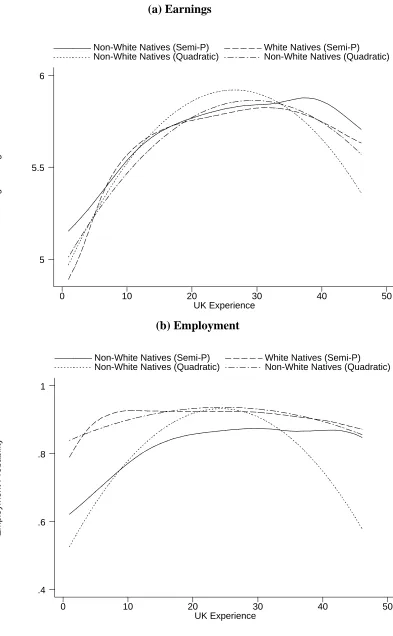
for white and non-white natives are very different. As Figure 1 demonstrates this is not the
case.
Figure 1(a) plots the earnings-experience profiles for white and non-white native workers
estimates of this profile are produced for each group giving a total of 4 lines on each graph.
The first estimate is based on the OLS regression results reported in Table 2 and shows the
fitted quadratic in experience. The second is a semi-parametric estimate based on the partially
linear model introduced in section 3. Two important points are worth making on the basis of
Figure 1. First, consider again the apparent difference between white and non-white natives
in the marginal returns to labour market experience shown in Table 4. Figure 1 reveals that,
for earnings at least, the profiles for these two groups are very similar. The large difference in
marginal returns is because non-whites have much less UK experience on average (see Table
1) and hence their average return to experience is computed at a steeper part of the profile.
The second thing to note is that the quadratic specification of experience can impose too much
structure on the predicted profiles. This is most apparent for the non-whites in Figure 1(b)
where the semi-parametric estimate is much flatter than the quadratic curve.11 Together these suggest that we should look flexibly at the whole range of UK experience when analysing
how immigrant outcomes vary with time in the UK labour market.
4.1.1 Labour Market Entrants
We now move on to explicitly consider the assimilation of immigrant groups. We look first
at the labour market progress of those immigrants who arrived in the UK and entered the
labour market (i.e. those whose education was complete).
The discussion of assimilation requires a baseline: to what are immigrants supposed to
assimilate? Much of the existing literature measures assimilation by conducting the following
11
simulation exercise: imagine suitably similar native and immigrant workers entering the UK
labour market at some particular age. Progressively increment their age and observe what
happens to their relative labour market success. If the paths converge, this is evidence of
assimilation; if they diverge this is evidence of dis-assimilation. An analogy might be to two
escalators, one native, one immigrant, and the objective is to see which escalator is rising
fastest. A problem with this approach is that it runs the risk of obscuring the performance of
immigrants behind that of natives. That is to say, if native earnings are rising quickly with
experience we may conclude that there is dis-assimilation, even though immigrant workers
also experience rising earnings as their time spent in the UK increases. From the perspective
of a policy maker, or indeed that of a new of potential immigrant, it may be more useful to
measure immigrant outcomes relative to a fixed, “average” native worker. The question is
then: how long does it take an immigrant to become like the average native. This latter
approach, which we follow here, isolates the importance of returns to immigrant human
capital in the host labour market.
We adopt this approach by examining the predicted weekly earnings and employment
probabilities for an immigrant who arrived in the UK having completed the sample average
amounts of education and experience in their own country. For both natives and immigrants,
we consider a married male, living in the South East, working in non-manufacturing who
otherwise has sample average characteristics. To abstract from secular wage and employment
changes we use a comparison year of 1997 for immigrants and natives. We then allow our
typical immigrant’s predicted earnings and employment probabilities to evolve in line with
the semi-parametric estimate of their experience profile. This exercise is conducted
Figure 2 shows the results for immigrant labour market entrants. Panel (a) refers to (log)
gross weekly earnings while panel (b) refers to the employment probability. The horizontal
lines are the predicted earnings and employment probabilities for the white and non-white
native comparison individuals.
The earnings profiles in Figure 2(a) for whites and non-whites have a very similar shape
rising gradually to a peak at around 30 years after migration. There is therefore evidence of
positive assimilation relative to the fixed baseline of the average native worker. Between
arrival and 30 years since migration real white immigrant earnings are estimated to rise by
0.21 log points while for non-whites the equivalent figure is around 0.22 log points. The big
difference between white and non-white immigrants is in the intercept of the earnings profile
rather than its slope with white immigrants earning 0.31 log points more on arrival than
non-whites. The gap between a newly arrived white immigrant and the comparison white native is
0.02 log points compared to 0.161 for non-whites.
As the figure demonstrates, white immigrants earn more than non-white natives on arrival and
overtake the comparison white native worker after 4 years since migration. Our non-white
immigrant take something approaching 20 years to achieve parity with the comparison
non-white native and never reaches the earnings level of the non-white native. Thus while earnings
assimilation, in the sense of higher earnings growth with UK experience, takes place for both
white and non-white immigrants, there is a substantial ethnic differential between white and
Figure 2(b) undertakes the same exercise for the fitted employment probabilities. Here a quite
different picture emerges. Non-white immigrant employment probabilities begin at a higher
level than their native comparator and decline from around 18 years since migration. Such
immigrants therefore experience what could be described as dis-assimilation. For the white
immigrants, employment probabilities begin at a comparatively low level – a white immigrant
has an employment probability on arrival very similar to a non-white immigrant – but
gradually rise with years since migration overtaking the white native comparator after some
28 years.
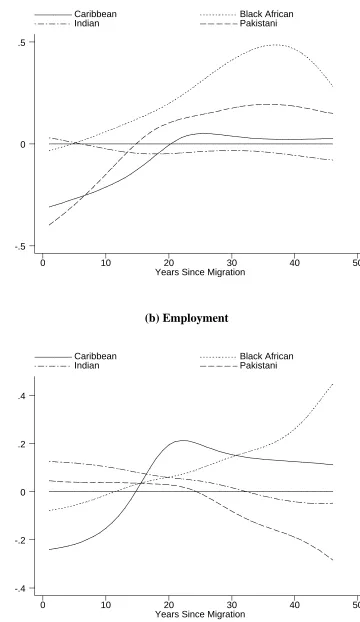
To provide further insight into the ethnic differences in labour market outcomes, Figure 3
breaks down the assimilation results by individual ethnic group for four of the largest ethnic
minority groups in the UK. The figure shows, relative to a native individual of the same
ethnic group, the immigrant advantage in earnings or employment plotted as a function of
years since migration. These results are based on the semi-parametric assimilation profiles
estimated separately for each non-white group.
For earnings, most non-white immigrants (excluding Indians) demonstrate positive
assimilation. Black African immigrants enter the labour market on slightly lower earnings
than African natives, their earnings then overtake those for natives fairly quickly and then
diverge away before starting to converge again after 39 years. Pakistani and Caribbean
immigrants start on much lower earnings than their native counterparts (around 0.3 and 0.4
percentage log points lower respectively) but then earnings assimilate towards natives,
overtaking after 13 (20) years for Pakistanis (Caribbeans). Finally Indian immigrants appear
natives after only a couple of years. Immigrant Indian earnings remain fairly close to natives
thereafter.
For employment, there is a clear dichotomy between Black and South Asian immigrants in
terms of how they enter the labour market relative to their native counterparts. Caribbean and
Black African immigrants start off worse than natives (around 0.21 and 0.08 log points lower
respectively) but employment propensities overtake those for natives after 10-13 years,
diverging thereafter. For Caribbeans the employment advantage peaks after about 20 years
and then converges towards natives again, whereas Black African employment appears to
diverge exponentially. Indian and Pakistani immigrants start off doing better than natives
(around 0.12 and 0.06 log points higher respectively) but then employment assimilates
towards natives falling below that for natives after around 32 (24) years for Indians
(Pakistanis).
Figure 2 demonstrated that white immigrant average earnings begin below those for
non-white natives, but then their earnings increase. Figure 3 shows that this is an average of three
different types of behaviour: Black Africans who start pretty close to natives and then
increase their earnings; Caribbeans and Pakistanis who start well below their counterparts but
gradually assimilate and finally Indians whose earnings remain fairly close to natives. For
employment, the non-white dis-assimilation observed in Figure 2 can be mainly attributed to
the South Asian groups. Pakistani and Indians start off at an advantage but then deteriorate,
whereas Black Africans and Caribbeans start off disadvantaged and then improve.
On the whole it is the Asian immigrants who do worse (with the exception of Pakistanis for
Asians, relative to natives, over the long term. The choice of comparator is crucial here,
however. Blackaby et al. (1998, 2002) study the employment and earnings of non-white
ethnic minorities (immigrant and native-born) in the UK and find that, compared to the
majority white community, it is the Black (Pakistani) group who do worst in terms of
employment (earnings).
4.1.1 Entrants to Education
We now turn to examine the labour market assimilation of those immigrants who arrived in
the UK to enter the education system, either as adults or as children. Here the correspondence
between years since migration and UK experience is broken and this needs to be accounted
for when examining assimilation profiles. To illustrate the results we consider four individual
‘types’ similar to those typical individuals used in the preceding sub-section but differentiated
by their age at arrival in the UK and their UK educational attainment. Specifically the four
types are:
• Type I: arrived aged 5, leaves education aged 16
• Type II: arrived aged 5, leaves education aged 21
• Type III: arrived aged 16, leaves education aged 18
• Type IV: Arrived aged 18, leaves education aged 22.
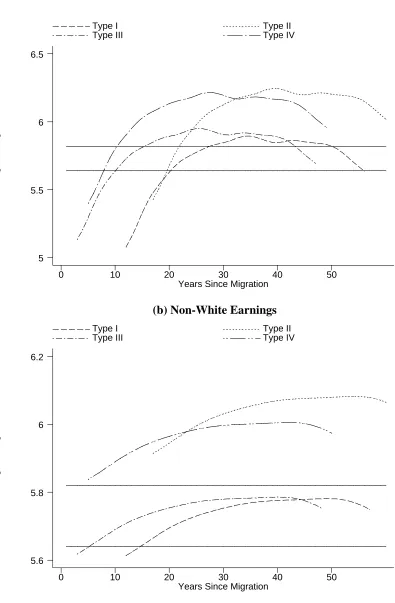
The results of this exercise are shown in Figure 3, which has four panels. Consider panel (a)
which examines earnings for white immigrants who entered education on arrival. The upper
horizontal line is the level of (log) earnings for the white native comparison individual as
described in the preceding sub-section and the lower horizontal line is the same for the
non-white native comparison individual. Years since migration are measured along the horizontal
These do not begin at zero years since migration as education entrants do not join the labour
market until after their UK education in complete and this time period varies by type. Thus
we can see that the individual who arrives aged 5 and leaves school at 16 has lower earnings
on entry to the labour market than any of the other groups while the immigrants with more
education have higher initial earnings. The most striking feature of this graph is the strong
earnings growth that takes place over the first 15 or so years of UK labour market experience.
From labour market entry to the peak of the profile is a log difference of 0.82.
Panel (b) plots fitted earnings for non-whites on the same basis. A quite different picture
emerges with much slower earnings growth over the range of UK experience. From labour
market entry to the peak is a log difference of 0.18 suggesting much lower earnings
assimilation. What dominate the differences in earnings in this picture are differences in
entry-level earnings. The ‘best educated’ non-white immigrants (types II and IV) are
predicted to earn more than the comparison white native individual on entry to the labour
market. The contrast with the ‘best educated’ white immigrants (the same types) in panel (a)
is marked suggesting that non-white immigrants can achieve considerable progress in the
labour market through investment in UK education.
Panels (c) and (d) complete the picture by plotting the evolution of employment probabilities
for white and non-white immigrants respectively using the four immigrant types outlined
above. For both whites and non-whites there is strong growth in employment probabilities
over the first 10 years after arrival. For whites this flattens out while for non-whites it
4.2 Arrival Year Effects
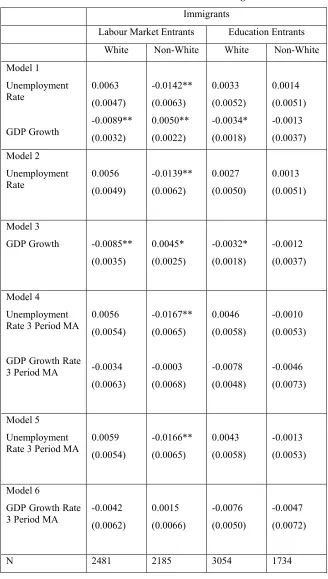
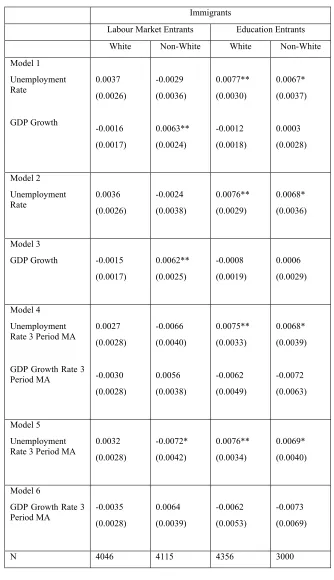
Tables 3 and 4 report the results of parametric least squares estimates of equation (1) where
we replace the cohort dummies with variables reflecting the state of the labour market and
wider economy in the immigrant’s first year in the British labour market. For immigrants who
arrived with their education complete this is their year of arrival to the UK. For immigrants
who arrived with their education incomplete this is the year that they left full time education.
We estimated six models for each labour market outcome. Year of entry unemployment and
growth rates were considered singly and jointly then the same procedure was carried out for
the three-period moving averages (centred on the year after entry) of the aggregate variables.
For both earnings and employment many of the estimated coefficients are insignificantly
different from zero. The principal exception is for the earnings of non-white labour market
entrants where significant negative coefficients on unemployment are found in all four models
where unemployment appears. The estimated coefficients range from –0.017 to –0.014. To
give some idea of the economic significance of these results, a coefficient of –0.015 implies
that a one percentage point increase in the unemployment rate on entry to the UK labour
market is associated with a reduction in earnings of around 1.5%. Over the period during
which members of our sample arrived in the UK the male unemployment rate varied between
1% (1943) and 22% (1932). Unemployment changes in the initial years of labour market
experience could therefore have a quantitatively significant impact on the long-term earnings
The only other significant coefficients in Table 3 are negative signs on GDP growth rates for
white labour market entrants in two models. These are counter-intuitive: a one percentage
point higher growth rate is associated with a reduction in earnings of around 0.9%. UK
growth rates over the period were almost always in the range –5% to 5%.
Turning now to the linear probability models for employment in Table 6 we observe that for
non-white labour market entrants, only growth in GDP is statistically significant. Non-white
labour market entrants who arrived in a period of economic growth enjoy an employment
premium. This is not true for their white counterparts, since all the arrival effects are
statistically insignificant. For the education entrant immigrants, all the labour market entry
variables are statistically insignificant for non-whites, although whites appear to enjoy an
employment premium for high arrival year unemployment rates. Again this is a
counter-intuitive result.
In fact these “perverse” results are not out of line with previous research: the existing
literature on arrival year effects and the scarring hypothesis is characterised by somewhat
mixed results. Chiswick et al. (1997) find that arrival year unemployment rates exhibit
significantly positive coefficients in one specification of an individual employment equation
with insignificant coefficients in other specifications. MacDonald and Worswick (1998) find
a positive impact of initial unemployment on earnings using Australian data. Stewart and
Hyclak (1984) and Chiswick and Miller (2002), both for the US, obtain results more in line
5. Discussion and Conclusions
In this paper we use Labour Force Survey data to document the impact of arrival year
economic conditions and assimilation on the labour market outcomes of immigrants to the
UK. The innovative features of our work include the separate analysis of immigrants who
arrive in the UK to enter the labour market from those who enter education, the investigation
of arrival year economic conditions on labour market outcomes for immigrants and the use of
a semi-parametric method to estimate assimilation profiles. Below we summarise and discuss
our key results.
Earnings for white and non-white immigrants, whether labour market entrants or entrants to
education, rise during the early years of their stay in the UK. The levels of earnings and the
rate of change differ substantially across immigrant ethnicity and type, nevertheless,
compared to a baseline or typical native, there is evidence of positive earnings assimilation in
the UK labour market. Annual rates of earnings growth over the first 15 years in the UK,
based on the semi-parametric profiles in Figure 2(a) and computed to be net of secular wage
growth and inflation, are around 1.0% for non-whites and 1.1% for whites. Assimilation is
particularly strong for white entrants to education once they reach the labour market: based on
the profiles in Figure 3(a), real weekly earnings are predicted to double in around 11 years.
This compares to over 40 years for non-white immigrants.
Earnings levels for non-whites fall short of those for whites, whether for immigrant or native
workers, and this is a recurring theme of the paper, emerging in the raw data and the
regression estimates. If we consider the gap between the earnings of an immigrant beginning
0.15 log points larger for non-whites and takes 16 years longer to close. Ethnic wage gaps are
recognised as an enduring feature of the UK labour market and our results suggest that
Pakistani and Caribbean immigrants who enter the labour market directly encounter a
particular disadvantage, although they assimilate and overtake natives after 15-20 years.
Compared to their native counterparts, Black African and Pakistani workers fare better than
Caribbeans and Indians.
The one optimistic note for non-white immigrants concerns those who entered the UK prior to
the completion of their education. While assimilation profiles are less steep for non-white
education entrants compared to whites, such immigrants do experience strong returns to their
UK education as evinced by the entry-level earnings displayed in Figure 3(b). Sufficient UK
schooling can completely wipe out the disadvantage faced by non-white immigrants as they
enter the labour market. Our measure of schooling (years in education) is somewhat crude,
due to data limitations, and future work could profitably establish what types of educational
investment underlie these high returns for non-white immigrants.
Our results pertaining to employment assimilation were more mixed. Amongst labour market
entrants, whites exhibited positive assimilation with employment rates rising with time since
migration. This was also the case for white and non-white education entrants. For non-white
labour market entrants, however, the relationship was negative with a pronounced fall off in
predicted employment rates around 16 years after migration. This observation can mainly be
attributed to South Asian immigrants, since Black African and Caribbean immigrants fare
Dis-assimilation for particular immigrant groups has been found in the UK before: Bell
(1997) observed earnings dis-assimilation for white immigrants and postulated that selective
re-migration was the explanation. The issue of re-migration is difficult to address in the
absence of detailed administrative records or panel data with sufficiently large immigrant
samples, however Rendall and Ball (2004) have suggested that as many as half of all recent
immigrants to the UK emigrate again within 5 years. However, they also find that the
countries previously sending many non-white immigrants to the UK (the Indian sub-continent
and Commonwealth Caribbean) have significantly lower rates of re-migration than countries,
which are the source of white immigrants. It therefore seems unlikely that selective
re-migration is wholly responsible for the patterns observed here and we posit an alternative
explanation. Many non-white immigrants to the UK were recruited directly to public sector
employment in the 1950s and 1960s. We would expect such immigrants to have very low
unemployment risk on arrival and in the next few years. As time goes by this group would
experience shocks and an ‘equilibrium’ rate of unemployment for those individuals given
their skills and market opportunities would be established. Such a view would be consistent
with some employment dis-assimilation as we observe.
As a final comment on our assimilation results it is worth pointing to some important
differences between our results and those of previous studies. Both Bell (1997) and
Dustmann et al. (2003) find positive earnings assimilation profiles for non-whites and
negative profiles for some white groups. However these authors compute their assimilation
profiles differently to us - comparing immigrants and natives who are both on rising earnings
profiles - and they use different comparison groups of natives. Furthermore they do not
estimate separate regression models for natives and immigrants. Borjas (1994) notes how
Mexican workers in the US hence estimates of assimilation must be interpreted in the light of
the modelling decisions made by the researchers in question. We have focussed on
immigrants’ returns to UK experience and UK schooling on the basis that these are the
fundamental drivers of immigrant labour market outcomes.
The second main hypothesis that we investigate is whether aggregate economic conditions at
the time immigrants enter the labour market can have a permanent impact on their labour
market success. There is some evidence that non-white immigrants who arrive in the UK at
times of high unemployment and immediately enter the labour market suffer an earnings
penalty compared to those who arrive in years of lower unemployment. Arguably, non-white
labour market entrants might be expected to be more susceptible to the scarring effect of
unemployment than other types of immigrant if employers have less information about their
qualifications and backgrounds than they would about white immigrants who originate in
countries with education systems and labour markets similar to the UK. For other immigrant
groups, and in models where we use the growth rate as the indicator of aggregate economic
conditions, the results are either insignificant or, counter intuitively, suggest that a poorer
macroeconomic environment has a permanent, positive impact on immigrant outcomes.
There is no consensus in the empirical literature on the size, sign or significance of immigrant
arrival effects, however this may be due to data limitations: panel data for the UK have been
used to provide convincing evidence of unemployment scarring for native workers
(Arulampalam, 2001). It is probably asking a lot of our data, using a single aggregate annual
unemployment or growth rate as an indicator of individual employment risk, to uncover
scarring effects. In other countries, where administrative records allow large samples of
conditions and immigrant outcomes have been observed (Aslund and Rooth, 2003; Barth et
al., 2004).
One further caveat which should be mentioned is the absence of data on English language
ability in the Labour Force Survey. Using other data sources Dustmann and Fabbri (2003)
and Lindley (2002) demonstrate the important association between language proficiency and
labour market success. Differences in language ability between ethnic groups may go some
way to explaining the ethnic differences we observe.
From a policy perspective assimilation matters if immigrants are expected by the host country
to, in the Prime Minister’s words, “support themselves”. Evidence of a significant and
persistent failure of immigrant labour market outcomes to approach those of natives could be
used to bolster estimates of the economic cost of immigration. There is little evidence in our
results that, taken as a whole, immigrants in the UK labour market systematically fail to reach
high levels of success. Clearly there are caveats to this. First, we only observe those
immigrants who make it to the labour market and do not observe non-participants or those
operating in the shadow economy. Second, patterns of immigration are constantly changing
in response to international developments and host country policy changes, hence we should
be wary of extrapolating from what previous immigrant cohorts experienced to the
performance of future cohorts. Nevertheless, the large differences in outcomes that we do
observe are related as much to ethnicity rather than immigrant status per se, and it would
Table 1. Sample Means of Key Variables by Immigration and Ethnic Status.
QLFS 1993-2002
Natives Immigrants: Labour
Market Entrants
Immigrants: Education Entrants
Total
Whites
Non-Whites Whites Non-Whites Whites Non-Whites Mean Gross Weekly Pay 376.28 (204.18) 342.66 (191.55) 454.99 (264.13) 363.36 (234.78) 434.25 (240.52) 390.89 (223.19) 378.23 (206.971 ) Employment Rate 90.43 (0.2898) 75.13 (0.4323) 89.69 (0.3041) 79.39 (0.4045) 89.97 (0.3005) 81.77 (0.3862) 90.14 (0.2981)
Arrival Age - - 26.81
(8.000) 26.45 (7.232) 6.03 (6.446) 11.33 (6.453) 17.88* (11.758) UK Experience 21.51 (12.65) 10.07 (8.158) 14.03 (13.363) 15.99 (11.991) 18.39 (11.861) 15.85 (9.877) 20.97 (12.70) Foreign Experience
- - 7.87
(7.260)
7.43
(6.585)
- - 4.01*
(6.304) UK Schooling 13.02 (2.45) 14.29 (2.860)
- - 11.24
(4.890) 8.06 (5.315) 12.46 (3.572) Foreign Schooling - - 14.98 (4.027) 14.99 (3.811) 3.42 (5.407) 7.22 (5.807) 10.24* (7.035)
N 204338 3382 4046 4115 4356 3000 223237
N for employed and
positive wage
146719 1809 2481 2185 3054 1734 157982
Table 2. Returns to Human Capital: OLS Regression Results
(a) Log Gross Weekly Earnings
Immigrants Native Born
Labour Market Entrants
Education Entrants
White
Non-White White Non-White White Non-White UK Schooling 0.083** (0.000) 0.090** (0.004)
- - 0.072**
(0.003)
0.061**
(0.004)
Foreign Schooling
- - 0.066**
(0.003) 0.060** (0.004) 0.063** (0.003) 0.050** (0.003) UK Experience 0.014** (0.000) 0.041** (0.002) 0.010** (0.003) 0.011** (0.003) 0.018** (0.002) 0.007** (0.003) Foreign Experience
- - 0.016**
(0.002)
0.003
(0.003)
- -
N 146719 1809 2481 2185 3054 1734
(b) Employment Status
Immigrants Native Born
Labour Market Entrants
Education Entrants
White
Non-White White Non-White White Non-White UK Schooling 0.010** (0.000) 0.026** (0.003)
- - 0.010**
(0.002)
0.012**
(0.002)
Foreign Schooling
- - 0.010**
(0.001) 0.011** (0.002) 0.007** (0.001) 0.010** (0.002) UK Experience 0.0007** (0.00006) 0.020** (0.001) 0.002 (0.001) -0.002 (0.002) 0.003** (0.001) 0.004** (0.001) Foreign Experience
- - -0.002**
(0.001)
-0.003**
(0.001)
- -
N 204338 3382 4046 4115 4356 3000
Notes:
1. The returns to experience are based on a quadratic specification and are computed at the sample mean of the experience variable (foreign or UK) for the relevant group. The coefficients are based on separate regressions for each group containing the following additional explanatory variables: a time trend (survey year), immigrant cohort dummy variables, marital status, regional dummy variables, a manufacturing dummy and, for the non-white regressions, ethnic group dummy variables. For the immigrant equations the coefficient on the time trend variable is constrained to be equal to that for the white native group.
Table 3. Arrival Year Effects: Earnings
Immigrants
Labour Market Entrants Education Entrants
White Non-White White Non-White
Model 1 Unemployment Rate GDP Growth 0.0063 (0.0047) -0.0089** (0.0032) -0.0142** (0.0063) 0.0050** (0.0022) 0.0033 (0.0052) -0.0034* (0.0018) 0.0014 (0.0051) -0.0013 (0.0037) Model 2 Unemployment Rate 0.0056 (0.0049) -0.0139** (0.0062) 0.0027 (0.0050) 0.0013 (0.0051) Model 3
GDP Growth -0.0085**
(0.0035) 0.0045* (0.0025) -0.0032* (0.0018) -0.0012 (0.0037) Model 4 Unemployment Rate 3 Period MA
GDP Growth Rate 3 Period MA
0.0056 (0.0054) -0.0034 (0.0063) -0.0167** (0.0065) -0.0003 (0.0068) 0.0046 (0.0058) -0.0078 (0.0048) -0.0010 (0.0053) -0.0046 (0.0073) Model 5 Unemployment Rate 3 Period MA
0.0059 (0.0054) -0.0166** (0.0065) 0.0043 (0.0058) -0.0013 (0.0053) Model 6
GDP Growth Rate 3 Period MA
-0.0042 (0.0062) 0.0015 (0.0066) -0.0076 (0.0050) -0.0047 (0.0072)
N 2481 2185 3054 1734
Note:
1. The table contains estimated coefficients and standard errors based on a parametric (quadratic) specification of equation (1) with cohort dummies replaced by the aggregate-level variables.
Table 4. Arrival Year Effects: Employment
Immigrants
Labour Market Entrants Education Entrants
White Non-White White Non-White
Model 1 Unemployment Rate GDP Growth 0.0037 (0.0026) -0.0016 (0.0017) -0.0029 (0.0036) 0.0063** (0.0024) 0.0077** (0.0030) -0.0012 (0.0018) 0.0067* (0.0037) 0.0003 (0.0028) Model 2 Unemployment Rate 0.0036 (0.0026) -0.0024 (0.0038) 0.0076** (0.0029) 0.0068* (0.0036) Model 3
GDP Growth -0.0015
(0.0017) 0.0062** (0.0025) -0.0008 (0.0019) 0.0006 (0.0029) Model 4 Unemployment Rate 3 Period MA
GDP Growth Rate 3 Period MA 0.0027 (0.0028) -0.0030 (0.0028) -0.0066 (0.0040) 0.0056 (0.0038) 0.0075** (0.0033) -0.0062 (0.0049) 0.0068* (0.0039) -0.0072 (0.0063) Model 5 Unemployment Rate 3 Period MA
0.0032 (0.0028) -0.0072* (0.0042) 0.0076** (0.0034) 0.0069* (0.0040) Model 6
GDP Growth Rate 3 Period MA -0.0035 (0.0028) 0.0064 (0.0039) -0.0062 (0.0053) -0.0073 (0.0069)
N 4046 4115 4356 3000
Note:
1. The table contains estimated coefficients and standard errors based on a parametric (quadratic) specification of equation (1) with cohort dummies replaced by the aggregate-level variables.
Figure 1. Experience Profiles: Native Born
(a) Earnings
Log Earnings
UK Experience
Non-White Natives (Semi-P) White Natives (Semi-P)
Non-White Natives (Quadratic) Non-White Natives (Quadratic)
0 10 20 30 40 50
5 5.5 6
(b) Employment
Employment Probability
UK Experience
Non-White Natives (Semi-P) White Natives (Semi-P)
Non-White Natives (Quadratic) Non-White Natives (Quadratic)
0 10 20 30 40 50
Figure 2. Assimilation: Labour Market Entrants
(a) Earnings
Log Earnings
Years Since Migration
White Natives Non-White Natives
White Immigrants Non-White Immigrants
0 10 20 30 40 50
5.4 5.6 5.8 6
(b) Employment
Employment Probability
Years Since Migration
White Natives Non- White Natives
White Immigrants Non-White Immigrants
0 10 20 30 40 50
Figure 3. Assimilation Profiles by Ethnic Group
(a) Earnings
Immigrant Wage Premium
(relative to same ethnic group natives)
Years Since Migration
Caribbean Black African
Indian Pakistani
0 10 20 30 40 50
-.5 0 .5
(b) Employment
Immigrant Employment Advantage
(relative to same ethnic group natives)
Years Since Migration
Caribbean Black African
Indian Pakistani
0 10 20 30 40 50
Figure 4. Assimilation: Education Entrants
(a) White Earnings
Log Earnings
Years Since Migration
Type I Type II
Type III Type IV
0 10 20 30 40 50
5 5.5 6 6.5
(b) Non-White Earnings
Log Earnings
Years Since Migration
Type I Type II
Type III Type IV
0 10 20 30 40 50
(c) White Employment
Employment Probability
Years Since Migration
Type I Type II
Type III Type IV
0 10 20 30 40 50
.7 .8 .9 1
(d) Non-White Employment
Employment Probability
Type I Type II
Type III Type IV
0 10 20 30 40 50
REFERENCES
Antecol, H., P. Kuhn and S. Trejo (2003), Assimilation via Prices or Quantities? Labor Market Institutions and Immigrant Earnings Growth in Australia, Canada and the United States, IZA Discussion Paper No. 802.
Arulampalam, W. (2001), Is Unemployment Really Scarring? Effects of Unemployment Experiences on Wages, Economic Journal, 111, F585-F606.
Arulampalam, W., P. Gregg and M. Gregory (2001), Introduction: Unemployment Scarring, Economic Journal, 111, F577-F584.
Aslund, O. and D-O. Rooth (2003), Do When and Where Matter? Initial Labour Market Conditions and Immigrant Earnings, paper prepared for EALE Conference, Seville, 2003.
Barth, E, B. Bratsberg and O. Raaum (2004), Identifying Earnings Assimilation of Immigrants under Changing Macroeconomic Conditions, Scandinavian Journal of Economics, 106, 1-22.
Bell, B.D. (1997), The Performance of Immigrants in the United Kingdom: Evidence from the GHS, Economic Journal, 107, 333-345.
Blackaby, D.H., D.G. Leslie, P.D. Murphy and N.C. O’Leary (1998), The Ethnic Wage Gap and Employment Differentials in the 1990s: Evidence for Britain, Economics Letters, 58, 97-103.
Blackaby, D.H., D.G. Leslie, P.D. Murphy and N.C. O’Leary (2002), White/Ethnic Minority Earnings and Employment Differentials in Britain: Evidence from the LFS, Oxford Economic Papers, 54, 270-279.
Borjas, G. (1985), Assimilation, Changes in Cohort Quality, and the Earnings of Immigrants, Journal of Labor Economics, 3, 463-489.
Borjas, G. (1994), The Economics of Immigration, Journal of Economic Literature, 32, 1667-1717.
Chiswick, B. (1980), The Earnings of White and Coloured Male Immigrants in Britain, Economica, 47, 81-87.
Chiswick, B., Y. Cohen and T. Zach (1997), The Labor Market Status of Immigrants: Effects of the Unemployment Rate at Arrival and Duration of Residence, Industrial and Labor Relations Review, 50, 289-303.
Chiswick, B. and P. Miller (2002), Immigrant Earnings: Language Skills, Linguistic Concentrations and the Business Cycle, Journal of Population Economics, 15, 31-57.
Deaton, Angus S. (1997), The Analysis of Household Surveys: A Microeconometric Approach to Development Policy, Johns Hopkins University Press.
Dustmann, C. and F. Fabbri (2003), Language Proficiency and Labour Market Performance of Immigrants in the UK, Economic Journal, Vol. 113, 695-.???
Dustmann, C., F. Fabbri, I. Preston and J. Wadsworth (2003), Labour Market Performance of Immigrants in the UK Labour Market, Home Office Online Report 05/03, available at http://www.homeoffice.gov.uk.
Hatton, T. (2003), Explaining Trends in UK Immigration, CEPR Discussion Paper, 4019.
Heckman, J. and R. Robb (1985), Using Longitudinal Data to Estimate Age, Period and Cohort Effects in Earnings Equations, in W. Mason and S. Fienberg (eds. ) Cohort Analysis in Social Research: Beyond the Identification Problem, New York: Springer-Verlag.
Kapteyn, A, R. Alessie and A. Lusardi (2003), Explaining the Wealth Holdings of Difference Cohorts: Productivity Growth and Social Security, European Economic Review, forthcoming.
Kossoudji, S. (1989), The Assimilation of Immigrant Workers: Is it a Labor Market Phenomenon?, Journal of Human Resources, 24, 494-527.
Kupper, L., J. Janis, A. Karmous and B. Greenberg (1985), Statistical Age-Period-Cohort Analysis: A Review and Critique, Journal of Chronic Disease, 38, 811-830.
MacDonald, J. and C. Worswick (1998), The Earnings of Immigrant Men in Canada: Job Tenure, Cohort and Macroeconomic Conditions, Industrial and Labor Relations Review, 51, 465-482.
Nickell, S. (1980), A Picture of Male Unemployment in Britain, Economic Journal, 90, 307-329.
Rendall, M. and D. Ball (2004), Immigration, Emigration and the Ageing of the Overseas-Born Population in the United Kingdom, Population Trends, Summer No. 116, London: TSO.
Shields, M. and S. Wheatley Price (1998). The Earnings of Male Immigrants in England: Evidence from the Quarterly LFS, Applied Economics, 30, 1157-1168.
StataCorp (2001), Stata Statistical Software: Release 7.0, Reference Manual H-P, College Station, TX: Stata Corporation.
Stewart, J. and T. Hyclak (1984), An Analysis of Earnings Profiles Among Foreign-Born Men, Review of Economics and Statistics, 66, 292-303.
Wheatley Price, S. (2001), The Unemployment Experience of Male Immigrants in England, Applied Economics, 33, 201-215.