1
Simulation of Air Puff Tonometry Test Using Arbitrary
Lagrangian-Eulerian (ALE) Deforming Mesh for Corneal
Material Characterisation
Osama Maklad*1; Ashkan Eliasy1; Kai-Jung Chen1; Vassilios Theofilis1; Ahmed Elsheikh1, 2, 3
Affiliation:
1 School of Engineering, University of Liverpool, Liverpool L69 3GH, UK
2 NIHR Biomedical Research Centre for Ophthalmology, Moorfields Eye Hospital NHS
Foundation Trust and UCL Institute of Ophthalmology, UK
3 School of Biological Science and Biomedical Engineering, Beihang University, Beijing,
China
*Corresponding author:
Osama Maklad, School of Engineering, University of Liverpool, Brownlow Hill, Liverpool L69 3GH, UK, [email protected], Tel: +44 (0) 748 143 2045
Data availability:
Data available from the Dryad Digital Repository:
https://datadryad.org/review?doi=doi:10.5061/dryad.cp5nt8v
Keywords: Ocular biomechanics; Intraocular pressure (IOP); Fluid Structure Interaction (FSI); Arbitrary Lagrangian-Eulerian mesh (ALE)
2
Ab ac
Purpose: To improve numerical simulation of the non-contact tonometry test by using
Arbitrary Eulerian-Lagrangian deforming mesh in the coupling between computational
fluid dynamics model of an air jet and finite element model of the human eye.
Methods: Computational fluid dynamics model simulated impingement of the air puff and
employed Spallart-Allmaras model to capture turbulence of the air jet. The time span of
the jet was 30 ms and maximum Reynolds number 𝑅 2.3 10 , with jet orifice
diameter 2.4 mm and impinging distance 11 mm. Model of the human eye was analysed
using finite element method with regional hyper-elastic material variation and patient
specific topography for cornea and sclera starting from stress-free configuration. The
cornea was free to deform as a response to the air puff using an adaptive deforming
mesh at every time step of the solution. Aqueous and vitreous humours were simulated
as a fluid cavity filled with incompressible fluid with a density of 1000 Kg/m3.
Results: Using the adaptive deforming mesh, in numerical simulation of the air puff test,
improved the traditional understanding of how pressure distribution on cornea changes
with time of the test. There was a mean decrease in maximum pressure (at corneal apex)
of 6.29 ± 2.2% and a development of negative pressure on a peripheral corneal region
2-4 mm away from cornea centre.
Conclusions: The study presented an improvement of numerical simulation of the air puff
test, which will lead to more accurate IOP and corneal material behaviour estimation.
The parametric study showed that pressure of the air puff is different from model to
3
1. In od c ion
Biomechanical properties of biological tissues are important health indicators and
multiple clinical decisions and surgical planning can be made based on their dynamic
response to loading [1]. However, some of the mechanical and dynamic responses are
still not fully understood due to the non-linearity and viscoelasticity of the tissues [2]. The
tissue of interest in this study is the cornea , which contributes significantly to the optical
focusing power of the eye and a vital area in refractive surgeries [3] [5]. The air puff test
conducted by the Ocular Response Analyser (ORA; Reichert, Inc., Buffalo, NY), the
CorVis-ST (Oculus Optikgerate GmbH, Wetzlar, Germany) [6] [8] and others, is a
non-contact tonometry method with direct interaction with the cornea used to estimate
intraocular pressure that is necessary for glaucoma management [9] [11]. Moreover, this
test was proven to have a promising potential in corneal material characterisation and
Keratoconus detection [12] [15].Tonometry is based on a simple concept of applying a
known load causing deformation in the cornea and relating this load to the pressure
inside the eye. However, accuracy of intraocular pressure (IOP) estimation continues to
be a challenge due to the effect of corneal parameters including corneal geometry and
material properties [16], [17]. The interplay between corneal geometry, material
properties, ocular fluids and the air puff was studied before theoretically, numerically and
clinically but with assumptions for the fluid structure interaction effect.
Theoretically, the air puff test was simulated as a harmonic oscillator model (1DOF) to
model behaviour of the cornea under action of the air puff test by Zhaolong, Han et al.
[18]. They investigated the air puff induced corneal vibrations and their effect on
intraocular pressure (IOP), viscoelasticity and mass of the cornea based on theoretical
approach and some clinical observations. Moreover, Anna Pandolfi et al. [19] used two
different approaches to estimate intraocular pressure and the other eye parameters; the
first approach was modelling the corneal system as a harmonic oscillator and in the
4
simulate the dynamic test on surgically treated corneas. The finite element calculations
reproduced the observed clinical deformations of cornea including the two applanation
configurations provided by Ocular Response Analyzer, suggesting that the mechanical
response of cornea to the air puff test was driven only by elasticity of the stromal tissue.
Furthermore, Kaneko et al. [20] modelled the human eyeball as a 1-DOF and 2-DOF
systems to assess the dynamic response of the cornea and eyeball to the air puff test as
shown in Figure 1.
Numerically, Kling et al. [21] presented a two-dimensional axis-symmetric finite element
model which predicts deformation patterns of the cornea during air puff test to get its
elastic and viscoelastic properties. They validated the results against experimental
testing on porcine and human eyes to get the spatial pressure profile. They developed a
2D axis-symmetric CFD model for the air jet impinging on different solid configurations
of the cornea. Their parametric study revealed significant contributions of intraocular
pressure and corneal thickness to the corneal deformation, besides the corneal
biomechanical properties [21]. Moreover, a patient specific finite element model of a
healthy eye was presented by Ariza-Gracia et al. [22], taking account of the stress free
configuration. The cornea was modelled as an anisotropic hyperelastic material with two
preferential directions. Three sets of parameters within the healthy human range, based
on inflation tests, were considered. A two-dimensional CFD simulation of the air jet was
used to obtain pressure loading exerted on the anterior surface of the cornea, however,
cornea was considered a solid non-deformable surface.
In another study performed by Muench et al. [23], they identified the normal and shear
stress profiles on cornea resulting from an air puff to present a universal equation of the
pressure distribution on cornea to use it for corneal material inverse analyses. Their
method was based on experimental characterisation of the air puff produced by
CorVis-ST and CFD simulation of the air puff test. As a calibration of the CFD simulations, they
5
in front of the nozzle exit. They used eleven corneal deformation configurations to apply
them in the CFD model, but also the cornea was simulated as a rigid surface. The
outcomes showed dependency of pressure distribution on cornea on corneal
deformations with minor effect of shear stress component on corneal deformations. In
order to add a realistic modelling of the human eye, they considered the human face to
see its influence on the pressure distribution on cornea. They demonstrated that
pressure and shear stress distributions were not rotationally symmetric when applying
the air puff to real human eyes [23].
Furthermore, using mesh-free particle method, Montanino et al. [24], [25] have proposed
the first 3D fluid-solid interaction model between cornea and aqueous humour under the
air puff test. Their numerical results confirmed the importance of including the internal
fluids in simulation of the non-contact tonometry. However, they considered cornea only
model and applied an analytical bell-shaped pressure distribution over the cornea with
assumptions on the interaction between the air-puff and cornea. The closest fluid
structure interaction simulation of the non-contact tonometry test was presented by
Ariza-Garcia et al. [26], motivated by the fact that the proper interaction between the air
and cornea is still unknown. They explored four different approaches starting from
structural analysis to considering the fluid structure interaction with the air puff from
outside and with the aqueous humour from inside. However, the model was created
based on 2D-axisymmetric porcine eyes. The results indicated importance of considering
fluid structure interaction effect on the pressure distribution and corneal deformations
which will lead, if not considered, to an overestimated IOP measurements and biased
corneal stiffness when performing the inverse finite element analysis [27]. To the best of
our knowledge, the current study is the first attempt to quantify the influence of fluid
structure interaction on corneal behaviour predictions for 3D patient specific eye models
6
puff dynamics and extending the model for a larger parametric study aiming to develop
IOP and corneal material estimation algorithms.
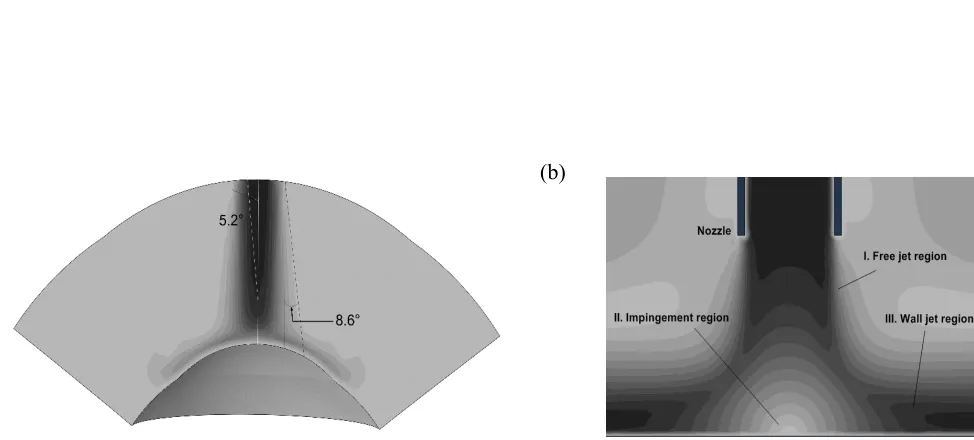
The impinging air puff is commonly studied assuming round jet diffusion and using
impingement theory [28], [29]. In this theory, flow characteristics of impinging jets depend
on parameters including jet orifice diameter, nozzle to impingement surface distance, jet
confinement, radial distance from stagnation point, angle of impingement, surface
curvature and roughness, nozzle exit geometry and turbulence intensity [30] [32]. The
round jet is characterized by a continuous increase in thickness of boundary shear layer.
This boundary layer has two corresponding factors; a decrease in jet core cross-section
and an increase in jet diameter, Figure 2(a). The core length depends on the inner angle
of diffusion, about 5o for the jet core and around 8.5o for the outer jet diameter for highly
turbulent impinging jets [33]. Figure 2(b) shows three regions of an impinging jet: the
free je region, he impingemen or agna ion region, and he all-jet region. In an
earlier study, Larras considered the free and impinging jet regions and provided a
detailed analysis of plane turbulent impinging jets [33].
The paper is arranged as follows; Section 2 states materials and numerical methods
used in the analysis; Section 3 presents some of the achieved results; Section 4 provides
a discussion about methods and results.
2. Ma e ial and me hod
Numerical model of the air puff test, shown in Figure 3, was constructed as a coupled
model between computational fluid dynamics (CFD) and computational solid dynamics
(CSD) as implemented in the software package ABAQUS (version 6.14, Dassault
Systemes Simulia Inc., USA). The air puff test simulation consisted of three components:
Three dimensional finite element model of the eye and material models for
Three dimensional CFD turbulence model of the air puff impinging on the
cornea
Fluid structure interaction (FSI) coupling between the two models
2. 1 Th ee dimen ional e e model
The eye model consisted of 10,000 fifteen-nodded continuum elements (C3D15H), a
general purpose element with 9 integration points, arranged over two layers, distributed
along 15 rings in the cornea and 35 rings in the sclera. The corneal topography was
based on the Pentacam measurements of topography and thickness profile. The
Pentacam is a combined ocular device that employs a Scheimpflug camera and an
illumination system which rotates around the eye to scan its topography [34]. The model
also incorporated attributes to represent in-vivo conditions including the non-uniform
thickness of cornea and sclera, weak inter-lamellar adhesion in corneal stroma and
aspherity of the cornea's anterior and posterior surfaces [35].
The eye model included five different material definitions for cornea, limbus, anterior,
equatorial and posterior sclera behaving hyper-elastically and their stiffness increases
gradually under loading following an S-shaped stress-strain path as reported previously
in experimental studies [36] [38]. With these important features, the model was capable
of selecting which stress-strain path (under loading or unloading) that each element
would follow based on its strain history. The hyper-elastic materials have a rubber-like
material behaviour and the strain energy potential function (∏) is different than elastic
materials and it takes multiple forms. The Ogden form was the one applied in the finite
element model of the human eye [35], [39], [40].
where 𝜆 are the deviatoric principal stretches which are related to the deformations at
maximum of sixth order (N=6); μ and 𝛼 are material parameters; 𝐽 is the elastic volume
ratio related to thermal expansion and 𝐷 defines the material compressibility.
Finite element model of the eye was prevented from rigid body motion in the Z-direction
(anterior-posterior) at the equatorial nodes. Also, the posterior and anterior pole nodes
were restricted in X and Y directions, to prevent rotation, but were free to move in the
Z-direction (anterior-posterior), see Figure 3, all the rest of nodes in the model were free to
move in all directions. Before analysis, stress-free geometry of the eye was estimated. It
is important to calculate the un-deformed configuration of the eye before applying the
IOP, since deformed geometry of the eye will not be suitable for applying different values
of IOP when performing the parametric study. An iterative approach was used to
gradually move the mesh nodes to reach the stress-free (relaxed) configuration of the
ocular tissue [35], [41]. An initial numerical model was generated based on a measured
value of IOP and patient-specific geometry of the ocular tissue. The calculated
deformations are then subtracted using inverse calculations from the stressed geometry
to get the relaxed (stress-free) geometry.
In order to represent intraocular pressure inside the eye, the fluid cavity technique was
used for this purpose. This technique was mainly used to simulate fluid-filled structures
such as pressure vessels, hydraulic or pneumatic actuators and automotive air bags.
The fluid cavity behaviour governs the relationship between cavity pressure, structure
deformation and volume [38], [42], [43]. The fluid cavity calculates the change in IOP and
internal volume during application of the air puff and corneal deformations. The fluid
cavity was filled with a fluid with a density of (1,000 Kg/m3) and bulk modulus of (2.2
10 MPa) [44]. A reference node was specified inside the cavity to represent the applied
pressure and used in the volume calculations. Despite there are multiple components
inside the eye including ocular lens, iris, aqueous and vitreous, the human eye was dealt
with as a deformable pressure vessel that has internal pressure equal to IOP applied
2. 2 Th ee dimen ional CFD b lence model of he ai ff
Model of the air puff consisted of 103,680 six-nodded 3-D fluid continuum elements
(FC3D6) and used Spalart-Allmaras turbulent eddy viscosity model [45], [46] to simulate
the turbulence in the air jet. The air model domain and mesh were created over the
cornea and a 4 mm ring of the sclera by projecting coordinates of the anterior surface
nodes to a distance of 11 mm from the cornea apex as shown in Figure 3. The projection
principle was based on the concept of similar triangles to calculate new coordinates of
the air domain as projected from the eye coordinates. It was important to generate a
code which was applicable for all eye geometries, idealised and patient-specific, healthy
or with certain pathological conditions. Material properties of air were defined in terms of
density (1.204 Kg/m3) and dynamic viscosity (1.83 10 Kg/(m.s)) [47], [48]. Amplitude
of the air jet velocity, and its variation with time were defined according to Figure 4 based
on experimental data obtained from the manufacturers of Corvis-ST (Corneal
Visualization Scheimpflug Technology) and based on a simulated CFD model of the air
flow inside the device starting from the piston to the nozzle [49]. The initial turbulent
kinematic eddy viscosity was defined as four times the air kinematic viscosity (68 10
m2/s) [42], [48]. The CFD solution parameters were then specified in terms of momentum,
pressure and transport equation solvers and which turbulence model to be used to
resolve the turbulent fluctuations. In the CFD model, the air jet inlet diameter was set to
2.4 mm, as measured for the nozzle of CorVis-ST, and the air maximum velocity at the
inlet was set to 167.8 m/s. The surface that surrounds the jet diameter was set as a
no-slip wall boundary condition and the side was open to the air with gauge pressure equal
to zero. Lastly, the cornea and 4 mm ring from sclera, were set to a co-simulation, data
exchange interface.
2. 3 Fl id- c e in e ac ion co- im la ion
In the fluid-structure coupled analysis, the eye finite element model imported the forces
10
to the CFD model at every time step (tn) of the job as shown in Figure 5. The structure
model calculates deformations (line 1) and sends them to the fluid model (line 2) which
in turn calculates pressure loads (line 3) and returns them back to the structure model
(line 4). For the co-simulation step to run successfully, the interaction surfaces in the eye
and air models should be exactly the same with the same node numbering. The air puff
test is a transient problem, and Abaqus/CFD used an advanced second-order projection
method to create an arbitrary deforming mesh [50]. It used node-centred finite-element
discretization for the pressure and a cell-centred finite volume discretisation of all other
transported variables (such as velocity, temperature, turbulence, etc.) [42]. This hybrid
meshing approach removed the need for any artificial dissipation, while preserving the
traditional conservation properties associated with the finite volume method. The parallel
preconditioned Krylov solvers (DSGMRES-ILUFGMRES) [51] [53] were the main
solution methods for transport equations including momentum and turbulence with
prescribed iteration limit and convergence criteria, see Appendix 1. The pressure and
distance function equations were solved with one of Krylov solvers and strong multigrid
algebraic preconditioner such as (AMG-SSORCG-DSCG) [50], [54], [55].
The time was integrated using second-order accuracy and all other diffusive and
advective terms were integrated using the Crank-Nicolson method [56]. The CFL
(Courant-Friedrichs-Lewy) stability condition was satisfied also by continually adjusting
the time increment size. The maximum value for CFL number was kept at 0.45. The CFL
condition was necessary for partial differential equations' solution convergence [57], [58].
It must be less than one for explicit solvers to converge since the full numerical domain
of dependence must contain the physical domain of dependence like Laney's definition
[59].
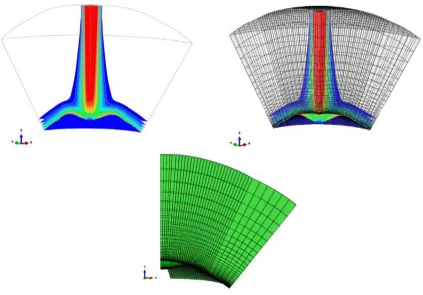
2. 3.1 Arbitrary Lagrangian-Eulerian (ALE) deforming mesh
In FSI applications, where there are large solid deformations, the adaptive mesh is
11
That was done in the current model using Arbitrary Lagrangian-Eulerian (ALE) deforming
mesh method which has the following characteristics; the mesh motion is constrained
only at the free boundaries but everywhere else the material and mesh motion are
independent. The adaptive meshing incorporates two main tasks; creating a new mesh
and remapping the solution variables, through a process named advection, from the old
mesh to the new mesh [60] [63]. The meshing was created at a pre-specified frequency
accompanied by a combination of mesh smoothing methods [42]. Then, remapping the
solution variables to the new mesh is of second-order accuracy and conserves mass and
momentum. Moreover, for FSI stabilisation, the solution control parameters were used
to maintain mesh quality and control the mesh motion, see Appendix 1. The adaptive
deformable mesh for a quarter model of the air puff model is shown in Figure 6 showing
the initial mesh and the mesh at corneal highest concavity.
2. 4 Clinical da a e
A clinical dataset of 476 healthy patients from the Vincieye Clinic in Milan, Italy and Rio
de Janeiro Corneal Tomography and Biomechanics Study Group, Brazil, was used to
validate the numerical model. Institutional review board (IRB) ruled that approval was not
obligatory for this record review study. However, the ethical standards as set in the 1964
Declaration of Helsinki, and revised in 2000, were observed. All patients provided
informed consent before using their data in the study. All patients had a complete
ophthalmic examination, including the CorVis ST and Pentacam (OCULUS Optikgeräte
GmbH; Wetzlar, Germany) exams.
The inclusion criteria of healthy subjects were a Belin/Ambrósio Enhanced Ectasia total
deviation index (BAD-D) of less than 1.6 the standard deviation (SD) from normative
values in both eyes, no previous ocular surgery and disease, myopia less than 10D and
no concurrent or previous glaucoma or hypotonic therapies [64]. Moreover, to confirm
the diagnosis, all exams of each clinic were blindly re-evaluated by a corneal expert at
12
Cornea biomechanical response parameters were collected from the CorVis-ST
including maximum deformation, applanation pressures and times, highest concavity,
spatial and temporal deformations with age ranging from (10-87 years), central corneal
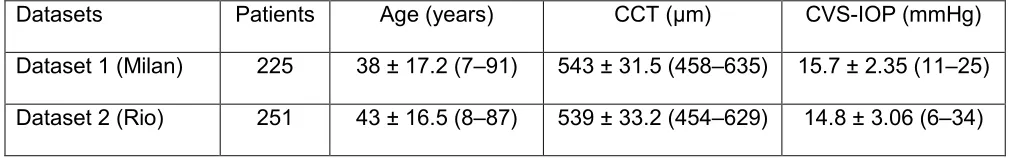
thickness (455-630 μm) and IOP (9-25 mmHg). Table 1 provides descriptive statistics of
the clinical dataset for Milan and Rio's centres.
Patient specific numerical eye models were produced using an in house MATLAB code
to perform a parametric study with wide range of CCT, IOP and corneal material
properties starting from the stress-free geometry. Their deformation patterns, as a
response to the air puff, were analysed and compared against the clinical behaviour.
3. Re l
3. 1 Ai ff a e e
The air puff was analysed to see change of the velocity, pressure and mesh deformation
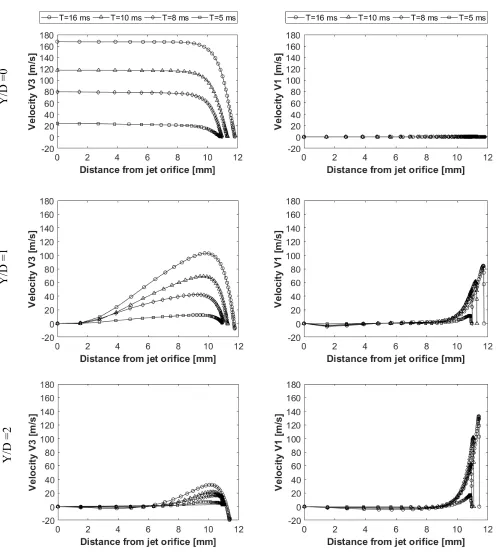
during the test. Figure 7 shows two velocity components of the air puff, the axial velocity
(V3) normal to the cornea and velocity component (V1) parallel to the cornea at three
normal traverses (Y/D=0, Y/D=1, Y/D=2), shown in Figure 3, and 4 time steps (T= 5, 8,
10, 16 ms). By the time, the puff gets stronger to reach its maximum strength at T= 16
ms and as the distance from the puff orifice increases, the normal velocity decreases
until it reaches zero at the stagnation point on the cornea surface. By changing the path
or the axial traverse further away from the cornea centre, the puff gets weaker and is
noticed at (Y/D= 1 and 2), there are some negative values for the normal velocity
indicating reflection of the air from cornea surface in the opposite direction to the flow.
The jet accelerates parallel to the cornea forming a radial wall jet, developing with time
and by going further from the cornea centre axis. This explains why there is a negative
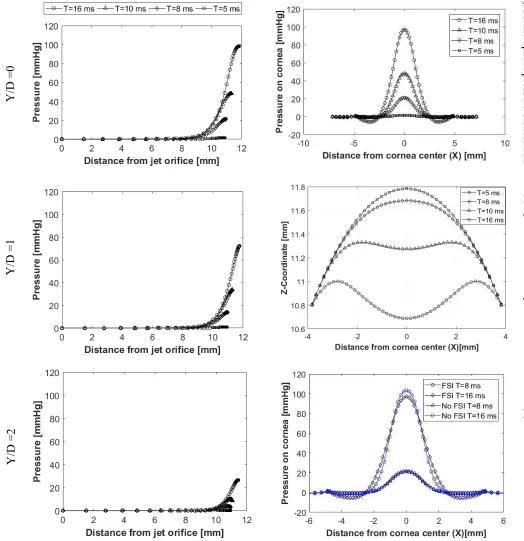
pressure observed at this location of the cornea. The pressure was found to change with
corneal deformations and time steps as illustrated in Figure 8. I no iced from he plo
13
movement of cornea with time of the test. Pressure here represents the static pressure,
it starts with zero at the jet orifice and increase gradually towards the cornea because of
transforming the dynamic pressure into static pressure.
Fluid structure interaction was found to have an effect on the pressure distribution on
cornea during time of the air puff test.Figure 8(a) shows the pressure distribution change
with time and the region where there is negative pressure. Graph (b) shows the
progression of corneal deformation with time, while graph (c) indicates the difference
between, taking the FSI effect into account, and ignoring it, through considering the
cornea as a rigid, non-deformable, surface. Two different simulations of the turbulent jet
were performed; one impinging on a rigid corneal surface with no moving boundaries
and the other using FSI coupling between air and eye models to consider corneal
deformations.
3. 2 Pa ame ic d e l
A parametric study was done on the coupled model of the air puff test by changing four
parameters of the eye model and simulating response of the cornea to the air puff, this
gives a great understanding of how corneal biomechanical parameters affect its
deformation, which in turn, affect IOP measurement and corneal material estimation. The
four parameters involved in the study were:
Cornea material stiffness coefficient (
μ
)Central corneal thickness (CCT)
Corneal curvature radius (R)
Intraocular pressure (IOP)
The total number of models included in the study were 110 models with wide ranges for
CCT, IOP, R and corneal material coefficient (
μ
) representing the change in corneal14
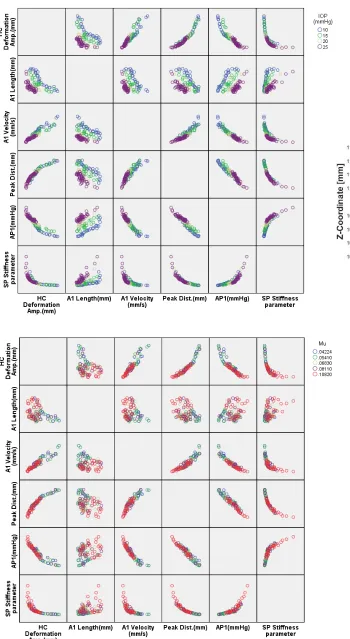
corneal response parameters with different colour for each value. In graph (a) six corneal
response parameters were plotted against each other and at different levels of IOP. The
first row for the highest concavity (HC) deformation, is the most explaining parameter.
By increasing IOP, the HC deformation is lower. The opposite is happening with the
stiffness parameter (SP-HC), equation (2), for higher IOP, the stiffness parameter is
higher. In graph (b), by increasing the stiffness of corneal material, the amount of
deformation decreases and the peak distance (PD) between the applanation points
shows the same trend. Graph (c) illustrates the corneal profile stages from initial
geometry to highest concavity.
SP-HC 1
1 (2)
After showing, graphically, influence of the parameters involved in the parametric study,
it was vital to quantify correlations and significance of relationships between parametric
study's input and output parameters, to choose which response parameters were
influenced more by changing IOP and corneal stiffness. This was an important outcome
of the present study, as estimation algorithms for IOP and corneal material behaviour
are required to correct fluid structure interaction effect between the air puff and human
cornea. A bivariate correlation analysis using SPSS statistics (version 24, IBM Corp.)
was performed to obtain Pearson's correlation coefficient (r) and two-tailed significance
t-test to know the significance level of correlations (P-value). Descriptive statistics of the
parametric study are shown in Table 2 providing mean, standard deviation, minimum
and maximum of input and output parameters for 110 different eye models.
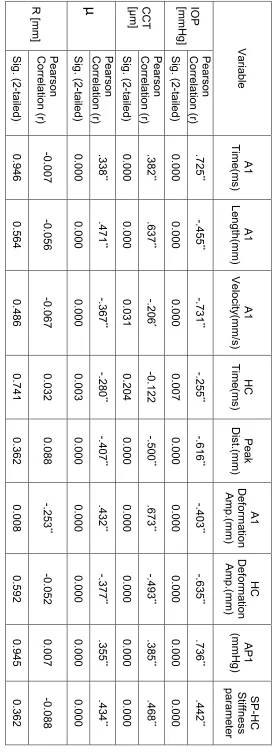
Table 3 provides values of Pearson's correlation coefficient (r) between input and output
response parameters which gives an indication on correlation's strength and direction.
The highest correlated parameters to IOP change were; first applanation pressure (AP1),
first applanation velocity (A1 velocity), first applanation time (A1 time) with r= 0.736, .731,
15
by the double asterisk next to the value of r. One of these three corneal response
parameters was chosen, along with central corneal thickness (CCT), corneal curvature
(R) and corneal material stiffness parameter (µ), to enter an estimation algorithm for IOP.
On the other hand, the first applanation length (A1 length) and stiffness parameter
(SP-HC) were the most associated response parameters to corneal material change with
correlation coefficients of 0.471 and 0.442 respectively at significance level of 0.01 (P <
0.01).
3. 3 Clinical alida ion of n me ical e l
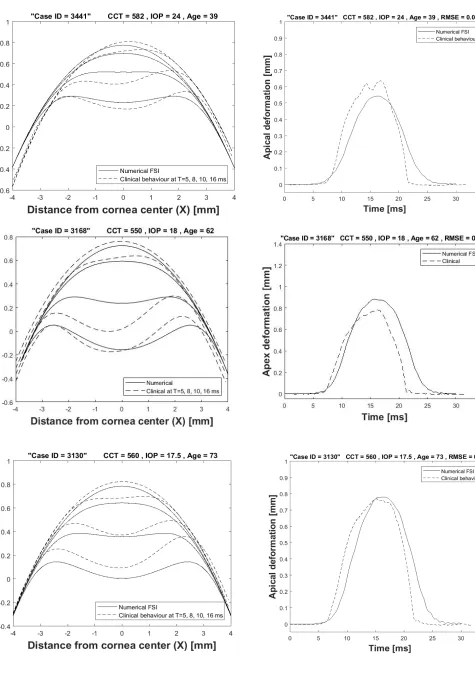
A set of clinical data for 476 patients from Milan and Rio datasets were used in the
validation process. All patients have performed the air puff test using the same device
(CorVis-ST). The spatial and temporal corneal deformations for three patients are shown
in Figure 10 in comparison with the deformations from patient specific fluid-structure
interaction models. A good agreement and close behaviour to the clinical corneal
behaviour was achieved. The left column of graphs shows the spatial corneal
deformation profiles at four time steps T= 5, 8, 10, 16 ms. The difference in profiles is
due to the fact that biological tissue is different in responding to the air puff and is not
guaranteed that the puff is applied to the cornea centre with the same angle and distance
from the nozzle. The right column of figures shows the temporal apical deformation
numerically and clinically with the value of root mean square error shown on the top.
In order to validate the parametric study, the same descriptive statistics and correlation
analysis, which were done for the parametric study, were performed to the clinical
dataset to see if there are any differences, before considering them in the IOP estimation
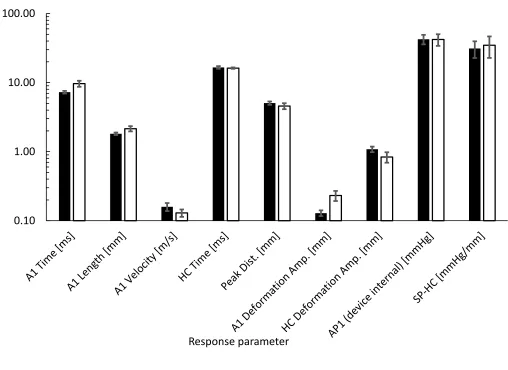
algorithm in the future. Figure 11, provides a bar-chart to compare the means and
standard deviations of the dynamic corneal response parameters numerically and
clinically. The biggest difference was in the first applanation deformation amplitude with
76.9 % higher and HC deformation amplitude with 22.2 % less. In terms of Pear on
16
highest correlated parameter to IOP (r=.927, P<.0001) followed by A1 time (r=.889,
P<.0001) and stiffness parameter (SP-HC) (r=.857, P<.0001) which is the same as the
numerical database apart from A1 velocity which was found the highest after AP1.
4. Di c ion
The current study made use of numerical simulation of the non-contact tonometry test
and the parametric study to better understand the corneal material behaviour under
dynamic loading with more focus on the fluid structure interaction from outside the eye.
The accurate material characterisation for cornea can help ophthalmologists and
surgeons in treatment management and surgical planning before any physical
intervention. Understanding the material mechanical response can be used in diagnosis
of some diseases which alter the corneal stiffness such as keratoconus and ectatic
diseases [65] [67]. On the other hand, biomechanical correction of IOP measurement
has been the focus of many studies in the past [14], [49], [68]. Some studies focused on
the association of IOP with central corneal thickness CCT and corneal curvature radius
R, other studies studied the material properties effect, but most of the them were
structural in nature with no sufficient consideration to the fluid structure interaction effect
between cornea and the air puff.
In order to accurately take into account, fluid structure interaction effect on the corneal
response to loading, the two domains need to be solved simultaneously to exchange the
data between them at each time step of the solution. The finite element model of the eye
was based on the mass, force and stiffness matrices to calculate the structural material
deformation. On the other hand, the CFD model of the air jet was governed by
momentum and continuity equations to calculate pressure and velocity fields of the flow.
The coupled model of fluid structure interaction (FSI) between the eye and an air puff
was successfully built and validated through comparison of the corneal deformations
from the numerical model against clinical corneal response parameters acquired from
1
forms; the first form was by presenting cornea deformation profiles at 4 time captures of
the test (5, 8, 10, 16 ms) along with the temporal apical corneal deformation, which has
shown close but not perfect agreement. This is due to the fact that soft tissue materials
are not easily to be expected and represented numerically through one material model.
The second form was through calculating dynamic corneal response (DCR) parameters
(A1 Time (ms), A1 Length (mm), A1 Velocity (mm/s), HC Time (ms), Peak Distance
(mm), A1 Deformation Amplitude (mm), HC Deformation Amplitude (mm), AP1 (mmHg),
SP-HC Stiffness parameter) and comparing them against the same parameters obtained
clinically. These correlation analysis produced between these parameters will be used in
the near future to develop a new corneal material estimation algorithm which does not
depend only on patient age b al o depend on he pa ien pecific corneal re pon e
parameters.
The air puff was analysed for three main variables, the axial velocity (V3), the parallel
velocity (V1) and the pressure (P). These three variables give indication on the validity
of the solution in both models, the CFD and the FE. Values of V3 and V1 validated the
near wall treatment of the CFD code, the transport equations solution at the
impingement region and wall jet region, which is more obvious at (Y/D=1, 2).
From the results, there are some limitations appeared when comparing between the
numerical and the clinical deformations, this difference refers to more than one
parameter. The first parameter is the boundary conditions applied to the eye model. The
eye model was supported from the equatorial nodes to prevent movement in the
(Anterior-posterior) direction. There is some work in progress to simulate the fatty tissue
around the eye to remove that boundary condition and allow whole eye movement.
Another important material effect is the hysteresis influence which is related to the
viscoelastic behaviour of the cornea. When the cornea reflects back after the application
of the air puff, it has some relaxation time and memory effect to return back to the original
1
an angle from the eye axis and a modification for the mesh was done to apply the air puff
at an angle same as the clinical shooting.
E hical a emen
A clinical dataset of 476 healthy patients from the Vincieye Clinic in Milan, Italy and Rio
de Janeiro Corneal Tomography and Biomechanics Study Group, Brazil, was used to
validate the numerical model. Institutional review board (IRB) ruled that approval was not
obligatory for this record review study. However, the ethical standards as set in the 1964
Declaration of Helsinki, and revised in 2000, were observed. All patients provided
informed consent before using their data in the study. All patients had a complete
ophthalmic examination, including the CorVis-ST and Pentacam (OCULUS Optikgeräte
GmbH; Wetzlar, Germany) exams. The inclusion criteria of healthy subjects were a Belin/
Ambrósio Enhanced Ectasia total deviation index (BAD-D) of less than 1.6 the standard
deviation (SD) from normative values in both eyes, no previous ocular surgery and
disease, myopia less than 10D and no concurrent or previous glaucoma or hypotonic
therapies [64]. Moreover, to confirm the diagnosis, all exams of each clinic were blindly
re-evaluated by a corneal expert at the other clinic.
Conflic of in e e a emen
Prof. Elsheikh is a consultant for OCULUS Optikgeräte GmbH. None of the remaining
authors have financial disclosures or personal interests in the work reported in this
paper.
F nding a emen
No funding received to support this research.
Ackno ledgemen
We would like to acknowledge the Vincieye Clinic in Milan, Italy and Rio de Janeiro
1
the clinical data provided. Great appreciation to OCULUS Optikgeräte GmbH for their
support with CorVis-ST.
Nomencla e
𝐼𝑂𝑃 Intraocular Pressure
𝐶𝐶𝑇 Central Corneal Thickness
𝐶𝐹𝐷 Computational Fluid Dynamics
𝐹𝐸 Finite Element
𝐹𝑆𝐼 Fluid Structure Interaction
𝐴𝐿𝐸 Arbitrary Lagrangian-Eulerian
𝐶𝑜𝑟𝑉𝑖𝑠 𝑆𝑇 Corneal Visualisation Scheimpflug Technology
𝑂𝑅𝐴 Ocular Response Analyser
𝑅 Reynolds number
𝐻𝐶𝑅 Highest Concavity Radius
𝑃𝐷 Peak Distance
𝑆𝑃 𝐻𝐶 Stiffness Parameter at highest concavity
20
Refe ence
[1] Fundamentals of Biomechanics. Boston, MA: Springer US, 2007.
[2] J. Li and C. J. Rober , Infl ence of corneal biomechanical proper ie on
in raoc lar pre re mea remen : Q an i a i e anal i , J. Cataract Refract.
Surg., vol. 31, no. 1, pp. 146 155, 2005.
[3] P. Han elaer, The H man E e, Nature, vol. 10, no. 248, pp. 243 243, 1874.
[4] S rger for Refrac i e Error , Lancet, vol. 325, no. 8426, pp. 435 436, 1985.
[5] G. M. Cochrane, R. D Toi , and R. T. Le Me rier, Managemen of refrac i e
error , BMJ (Online), vol. 340, no. 7751. pp. 855 860, 2010.
[6] D. L ce, Air Jet Temporal and Spatial Pressure Properties of the Reichert
Oc lar Re pon e Anal er (ORA), Invest. Ophthalmol. Vis. Sci., vol. 46, no. 13,
pp. 5009 5009, May 2005.
[7] D. A. L ce, De ermining in i o biomechanical proper ie of he cornea i h an
oc lar re pon e anal er, J. Cataract Refract. Surg., vol. 31, no. 1, pp. 156
162, Jan. 2005.
[8] R. Ambrósio et al., D namic l ra high peed cheimpfl g imaging for a e ing
corneal biomechanical proper ie , Rev. Bras. Oftalmol., vol. 72, no. 2, pp. 99
102, 2013.
[9] T.-H. K on, J. Ghabo i, D. a Pecknold, and Y. Ha ha h, Role of corneal
biomechanical proper ie in applana ion onome r mea remen ., J. Refract.
Surg., vol. 26, no. 7, pp. 512 519, 2010.
[10] A. El heikh, C. W. McMonnie , C. Whi ford, and G. C. Boneham, In i o d
21
no. 1, p. 20, 2015.
[11] O. Abitbol, J. Bouden, S. Doan, T. Hoang-X an, and D. Ga inel, Corneal
hysteresis measured with the ocular response analyzer®in normal and
gla coma o e e , Acta Ophthalmol., vol. 88, no. 1, pp. 116 119, 2010.
[12] T. T. Andrea en, A. Hjor h Simon en, and H. O l nd, Biomechanical
proper ie of kera ocon and normal cornea , Exp. Eye Res., vol. 31, no. 4,
pp. 435 441, 1980.
[13] R. Vinciguerra et al., De ec ion of Kera ocon Wi h a Ne Biomechanical
Inde , J. Refract. Surg., vol. 32, no. 12, pp. 803 810, 2016.
[14] A. Eliasy et al., E -vivo experimental validation of biomechanically-corrected
in raoc lar pre re mea remen on h man e e ing he CorVi ST, Exp.
Eye Res., vol. 175, no. June, pp. 98 102, 2018.
[15] F. Bao, B. Geragh , Q. Wang, and A. El heikh, Con idera ion of corneal
biomechanics in the diagnosis and management of keratoconus: is it
impor an ?, Eye Vis., vol. 3, no. 1, p. 18, Dec. 2016.
[16] D. P. Pi ero and N. Alc n, Corneal biomechanic : a re ie , Clin. Exp. Optom.,
vol. 98, no. 2, pp. 107 116, Mar. 2015.
[17] J. Kera re , J. Colin, D. To bo l, and C. Rober , Biomechanical
charac eri ic of he ec a ic cornea, J. Cataract Refract. Surg., vol. 34, no. 3,
pp. 510 513, 2008.
[18] Z. Han et al., Air P ff Ind ced Corneal Vibra ion : Theore ical Sim la ion and
Clinical Ob er a ion , J. Refract. Surg., vol. 30, no. 3, pp. 208 213, 2014.
[19] A. P. Irene Simoninia, Ma ri io Angelillob, Theore ical and n merical anal i of
22
[20] M. Kaneko, K. Tok da, and T. Ka ahara, D namic en ing of h man e e,
IEEE Int. Conf. Robot. Autom., no. April, pp. 2871 2876, 2005.
[21] S. Kling, N. Beke i, C. Dorron oro, D. Pa c al, and S. Marco , Corneal
viscoelastic properties from finite-element analysis of in vivo air-puff
deforma ion, PLoS One, vol. 9, no. 8, 2014.
[22] M. Ariza-Gracia, J. F. Zurita, D. P. Piñero, J. F. Rodriguez-Matas, and B. Calvo,
Co pled biomechanical re pon e of he cornea a e ed b non-contact
tonome r . A im la ion d , PLoS One, vol. 10, no. 3, pp. 1 15, 2015.
[23] S. M ench, M Roellig, E Spoerl, and D Bal ani, N merical and
Experimental Study of the Spatial Stress Distribution on the Cornea Surface
During a Non-Contact Tonometry Examina ion, 2018.
[24] A. Mon anino, M. Angelillo, and A. Pandolfi, Modelling i h a me hfree
approach the cornea-aq eo h mor in erac ion d ring he air p ff e , J.
Mech. Behav. Biomed. Mater., vol. 77, no. March 2017, pp. 205 216, 2018.
[25] A. Montanino, M. Angelillo, and A. Pandolfi, A 3D fl id-solid interaction model of
he air p ff e in he h man cornea, J. Mech. Behav. Biomed. Mater., vol. 94,
pp. 22 31, Jun. 2019.
[26] M. Á. Ariza-Gracia, W. Wu, B. Calvo, M. Malvè, P. Büchler, and J. F. Rodriguez
Ma a , Fl id structure simulation of a general non-contact tonometry. A
req ired comple i ?, Comput. Methods Appl. Mech. Eng., vol. 340, pp. 202
215, Oct. 2018.
[27] B. A. Ng en, C. J. Rober , and M. A. Reill , Biomechanical Impac of he
Sclera on Corneal Deformation Response to an Air-Puff: A Finite-Element
S d , Front. Bioeng. Biotechnol., vol. 6, no. January, pp. 1 8, 2019.
23 je fla , J. Fluid Mech, vol. 147, pp. 397 429, 2018.
[29] T. J. Craf , L. J. W. Graham, and B. E. La nder, Impinging je die for
turbulence model assessment II. An examination of the performance of four
rb lence model , Int. J. Heat Mass Transf., vol. 36, no. 10, pp. 2685 2697,
Jul. 1993.
[30] J. W. Ga n ner, J. N. B. Li ingood, and P. Hr cak, S r e of li era re on flo
charac eri ic of a ingle rb len je impinging on a fla pla e, NASA Tech.
Memo., no. February, p. 43, 1970.
[31] C. Donald on and R. Snedeker, A d of free jet impingement. Part 1. Mean
proper ie of free and impinging je , J. Fluid Mech, vol. 45, no. 2, p. 281, 1971.
[32] K. J. Hammad and I. Milano ic, Flo S r c re in he Near-Wall Region of a
S bmerged Impinging Je , J. Fluids Eng., vol. 133, no. 9, p. 91205, 2011.
[33] J. Larra , Plane rb len impinging je , J. Hydraul. Res., vol. 12, no. 2, pp.
279 282, 1974.
[34] O. O. Gmbh, Pen acam mea remen principle, 2019. [Online]. A ailable:
https://www.pentacam.com/int/technology/measurement-principle-licences-network.html. [Accessed: 27-Jan-2019].
[35] A. Elsheikh, C. Whitford, R. Hamarashid, W. Kassem, A. Joda, and P. Büchler,
S re free config ra ion of he h man e e, Med. Eng. Phys., vol. 35, no. 2, pp.
211 216, Feb. 2013.
[36] A. Kotecha, A. Elsheikh, C. R. Roberts, H. Zhu, and D. F. Garway-Heath,
Corneal hickne - and age-related biomechanical properties of the cornea
mea red i h he oc lar re pon e anal er, Investig. Ophthalmol. Vis. Sci.,
vol. 47, no. 12, pp. 5337 5347, 2006.
24 Regional aria ion in he biomechanical proper ie of he h man clera, Exp.
Eye Res., vol. 90, pp. 624 633, 2010.
[38] A. Eliasy et al., De ermina ion of Corneal Biomechanical Beha ior in-vivo for
Healthy Eyes Using CorVis ST Tonometry: Stress-S rain Inde , Front. Bioeng.
Biotechnol., vol. 7, p. 105, May 2019.
[39] R. W. Ogden, Compre ible R bberlike Solid Large deformation isotropic
ela ici : on he correla ion of heor and e perimen for compre ible
r bberlike olid , Proc. R. Soc. A Math. Phys. Eng. Sci., vol. 328, no. 1575, pp.
567 583, 1972.
[40] R. W. Ogden, Non-linear elastic deformations. Dover Publications, 1997.
[41] A. Pandolfi and G. A. Hol apfel, Three-Dimensional Modeling and
Computational Analysis of the Human Cornea Considering Distributed Collagen
Fibril Orien a ion , J. Biomech. Eng., vol. 130, no. 6, p. 61006, Dec. 2008.
[42] Abaq , ABAQUS/S andard anal i er man al 14.2, SIMULIA, 2014.
[43] G. J. (Gordon J. Van Wylen and R. E. Sonntag, Fundamentals of classical
thermodynamics. Wiley, 1985.
[44] A. Villamarin, S. Roy, R. Hasballa, O. Vardoulis, P. Reymond, and N.
S ergiop lo , 3D im la ion of he aq eo flo in he h man e e, Med. Eng.
Phys., vol. 34, no. 10, pp. 1462 1470, Dec. 2012.
[45] NASA, T rb lence Modeling Re o rce: The Spalar-allmara T rb lence,
Recherche, 2011. [Online]. Available: https://turbmodels.larc.nasa.gov/.
[46] H. K. Ver eeg and W. Malala ekera, An In rod c ion o Comp a ional Fl id
Dynamics - The Fini e Vol me Me hod, Fluid flow handbook. McGraw-Hill .
25
[47] E. E. Shpilrain, AIR (PROPERTIES OF), A-to-Z Guid. to Thermodyn. Heat
Mass Transf. Fluids Eng., vol. a, 2006.
[48] P. J. Rigden, Vi co i of air [15], Nature, vol. 141, no. 3558. p. 82, 1938.
[49] A. A. Joda, M. M. S. Sher in, D. Kook, and A. El heikh, De elopmen and
alida ion of a correc ion eq a ion for Cor i onome r , Comput. Methods
Biomech. Biomed. Engin., vol. 19, no. 9, pp. 943 953, 2015.
[50] D. Shirokoff and R. R. Ro ale , An efficien me hod for he incompre ible
Navier-Stokes equations on irregular domains with no-slip boundary conditions,
high order p o he bo ndar , 2010.
[51] C. T. Kelle , I era i e Me hod for Linear and Nonlinear Eq a ion , Society, vol.
16, no. 11, p. 166, 1995.
[52] J. Drko o , A. Greenba m, M. Ro lo n k, and Z. S rako , N merical abili
of GMRES, BIT Numer. Math., vol. 35, no. 3, pp. 309 330, 1995.
[53] A. P e o and D. W. Zingg, Efficien Ne on-Krylov Solver for Aerodynamic
Comp a ion , AIAA J., 1998.
[54] G. W. S , J. T. Geller, J. R. H n , and K. Pr e , _A re ie of algebraic
m l igrid.pdf, Vadose Zo. J, vol. 3, no. 2, pp. 592 601, 2004.
[55] D. R. Kincaid, J. R. Re pe , D. M. Yo ng, and R. R. Grime , Algori hm 586:
ITPACK 2C: A FORTRAN Package for Solving Large Sparse Linear Systems by
Adap i e Accelera ed I era i e Me hod , ACM Trans. Math. Softw., vol. 8, no. 3,
pp. 302 322, 1982.
[56] J. Crank and P. Nicol on, A prac ical me hod for n merical e al a ion of
solutions of partial differential equations of the heat-cond c ion pe, Math.
26
[57] R. Courant, H. Lewy, and K. Friedrich , ber die par iellen
Differen engleich ngen der ma hema i chen Ph ik, Math. Ann., vol. 100, pp.
32 74, 1928.
[58] C. A. de Moura and C. S. Kubrusly, Eds., The Courant Friedrichs Lewy (CFL)
Condition. Boston: Birkhäuser Boston, 2013.
[59] C. B. Laney, Computational Gasdynamics. Cambridge: Cambridge University
Press, 1998.
[60] M. Kcharik, R. Li ka, P. V chal, and M. Sha hko , Arbi rar Lagrangian
-E lerian (AL-E) Me hod in compre ible fl id d namic , Appl. Math. Sci., pp. 1
6, 2007.
[61] J. Hron and S. T rek, A Monoli hic FEM/M l igrid Sol er for an ALE Form la ion
of Fluid-S r c re In erac ion i h Applica ion in Biomechanic , in
Fluid-Structure Interaction, Berlin, Heidelberg: Springer Berlin Heidelberg, 2006, pp.
146 170.
[62] J. Donea, A. Huerta, J.-P. Ponthot, and A. Rodríguez-Ferran, Arbi rar
Lagrangian-E lerian Me hod , in Encyclopedia of Computational Mechanics
Second Edition, 2017, pp. 1 23.
[63] M. So li and J. P. Zole io, Arbi rar Lagrangian-Eulerian and free surface
me hod in fl id mechanic , Comput. Methods Appl. Mech. Eng., vol. 191, no.
3 5, pp. 451 466, 2001.
[64] O. F. Villavicencio, F. Gilani, M. A. Henriquez, L. Izquierdo, and R. R. Ambrósio,
Independen Pop la ion Valida ion of he belin / Ambr io Enhanced Ectasia
di pla : Implica ion for Kera ocon die and creening. .
[65] W. J. D pp and S. E. Wil on, Biomechanic and o nd healing in he cornea,
2
[66] A. Pandolfi, G. Fotia, and F. Manganiello, Fini e elemen im la ion of la er
refrac i e corneal rger , in Engineering with Computers, 2009, vol. 25, no. 1,
pp. 15 24.
[67] A. Gefen, R. Shalom, D. Elad, and Y. Mandel, Biomechanical anal i of he
kera oconic cornea, J. Mech. Behav. Biomed. Mater., vol. 2, no. 3, pp. 224 236,
2009.
[68] A. Sinha Ro , M. K rian, H. Ma alia, and R. She , Air-puff associated
quantification of non-linear biomechanical properties of the human cornea in
i o, J. Mech. Behav. Biomed. Mater., vol. 48, no. July, pp. 173 182, 2015.
[image:27.595.45.550.508.587.2]Table
Table 1: Clinical dataset used in validation of the numerical model of the air puff test
[image:27.595.85.517.687.752.2]*Note: CCT is central corneal thickness; CVS-IOP is CorVis IOP measurement
Table 2: Descriptive statistics of 110 models of the parametric study, the bold line separates input from output parameters
Variable Mean Std. Deviation Minimum Maximum
IOP (mmHg) 18.36 6.25 10 25
Datasets Patients Age (years) CCT ( m) CVS-IOP (mmHg)
Dataset 1 (Milan) 225 38 ± 17.2 (7 91) 543 ± 31.5 (458 635) 15.7 ± 2.35 (11 25)
2
CCT (µm) 550.45 73.99 445 645
µ 0.0712 0.0236 0.0422 0.1082
R (mm) 7.82 0.33 7.4 8.4
A1 Time (ms) 9.66 0.97 7.81 12.47
A1 Length (mm) 2.15 0.19 1.91 2.62
A1 Velocity (mm/s) 0.13 0.04 0.06 0.21
HC Time (ms) 16.21 0.36 15.3 16.9
Peak Distance (mm) 4.58 0.95 2.46 6.62
A1 Def. Amp.(mm) 0.23 0.05 0.17 0.39
HC Def. Amp.(mm) 0.84 0.3 0.42 1.77
AP1(mmHg) 42.09 12.09 18.82 75.24
2 T ab le 3: C or rel atio n and rel atio nsh ip si gn ifican ce an al ysi s be tw ee n in pu t an d out pu t pa rame ter s of the pa rame tric st ud y *No te: IO P is int rao cul ar pressure ; C C T is cen tral corneal thi ck ne ss ;
μ
is c orneal m ate rial s tiff ne ss coe ffici en t; R is corneal c urv atur e rad ius ; A1 is the fir st ap pl an ati on ; H C is the hi g he st con cav ity ; A P1 is t
[image:29.595.208.482.48.800.2]30
[image:30.595.137.449.188.298.2]Fig e
Figure 1: Dynamic model of the human eye as one and two degrees of freedom [14]
[image:30.595.67.554.395.615.2](a) (b)
31
Figure 3: Geometry definition of the air puff and eye domains showing key dimensions, element types and boundary conditions. Ux , Uy , Uz are the deformations in the three dimensions
[image:31.595.130.443.476.726.2]32
Figure 5: Flow of the solution in the fluid structure interaction coupling at each time step
[image:32.595.91.514.347.642.2]33
Y/D
=0
Y/D
=
2
Y/D
=
1
[image:33.595.47.545.129.684.2]
Air puff axial velocity traverses (V3) Air puff parallel velocity traverses (V1)
34
Y/D
=0
Y/D
=
2
Y/D
=
1
(a) Air puff pressure traverses (P) Air puff spatial pressure and deformation profiles
(b)
C
or
nea
s
pa
tial
p
re
ss
ur
e
di
str
ibut
ion
(c)
S
pat
ia
l de
for
m
at
ion pr
of
iles
(d)
FS
I ef
fe
[image:34.595.35.559.141.682.2]ct
35
Figure 9: Influence matrix of changing intraocular pressure (IOP) (a) and corneal material stiffness (b) on corneal response parameters, while (c) illustrates the corneal profile stages
(a)
(c)
36
C
li
nica
l ca
se
2
C
li
nica
l ca
se
[image:36.595.65.540.42.716.2]1
Figure 10: Spatial corneal deformation and temporal apical deformation comparison with 3 clinical cases
C
li
nica
l ca
se
3
Figure 11: Corneal response parameters comparison between clinical and numerical results of the parametric study 0.10
1.00 10.00 100.00
P
ar
ame
ter
s'
val
u
es
Response parameter