https://doi.org/10.5194/bg-15-5565-2018 © Author(s) 2018. This work is distributed under the Creative Commons Attribution 4.0 License.
Technical note: A simple and cost-efficient automated floating
chamber for continuous measurements of carbon dioxide
gas flux on lakes
Kenneth Thorø Martinsen, Theis Kragh, and Kaj Sand-Jensen
Freshwater Biological Laboratory, Biological Institute, University of Copenhagen, Universitetsparken 4, 3rd. floor, 2100 Copenhagen, Denmark
Correspondence:Kenneth Thorø Martinsen ([email protected]) Received: 31 January 2018 – Discussion started: 2 February 2018
Revised: 28 August 2018 – Accepted: 5 September 2018 – Published: 19 September 2018
Abstract.Freshwaters emit significant amounts of CO2on a
global scale. However, emissions remain poorly constrained from the diverse range of aquatic systems. The drivers and regulators of CO2gas flux from standing waters require
fur-ther investigation to improve knowledge on both global-scale estimates and system-scale carbon balances. Often, lake– atmosphere gas fluxes are estimated from empirical models of gas transfer velocity and air–water concentration gradient. Direct quantification of the gas flux circumvents the uncer-tainty associated with the use of empirical models from con-trasting systems. Existing methods to measure CO2gas flux
are often expensive (e.g. eddy covariance) or require a high workload in order to overcome the limitations of single point measurements using floating chambers. We added a small air pump, a timer and an exterior tube to ventilate the floating chamber headspace and passively regulate excess air pres-sure. By automating evacuation of the chamber headspace, continuous measurements of lake CO2 gas flux can be
ob-tained with minimal effort. We present the chamber modi-fications and an example of operation from a small forest lake. The modified floating chamber performed well in the field and enabled continuous measurements of CO2gas flux
with 40 min intervals. Combining the direct measurements of gas flux with measurements of air and waterside CO2partial
pressure also enabled calculation of gas exchange velocity. Building and using the floating chamber is straightforward. However, because an air pump is used to restart measure-ments by thinning the chamber headspace with atmospheric air, the duration of the air pump pause–pulse cycle is critical and should be adjusted depending on system characteristics. This may result in shorter deployment duration, but this
re-striction can be circumvented by providing a stronger power source. The simple design makes modifications of the cham-ber dimensions and technical additions for particular appli-cations and systems easy. This should make this approach to measuring gas flux flexible and appropriate in a wide range of different systems.
1 Introduction
Freshwaters are important components of regional and global carbon budgets (Duarte and Prairie, 2005; Raymond et al., 2013). Lakes in particular have received attention as hotspots of carbon cycling emitting CO2 and CH4 to the
atmo-sphere (Tranvik et al., 2009; Holgerson and Raymond, 2016; Bastviken et al., 2011; Wik et al., 2016). However, the role and magnitude of carbon emissions from lakes remain un-certain as the estimated gas fluxes often depend on empir-ical models of gas exchange velocity with substantial un-certainty. To apply direct measurements and improve cur-rent knowledge of drivers of temporal and spatial variabil-ity of lake CO2 gas fluxes, cost-efficient and widely
appli-cable analytical approaches are needed. Recent studies have equipped floating chambers with low-cost CO2mini-loggers
to quantify CO2gas flux and waterside CO2partial pressure
(Bastviken et al., 2015; Natchimuthu et al., 2017). We added simple and low-cost modifications to existing floating cham-bers, which provide automatic venting, enabling long-term and very frequent measurements of CO2gas fluxes and
The diffusive flux of a gas across the lake surface (F, mmol m−2h−1) can be described by the expression
(MacIn-tyre et al., 1995)
F =k(Cwater−Cair), (1)
where k is the gas exchange velocity (m h−1) and Cwater
and Cair are the waterside and air CO2 concentration
(mmol m−3), respectively. The gas exchange velocity is in-fluenced by near-surface turbulent mixing driven by wind shear and convection (Zappa et al., 2007; MacIntyre et al., 1995). Measurements of F and the concentration gradient (Cwater–Cair) allow calculation ofk. Empirical models of gas
exchange velocity have often been parameterised from wind speed (Cole and Caraco, 1998; Crusius and Wanninkhof, 2003). This approach can potentially result in erroneous es-timates of gas flux due to system-scale differences in addi-tional drivers of gas exchange velocity (Cole et al., 2010; Vachon and Prairie, 2013). For example, the contribution of convection to near-surface turbulence relative to wind shear increases with decreasing lake size (Read et al., 2012). The influence of convection on gas exchange velocity and the resulting gas flux may thus be missed if not accounted for (Holgerson et al., 2016; Podgrajsek et al., 2015). Small lakes (< 0.01 km2) are globally abundant and may comprise up to 20 % of the total surface area of lakes (Holgerson and Ray-mond, 2016) and extensive changes in CO2 concentrations
and vertical mixing make single or even several daytime measurements of CO2 fluxes insufficient to calculate daily
fluxes (Holgerson et al., 2016; Andersen et al., 2017). In-creasing the temporal resolution and measuring gas flux dur-ing day and night time would enable better models of gas exchange velocity and large-scale carbon budgets.
CO2 gas flux at the air–water interface can be
mea-sured from changes in CO2partial pressure over time in the
headspace of floating chambers (Cole et al., 2010). Installing mini-loggers to measure air CO2 concentrations has made
the use of floating chambers for determination of lake CO2
gas flux straightforward, avoiding manual sub-sampling of chamber headspace CO2 partial pressure (Bastviken et al.,
2015). Chambers can be deployed for shorter time spans (15– 60 min) in order to determine the gas flux, or they can be left to equilibrate with the CO2partial pressure of surface water
(Natchimuthu et al., 2017). The equipment is relatively cheap and easy to use compared to other methods such as eddy co-variance (Podgrajsek et al., 2014; Jammet et al., 2017) or whole-lake addition of gas tracers (Cole and Caraco, 1998; Crusius and Wanninkhof, 2003). The disadvantage, however, is the high workload required to repeatedly lift the chambers manually to evacuate the chamber headspace before each measurement of gas flux with the floating chamber, result-ing in few and discontinuous measurement series (Podgra-jsek et al., 2014). Some studies have developed automatic approaches to measure gas fluxes using floating chambers to increase temporal resolution and reduce the workload. Auto-matic systems for measurement of soil gas flux are
commer-cially available (e.g. LI-800A, LI-COR Biosciences, Lincoln, NE, USA) and rely on automatic lifting of the chamber. For use on lakes, Duc et al. (2013) equipped a floating chamber with an inflatable balloon mounted on the chamber side to ventilate the headspace and Spafford and Risk (2018) used the forced diffusion technique which relies on passive equili-bration using membranes (Risk et al., 2011). While these ex-amples solve the mentioned problems, we wished to pursue a simpler and more cost-efficient solution to further expand the use of these methods.
To obtain high temporal resolution of CO2flux
measure-ments from lakes, we modified the chamber described in Bastviken et al. (2015) by adding automatic venting of the chamber headspace using a small air pump, a timer and pas-sive regulation of excess air pressure. After this improve-ment, the floating chamber can be left on the lake surface and provide CO2flux measurements two to three times every
hour over several days without any manual effort. The mod-ifications are simple yet effective and, in addition to high-frequency CO2 gas flux measurements with a minimum of
effort, also permit simultaneous calculations of gas exchange velocity when CO2partial pressure in surface water and
near-surface air is measured or calculated. This study adds to the growing interest and development of automatic gas flux sam-pling techniques by presenting a cost-efficient and simple automatic floating chamber. It was a high priority that the construction remained simple and did not require advanced technical skills and programming. We present the chamber modifications, test of performance and field data from de-ployment.
2 Methods
2.1 Description of the chamber
Construction, performance and use of the floating chamber with the CO2sensor (CO2ELG module, Senseair, Sweden)
ex-terior section of gas-impermeable tubing (2 m). The purpose of this outlet is to enable regulation of excess air pressure to-wards ambient air pressure when the air pump is on. The long tubing ensures that inward gas diffusion during measurement is negligible. Initially, we used a valve to release excess pres-sure when the pump was on. However, this caused build-up of excess pressure influencing CO2 measurements and was
abandoned. See also the Supplement for further information on the chamber design and parts used.
2.2 Testing
We tested how the air pressure within the chamber changed relative to the atmosphere when the air pump was on and ventilated the chamber. Similarly to a regular field deploy-ment, the floating chamber was placed on a water surface, but equipped with two air pressure data loggers (HOBO U20L-04, Onset Computers) placed inside and outside the chamber, which measured the absolute pressure every minute. The test consisted of two parts where the long exterior tubing was either open or closed to compare the effect on floating cham-ber air pressure during ventilation and measurements. This test is important because gas flux measurements may be bi-ased if differences between the ambient and floating chamber headspace pressures occur during flux measurements with the air pump off.
In addition, passive diffusion through the long exterior gas impermeable tubing must be negligible when the air pump is off. To test this assumption, the chamber was fixed to a gas-impermeable glass plate, contacts between chamber edges and glass were sealed with vacuum silicone grease and the chamber then lowered into water to make potential leakage easily detectable. This way, gas could only be exchanged through the chamber walls or the tubing. A small volume (mL) of pure CO2was injected through the connector on the
chamber side using a syringe to increase CO2partial pressure
inside the chamber (approximately 6 times atmospheric con-centration), which was then measured for 2 h with the open ended exterior tubing or with the connector closed off. We used linear regression to assess whether changes in chamber headspace CO2partial pressure occurred with time (testing
the slope versus zero).
2.3 Operation and measurements of CO2gas flux
The floating chamber with automatic venting was deployed on a small (7260 m2) forest lake in Gribskov, Denmark (lat: 55.985817◦N, long: 12.271768◦E) on 13 October 2017. Timer pulse and pause, air pump on and off, were 7 and 30 min, respectively (user defined). Atmospheric CO2partial
pressure was measured 17 cm above the water surface. The CO2 mini-loggers had been calibrated in CO2free air (N2)
following the manufacturer’s guidelines. Measurements were taken every 5 min. The mixing ratio was converted to partial
pressure using the daily ambient pressure recorded close by (DMI, 2017).
The flux of CO2 from the lake was calculated from
changes in chamber CO2partial pressure (linear slope) when
the air pump was off, yielding measurements of gas flux at 37 min intervals. The CO2 flux (F), reported as mmol
CO2m−2h−1, was calculated as (Podgrajsek et al., 2014)
F =dCO2
dt V
RTA, (2)
where the first term is the rate of change of CO2
par-tial pressure over time in the floating chamber, V is the chamber volume (0.008 m3),R is the universal gas constant (m3atm K−1mol−1),T is the ambient temperature (K) and
Ais the chamber area in contact with water (0.075 m2). Gas exchange velocity (k, m h−1) was calculated from Eq. (1) and the normalised gas exchange velocity (k600, m h−1) was
calculated from the ratio of Schmidt numbers (Jähne et al., 1987; Wanninkhof, 1992). Surface water CO2 partial
pres-sure was estimated from pH (pHTemp2000 MadgeTech data logger with an Omega pH electrode), water temperature (HOBO UA-002-64, Onset Computers) and alkalinity (Wey-henmeyer et al., 2012). The pH electrode was calibrated at pH 4 and 7 and subsequently corrected for drift (assumed lin-ear). Alkalinity was measured once at deployment by acidi-metric titration with 0.1 N HCl (Gran, 1952) and held con-stant for calculations, while pH and water temperature were measured every 10 min. Alkalinity was 1.15 meq L−1and the potential bias of estimating waterside CO2 partial pressure
should therefore be low (Abril et al., 2015). Earlier measure-ments in the same system have shown very low variability in alkalinity over sub-daily timescales.
In addition to this approach, surface water CO2 partial
pressure was also estimated from a floating chamber with a mini-logger left to equilibrate in order to compare with the pH-alkalinity method. In this case, we used the maximum value reached after equilibration during the investigated pe-riod. Wind speed was measured 30 cm above the water sur-face (HOBO S-WET-A, Onset Computers) mounted on a steel peg close (< 5 m) to the floating chamber at 10 min inter-vals. All analysis was performed in R (R Core Team, 2017).
3 Results
The addition of simple cost-efficient modifications to gas flux floating chambers allowed us to measure CO2gas flux very
Air pump Timer
Battery
+ -+
-12 V
-+
Atmospheric air intake
Air to chamber
Batt. 9 V CO2 sens.
Exterior box with air-pump
Floating chamber cross section
Air pump Air in
Air out
Floating chamber from above
Air pump
Styrofoam
Air out (open tube) (a)
(b) (c)
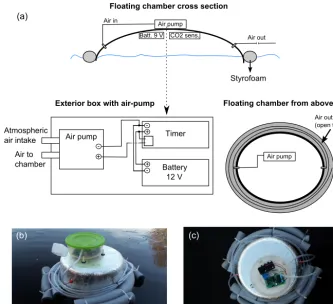
Figure 1. (a)Schematic drawing of the floating chamber with automatic ventilation showing the box, which contains an air pump, a timer and a battery (upper part); cross section (lower left) and view from above (lower right) of the entire floating chamber,(b)picture showing the floating chamber deployed on a lake, and(b)floating chamber viewed from above showing the exterior box containing the air pump and timer.
650 700 750 800 850
0 20 40 60
Time (minutes)
CO
2
(
m
[image:4.612.129.462.71.375.2]atm)
Figure 2.Example illustrating the chamber headspace CO2partial
pressure (yaxis, µatm) during two pause and pulse (grey boxes) cy-cles. Data from a field deployment (22 September) in the described system with a 2 min logging interval.
When the air pump is switched on and actively ventilates the chamber (Fig. 2), internal air pressure rises compared to ambient levels (Fig. 3a). While the increments were rel-atively small, they may likely bias the CO2 concentrations
and the gas flux calculations. For this reason, we added a long exterior tubing which provided passive regulation of in-ternal air pressure (Fig. 3a). The length (2 m) should ensure that excess air pressure could reach ambient levels quickly while minimising the potential CO2exchange during
mea-surements. When testing the chamber on an impermeable surface (Fig. 3b), no changes in chamber headspace CO2
par-tial pressure occurred over 2 h with the exterior tube on or with the connector closed off, confirming that leakage due to this modification is negligible. Performing the same test outdoors with appreciable wind exposure yielded the same result (Fig. S1 in the Supplement). In comparison, measured rates of increase in chamber headspace partial pressure in the field were 25- to 225-fold higher.
The automated floating chamber was deployed on a small lake to test chamber operation. During a daytime period (Fig. 4) and during approximately 2.5 days (Fig. 5), CO2
[image:4.612.48.287.481.636.2]Open Closed (a)
(b) 0.9995 1.0000 1.0005 1.0010 1.0015 1.0020
3120 3150 3180 3210
00 20 40 00 20 40 00
20 40 00 20 40 00 20 40 00 20 40 00 20 Time (minutes)
Air pressure (atm)
CO
2
(
m
atm)
Inside chamber
Outside chamber
Closed
Open
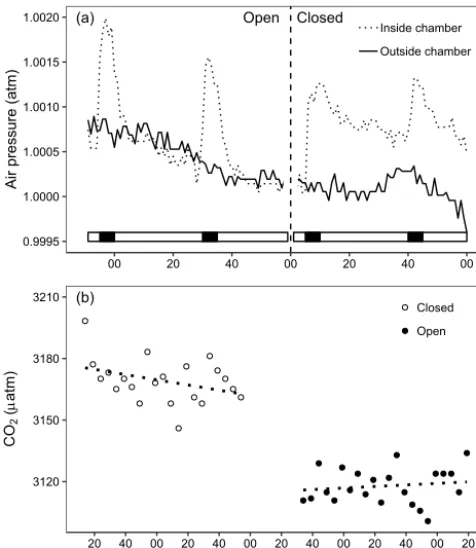
Figure 3. (a)Air pressure measured inside (dotted line) and out-side (solid line) the chamber every minute during air pulse (solid bar) and pause (open bar). Measurements are shown with and with-out the long (vertical dashed line) exterior tubing, which allows for passive regulation of chamber headspace air pressure.(b)Leakage test of the floating chamber showing headspace CO2partial
pres-sure (yaxis, µatm) with the long external tubing for equilibration (open, solid points) and with the connecter closed off (closed, open points). Both regression lines are not significantly different from zero (reported as slope (±SE, µatm min−1),t value, d.f., signifi-cance, open: 0.037 (±0.06), 0.63, 20, n.s. (not significant), closed: −0.127 (±0.08),−1.66, 19, n.s.).
the CO2 flux was positive (degassing) as expected from
the heterotrophic nature of humic forest lakes with CO2
supersaturated surface water. The average outflux was 1.4 (range: 0.7–3.0) mmol CO2m−2h−1. Measurements of
wa-terside CO2 partial pressure from the equilibration
float-ing chamber (4250 µatm) showed relatively good agreement with the pH-alkalinity method (mean (range), 5647 (5416– 5866) µatm, Fig. 4b). We were able to obtain gas flux mea-surements from the system at a temporal resolution and dur-ing periods, which, previously, were impossible with other methods or would require a high workload. Sub-daily pat-terns were evident in both the atmospheric CO2partial
pres-sure and gas flux, which are likely linked to meteorologi-cal variables (Fig. 5). Changes in CO2 gas flux followed
patterns in gas exchange velocity (k), while the gradient in air–water CO2 partial pressure was less variable. The
nor-malised gas exchange velocity (k600, mean (range), 0.095
(0.006–0.014) m h−1) was significantly positively correlated with mean wind speed during the measuring interval in Fig. 4 (Spearman’s rank,n=19,ρ=0.64 andp< 0.01).
4 Discussion
We have presented a cost-efficient and easy-to-implement floating chamber to measure lake CO2 gas flux at a high
frequency. The construction of floating chambers with au-tomatic venting mechanisms may be more or less advanced and require different levels of technical skills (Duc et al., 2013). An advantage of the chamber presented in this study is the simple construction, low price and easy deployment. The potentially broad-scale application of floating chambers could greatly improve our understanding of global-scale lake gas fluxes (Tranvik et al., 2009; Raymond et al., 2013). Fur-thermore, the study of lake carbon balances or whole-system metabolism could be improved by including integrated mea-surements of CO2gas flux (Staehr et al., 2010).
Lake gas flux can be measured by different methods vary-ing in equipment costs and required labour (Cole et al., 2010). However, the CO2mini-loggers have made
measure-ments of CO2 partial pressure in air straightforward and
paved the road for non-commercial innovations, enabling sci-entists to improve current measurement methods (Bastviken et al., 2015). The low equipment costs would also promote deployment of several chamber units concurrently to explore spatial and temporal variations within and between sites (Natchimuthu et al., 2017). The lightweight design makes measurements possible even in remote locations.
Frequent and direct measurements of CO2flux are highly
preferable compared to indirect methods where CO2flux is
estimated as the gas exchange velocity times the CO2
gradi-ent across the air–water interface (Eq. 1). By simultaneously measuring CO2 gas flux and waterside CO2 partial
pres-sure through permanently floating chambers with a small air headspace in equilibrium with surface waters, the gas trans-fer velocity can also be determined (Eq. 1, Fig. 4d). The CO2
gradient is usually estimated solely from CO2 partial
pres-sure in surface waters assuming a constant CO2partial
pres-sure in the near-surface air phase similar to that in the open atmosphere. This assumption may be incorrect, particularly at low wind speeds above CO2-rich ponds as shown here
(Fig. 4a) and above small sheltered streams (Sand-Jensen and Staehr, 2012). Using the same mini-loggers, CO2
par-tial pressure can be measured just above the water surface, improving quantification of the gas transfer velocity. On the other hand, waterside CO2 partial pressure may be so high
under these circumstances that the assumption of standard atmospheric partial pressures of CO2does not lead to major
errors in flux calculations.
[image:5.612.49.287.69.343.2](a) (b) (c) (d) 500 600 700 4500 5000 5500 6000 700 800 900 1000 1100 0.5 1.0 1.5 2.0 2.5 3.0 0.005 0.010 0.015 0.020 0.025
09:00 11:00 13:00 15:00 17:00 19:00
Time of day
CO 2 ( m atm) CO 2 ( m atm) CO 2 ( m atm) CO 2
flux (mmol m
-2h -1) k CO2 (m h -1 )
CO2flux
kCO2 (a) (b) (c) (d) 500 600 700 4500 5000 5500 6000 700 800 900 1000 1100 0.5 1.0 1.5 2.0 2.5 3.0 0.005 0.010 0.015 0.020 0.025
09:00 11:00 13:00 15:00 17:00 19:00
Time of day
CO 2 ( m atm) CO 2 ( m atm) CO 2 ( m atm) CO 2
flux (mmol m
-2h -1) k CO2 (m h -1 )
CO2flux
[image:6.612.144.453.66.402.2]kCO2
Figure 4.Data from field deployment (14 October) showing(a)atmospheric CO2partial pressure (µatm) measured 17 cm above the water surface,(b)waterside CO2partial pressure (µatm) estimated from pH, water temperature and alkalinity (open points) fitted with a LOESS
smoother and inferred from a floating chamber left to equilibrate with surface water (solid point),(c)headspace CO2partial pressure (µatm) in
the automated floating chamber where the grey boxes show periods of ventilation between gas flux measurements, and(d)the calculated CO2
gas flux (mmol m−2h−1) and gas exchange velocity (k, m h−1). The small abrupt changes in estimated waterside CO2partial pressure(b)are
not real, but are caused by minute pH changes of 0.01 unit (i.e. the resolution of pH measurements).
water CO2 partial pressure are suspected (Natchimuthu et
al., 2017). A floating chamber thus provides a contrast to en-tire system approaches like eddy covariance methods, which measure the integrated gas flux from a larger and temporally changing measurement footprint (Jammet et al., 2017). In the numerous small lakes with a disproportionately large contri-bution to greenhouse gas flux from inland waters (Holgerson and Raymond, 2016), the presented floating chambers may be particularly suitable because other methods may be diffi-cult or impossible to apply (e.g. eddy covariance).
The presented chamber showed good field performance and yielded lake CO2gas fluxes (Fig. 5c) within the range
of previously published values (Holgerson and Raymond, 2016; Torgersen and Branco, 2008; Natchimuthu et al., 2017) and similar to values found in the same system using or-dinary floating chambers (not shown). The calculated gas transfer velocity was low compared to larger lakes (Holger-son et al., 2017) but similar to measures in other small lakes
(< 0.01 km2) using whole-lake tracer additions of propane (Holgerson et al., 2017),3He and SF6 (Clark et al., 1995),
floating chambers connected to an IRGA (Kragh et al., 2017) and floating chambers and CH4measurements (Cole et al.,
2010).
Because the ventilation of the chamber headspace occurs through dilution with atmospheric air (Fig. 2), CO2
concen-trations do not always reach the ambient atmospheric values (Fig. 4a, b). This situation can be changed by altering the du-ration of the air pump pulse and pause, which can be quickly modified by the user, depending on the gas flux (magnitude and direction) and gas exchange velocity of the system. In our application, the large gradient in air–water CO2 partial
pressure meant that it was not critical that CO2partial
pres-sure in the chamber after venting precisely reached the partial pressure in ambient air. The CO2partial pressure in the
(a)
(b)
(c)
600 700 800 900 1000 1100
0 2 4 6
1 2 3
13 Oct 20:00 14 Oct 08:00 14 Oct 20:00 15 Oct 08:00 15 Oct 20:00
Date and time
CO
2
(
m
atm)
Wind speed (m s
-1 )
CO
2
flux (mmol m
-2 h
-1 )
Wind gust
Wind speed
(a)
(b)
(c)
600 700 800 900 1000 1100
0 2 4 6
1 2 3
13 Oct 20:00 14 Oct 08:00 14 Oct 20:00 15 Oct 08:00 15 Oct 20:00
Date and time
CO
2
(
m
atm)
Wind speed (m s
-1 )
CO
2
flux (mmol m
-2 h
-1 )
Wind gust
[image:7.612.117.481.69.382.2]Wind speed
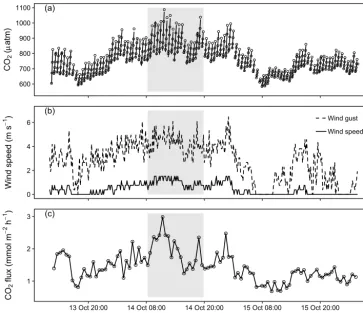
Figure 5.Data from field deployment (13–15 October) including the time period depicted in Fig. 3 (grey box).(a)The headspace CO2
partial pressure (µatm) in the automated floating chamber during flux measurement when the air pump is off (open points) fitted with a linear regression (solid lines),(b)the wind speed (solid line, m s−1) and wind gust (dashed line, m s−1) measured 30 cm above the water surface and(c)the calculated CO2gas flux (mmol m−2h−1).
ensuring a correct rate determination not corrupted by the rising CO2partial pressure.
Depending on the available power and study system, choosing an appropriate duration of the air pump pulse is critical and should be tuned depending on the expected char-acteristics of the system (CO2partial pressure, CO2flux and
gas exchange velocity). At the extreme end, in systems with very high gas exchange velocities the presented solution may not be suitable if CO2is released from the water to the
cham-ber headspace almost as fast as CO2is pumped out. It is
de-sirable to reach or approach background levels of CO2
par-tial pressure in the atmosphere during an air pump pulse. One consequence of too short an air pump pulse duration is that the elevated chamber headspace CO2partial pressure
intro-duces a carry-over effect, potentially biasing repeated mea-surements. The solution is to increase the rate or duration of the air pump pulse. If increasing the power consumption of the air pump results in too short a deployment duration, an alternative stronger power source can be used. As an exam-ple of power consumption in the presented field deployment with a 30 min pause and 7 min pulse (air pump
consump-tion of∼1.5 W or 125 ma (milli-ampere)) or approximately 39 cycles per day, the expected duration of deployment is 3.5 days with the batteries used here (∼2000 mah (milli-ampere hours)). Increasing the duration of the air pump pulse to 10 or 12 min in order to come closer to background levels of CO2partial pressure would result in an expected
deploy-ment of 2.6 and 2.3 days, respectively. This would still permit 93 or 79 consecutive flux measurements over more than two diel cycles. As the above-mentioned system characteristics vary in both time and space, the data should be quality as-sured and gas flux calculated from measurements in the lin-ear range as the chamber headspace’s CO2 partial pressure
approaches the waterside CO2partial pressure.
between measurement time and longer-term stability of the floating chamber on the water surface. In this case, equilibra-tion of the chamber headspace took several hours due to the low gas exchange velocity, and chamber dimension changes would have been necessary had the measurements of water-side CO2partial pressure relied on this method only. In this
setting, the waterside CO2 partial pressure calculated from
pH and alkalinity likely gives a better picture of the actual levels at a given time point compared to the floating cham-ber where the signal is integrated over a long time period. Furthermore, the slight difference between the two methods could also be a result of spatial variability likely promoted by low rates of mixing and relatively high rates of CO2
pro-duction.
To contain the air pump, battery and timer, we have used a small exterior box placed on the floating chamber. The ob-jective was to minimise the weight of the box, which allows the floating chamber to move freely and reduce the surface disturbance on natural flow regimes. In the test deployment (Figs. 4 and 5) we used a battery package containing eight 1.5 V AA batteries, which is sufficient for 3 to 4 days of op-eration. This time frame is determined by the air-pulse dura-tion, but may also be affected by ambient temperatures. Ob-taining continuous time series of CO2gas flux presents a
sig-nificant improvement compared to existing floating chamber measurements which are often limited to daytime and good weather conditions. Using a larger external battery wired to the floating chamber would remove potential power limita-tions on the duration of the deployment without compromis-ing the temporal resolution.
To improve current knowledge of lake CO2gas flux,
con-tinuous measurement series are required in order to exam-ine system- to global-scale drivers. We have presented sim-ple modifications to automate measurements of CO2gas flux
from floating chambers on lakes based on existing methods. Using this system, we have reduced the workload required to obtain continuous measurement series considerably. A sim-ple and cost-efficient design favours the wide application of the presented floating chamber.
Data availability. Data are available upon request to the corre-sponding author.
Supplement. The supplement related to this article is available online at: https://doi.org/10.5194/bg-15-5565-2018-supplement.
Author contributions. KTM, TK and KSJ conceived the idea and built the chamber. KTM performed the tests and collected the field data under the guidance of TK and KSJ. KTM wrote the manuscript with contributions from TK and KSJ.
Competing interests. The authors declare that they have no conflict of interest.
Acknowledgements. This work was supported by grants to Kaj Sand-Jensen from COWI fonden for the study of carbon dioxide exchange on small lakes, and Carlsberg fondet for the study of small lakes. We are indebted to David Bastviken for many constructive comments to improve the manuscript during the careful review procedure.
Edited by: Helge Niemann
Reviewed by: David Bastviken and Helge Niemann
References
Abril, G., Bouillon, S., Darchambeau, F., Teodoru, C. R., Mar-wick, T. R., Tamooh, F., Ochieng Omengo, F., Geeraert, N., Deir-mendjian, L., Polsenaere, P., and Borges, A. V.: Technical Note: Large overestimation ofpCO2calculated from pH and alkalinity
in acidic, organic-rich freshwaters, Biogeosciences, 12, 67–78, https://doi.org/10.5194/bg-12-67-2015, 2015.
Andersen, M. R., Kragh, T., and Sand-Jensen, K.: Extreme diel oxy-gen and carbon cycles in shallow vegetated lakes, P. R. Soc. B, 284, 20171427, https://doi.org/10.1098/rspb.2017.1427, 2017. Bastviken, D., Tranvik, L. J., Downing, J. A., Crill, P. M., and
Enrich-Prast, A.: Freshwater methane emissions offset the conti-nental carbon sink, Science, 331, 50–50, 2011.
Bastviken, D., Sundgren, I., Natchimuthu, S., Reyier, H., and Gål-falk, M.: Technical Note: Cost-efficient approaches to measure carbon dioxide (CO2) fluxes and concentrations in terrestrial and
aquatic environments using mini loggers, Biogeosciences, 12, 3849–3859, https://doi.org/10.5194/bg-12-3849-2015, 2015. Clark, J. F., Schlosser, P., Wanninkhof, R., Simpson, H. J., Schuster,
W. S., and Ho, D. T.: Gas transfer velocities for SF6 and3He in a small pond at low wind speeds, Geophys. Res. Lett., 22, 93–96, 1995.
Cole, J. J. and Caraco, N. F.: Atmospheric exchange of carbon dioxide in a low-wind oligotrophic lake measured by the addition of SF6, Limnol. Oceanogr., 43, 647–656, https://doi.org/10.4319/lo.1998.43.4.0647, 1998.
Cole, J. J., Bade, D. L., Bastviken, D., Pace, M. L., and Van de Bogert, M.: Multiple approaches to estimating air-water gas ex-change in small lakes, Limnol. Oceanogr.-Meth., 8, 285–293, https://doi.org/10.4319/lom.2010.8.285, 2010.
Crusius, J. and Wanninkhof, R.: Gas transfer velocities measured at low wind speed over a lake, Limnol. Oceanogr., 48, 1010–1017, 2003.
DMI (Danish Meterological Institute): http://www.dmi.dk/vejr/ arkiver/vejrarkiv/, last access: 1 December 2017.
Duarte, C. M. and Prairie, Y. T.: Prevalence of heterotrophy and at-mospheric CO2emissions from aquatic ecosystems, Ecosystems,
8, 862–870, 2005.
Gran, G.: Determination of the equivalence point in po-tentiometric titrations, Part II, Analyst, 77, 661–671, https://doi.org/10.1039/an9527700661, 1952.
Holgerson, M. A. and Raymond, P. A.: Large contribution to in-land water CO2and CH4emissions from very small ponds, Nat.
Geosci., 9, 222–226, https://doi.org/10.1038/ngeo2654, 2016. Holgerson, M. A., Zappa, C. J., and Raymond, P. A.:
Sub-stantial overnight reaeration by convective cooling discovered in pond ecosystems, Geophys. Res. Lett., 43, 8044–8051, https://doi.org/10.1002/2016gl070206, 2016.
Holgerson, M. A., Farr, E. R., and Raymond, P. A.: Gas transfer ve-locities in small forested ponds, J. Geophys. Res.-Biogeo., 122, 1011–1021, https://doi.org/10.1002/2016JG003734, 2017. Jammet, M., Dengel, S., Kettner, E., Parmentier, F. J. W., Wik, M.,
Crill, P., and Friborg, T.: Year-round CH4and CO2flux
dynam-ics in two contrasting freshwater ecosystems of the subarctic, Biogeosciences, 14, 5189–5216, https://doi.org/10.5194/bg-14-5189-2017, 2017.
Jähne, B., Münnich, K. O., Bösinger, R., Dutzi, A., Huber, W., and Libner, P.: On the parameters influencing air-water gas exchange, J. Geophys. Res.-Ocean., 92, 1937–1949, 1987.
Kragh, T., Andersen, M. R., and Sand-Jensen, K.: Profound af-ternoon depression of ecosystem production and nighttime de-cline of respiration in a macrophyte-rich, shallow lake, Oecolo-gia, 185, 157–170, https://doi.org/10.1007/s00442-017-3931-3, 2017.
MacIntyre, S., Wanninkhof, R., and Chanton, J.: Trace gas exchange across the air-water interface in freshwater and coastal marine en-vironments, in: Biogenic trace gases: Measuring emissions from soil and water, edited by: Matson, P. A. and Harris, R. C., Black-well, 1995.
Natchimuthu, S., Sundgren, I., Gålfalk, M., Klemedtsson, L., and Bastviken, D.: Spatiotemporal variability of lakepCO2and CO2
fluxes in a hemiboreal catchment, J. Geophys. Res.-Biogeo., 122, 30–49, https://doi.org/10.1002/2016JG003449, 2017.
Podgrajsek, E., Sahlée, E., Bastviken, D., Holst, J., Lin-droth, A., Tranvik, L., and Rutgersson, A.: Comparison of floating chamber and eddy covariance measurements of lake greenhouse gas fluxes, Biogeosciences, 11, 4225–4233, https://doi.org/10.5194/bg-11-4225-2014, 2014.
Podgrajsek, E., Sahlée, E., and Rutgersson, A.: Diel cycle of lake-air CO2flux from a shallow lake and the impact of waterside
con-vection on the transfer velocity, J. Geophys. Res.-Biogeo., 120, 29–38, 2015.
R Core Team: R: A language and environment for statistical com-puting, R Foundation for Statistical Comcom-puting, Vienna, Austria, https://www.R-project.org/, 2017.
Raymond, P. A., Hartmann, J., Lauerwald, R., Sobek, S., Mc-Donald, C., Hoover, M., Butman, D., Striegl, R., Mayorga, E., Humborg, C., Kortelainen, P., Durr, H., Meybeck, M., Ciais, P., and Guth, P.: Global carbon dioxide emissions from inland wa-ters, Nature, 503, 355–359, https://doi.org/10.1038/nature12760, 2013.
Read, J. S., Hamilton, D. P., Desai, A. R., Rose, K. C., MacIn-tyre, S., Lenters, J. D., Smyth, R. L., Hanson, P. C., Cole, J. J., and Staehr, P. A.: Lake-size dependency of wind shear and con-vection as controls on gas exchange, Geophys. Res. Lett., 39, L09405, https://doi.org/10.1029/2012gl051886, 2012.
Risk, D., Nickerson, N., Creelman, C., McArthur, G., and Owens, J.: Forced Diffusion soil flux: A new technique for continuous monitoring of soil gas efflux, Agr. Forest Meteorol., 151, 1622– 1631, https://doi.org/10.1016/j.agrformet.2011.06.020, 2011. Sand-Jensen, K. and Staehr, P. A.: CO2dynamics along Danish
low-land streams: water–air gradients, piston velocities and evasion rates, Biogeochemistry, 111, 615–628, 2012.
Spafford, L. and Risk, D.: Spatiotemporal Variability in Lake-Atmosphere Net CO2 Exchange in the Littoral Zone of an
Oligotrophic Lake, J. Geophys. Res.-Biogeo., 123, 1260–1276, https://doi.org/10.1002/2017JG004115, 2018.
Staehr, P. A., Bade, D., Van de Bogert, M. C., Koch, G. R., Williamson, C., Hanson, P., Cole, J. J., and Kratz, T.: Lake metabolism and the diel oxygen technique: state of the science, Limnol. Oceanogr. Methods, 8, 628–644, 2010.
Torgersen, T. and Branco, B.: Carbon and oxygen fluxes from a small pond to the atmosphere: Temporal variability and the CO2/O2 imbalance, Water Resour. Res., 44, W02417,
https://doi.org/10.1029/2006WR005634, 2008.
Tranvik, L. J., Downing, J. A., Cotner, J. B., Loiselle, S. A., Striegl, R. G., Ballatore, T. J., Dillon, P., Finlay, K., Fortino, K., Knoll, L. B., Kortelainen, P. L., Kutser, T., Larsen, S., Laurion, I., Leech, D. M., McCallister, S. L., McKnight, D. M., Melack, J. M., Overholt, E., Porter, J. A., Prairie, Y., Renwick, W. H., Roland, F., Sherman, B. S., Schindler, D. W., Sobek, S., Trem-blay, A., Vanni, M. J., Verschoor, A. M., von Wachenfeldt, E., and Weyhenmeyer, G. A.: Lakes and reservoirs as regulators of carbon cycling and climate, Limnol. Oceanogr., 54, 2298–2314, https://doi.org/10.4319/lo.2009.54.6_part_2.2298, 2009. Vachon, D. and Prairie, Y. T.: The ecosystem size and shape
dependence of gas transfer velocity versus wind speed rela-tionships in lakes, Can. J. Fish. Aquat. Sci., 70, 1757–1764, https://doi.org/10.1139/cjfas-2013-0241, 2013.
Wanninkhof, R.: Relationship between wind speed and gas ex-change over the ocean, J. Geophys. Res.-Ocean., 97, 7373–7382, https://doi.org/10.1029/92jc00188, 1992.
Weyhenmeyer, G. A., Kortelainen, P., Sobek, S., Müller, R., and Rantakari, M.: Carbon dioxide in boreal surface waters: a com-parison of lakes and streams, Ecosystems, 15, 1295–1307, 2012. Wik, M., Varner, R. K., Anthony, K. W., MacIntyre, S., and Bastviken, D.: Climate-sensitive northern lakes and ponds are critical components of methane release, Nat. Geosci., 9, 99–105, 2016.