Abstract: Collaborating big data and machine learning approaches in healthcare can help in improving clinical decision making and treatment by identifying and accumulating accurate features. Prenatal hypoxia can also be identified by cardiotocography (CTG) monitoring that helps in identifying the condition of the fetus. Imposing the data over distributed approaches can help in fast computation to rate the fetal and mother wellbeing before delivery. Our research aims to propose and implement a scalable Machine learning Algorithm based perinatal Hypoxia diagnostic system for larger datasets. This system was implemented on the CTG dataset using python and pyspark models like SVM, Random Forest, and Logistic regression. In the proposed method experiment results contributing to spark RF are more accurate than other techniques and achieved the precision of 0.97, recall of 0.99, f-1 score of 0. 98, AUC of 0.97 and gained 97% accuracy.
Keywords- Prenatal hypoxia, CTG, pyspark, fetal state, and machine learning techniques.
I. INTRODUCTION
Perinatal Hypoxia is a disease in neonates caused by an inadequate supply of oxygen. Since the brain of the neonate is very delicate, it can easily influence by the supply of oxygen, the discomfort caused by lack of oxygen may lead to inconceivable cases [1][2]. The spectrum ranges from non-life-threatening to life-threatening during pregnancy and delivery. Hypoxia identification during labor becomes the goal to diminish the chance of permanent damage [3]. Thus, a scalable and effective system is required to analyze perinatal hypoxia that should be real-time and robust, and assists gynaecologist to take an appropriate decision promptly for future complications [1][2][20]. Efforts have been made to develop a computer system for analyzing the fetal state from features in CTG record.
Intrapartum continuous monitoring of neonate becomes most important so that obstetricians can monitor the fetal heart rate concerning uterine contractions which in return will help in controlling the morbidity and mortality both in mother and newborn [3][20]. Figure 1 shows typical CTG recordings
Revised Manuscript Received on October 05, 2019.
Harmandeep Kaur, CSE, CT Institute of Engineering Management and
Technology, Jalandhar, India. Email: [email protected]
Vikas Khullar, CSE, CT Institute of Engineering Management and
Technology, Jalandhar, India. Email: [email protected]
Harjit Pal Singh, ECE, CT Institute of Engineering Management and
Technology, Jalandhar, India. Email: [email protected]
Manju Bala, CSE, Khalsa College of Engineering and Technology,
Amritsar, India. Email: [email protected]
[image:1.595.304.558.320.459.2](FHR signals [4] and UC signals [6]). Simultaneous recording of mother's uterine contraction and fetal heart rate (FHR) is known as cardiotocography (CTG), the machine traces the recordings on a paper is called Cardiotocograph, most commonly known as electronic fetal monitoring (EFM). CTG can be internal and external. Internal CTG uses a scalp electrode, attached directly to the baby's head through cervical opening or by a ruptured amniotic sac. External CTG uses two transducers; Doppler’s ultrasound transducer; that monitors the fetus heart rate and pressure transducer; monitors contractions, placed on the mother's abdomen, this can also be in the form of belt to restrict motility. [5]
Figure 1: CTG and UC signals [4][6]
CTG data analysis through Machine learning approaches helps in early-stage preventions, saving lives of mother and fetus, neonate's severe or minor damage and save diagnostic time for obstetricians as CTG data holds antenatal information like UC and fetus movements inside mother's abdomen so that obstetricians or gynecologists can make use of this information[16]. Cesarelli et al. (2009) in his research does the classification of fetal hypoxia based on the patient's past and present medical history through CTG data analysis and also stated that feature extraction is challenging task to separate it from other common fetal risks during pregnancy [11].
Heart of the baby begins to form and beat within the first trimester of pregnancy and as per Grivell et al. (2012) CTG monitoring is applicable for fetus only after 7 months of pregnancy [15]. Gribbin and Thornton (2006) says that normal or accepted baseline fetal heart rate ranges from 110-160 beats per minute (bpm) and variance between 5 and 25. Factors such as an increase in variability of more than 25 bpm known as marked variability, and tachycardia can be associated with fetal hypoxia. [12][13]. According to Ma and Zhang (2015) maternal smoking, anemia, birth asphyxia, inadequate fetal monitoring, deficit placenta, and high altitude pregnancy can be other sources of fetal hypoxia [14]. Big data in healthcare may have
taken a slower start but today we
Perinatal Hypoxia Diagnostic System by using
Scalable Machine Learning Algorithms
have many sophisticated sensors connected to the body and present in wearable like clothes, watches etc. that provides continuous monitoring of heart, blood pressure, exercises, steps counting and many more. Machine learning is a technique that learns for themself so combining these technologies provides a vibrant system that has gain the potential success and is easy to access.[18][21]
II. METHODOLOGYANDMODELS
A. Description of data
[image:2.595.330.523.50.168.2]Data used is taken from the UCI Machine Learning Repository, which was derived from a study at the University of Porto. 2126 fetal records were automatically processed and classification was based on morphological patterns as well as on a fetal state [22][23]. By SisPorto2.0, 21 diagnostic features were measured [7] and in the proposed approach out of 1950 sample, 1655 were classified as normal and 295 as suspect fetal state. 21 features are illustrated in table 1. We implemented various machine learning algorithms on big data platform to analyze perinatal hypoxia (Figure 3).
Table 1 shows a description of 21 input features
Sr. no. Features Description
1 LB FHR baseline (beats per minute) 2 AC Acceleration per second 3 FM Fetal movement per second 4 UC Uterine contractions per second 5 DL Light decelerations per second 6 DS Severe decelerations per second 7 DP Prolonged decelerations per second
8 ASTV Percentage of time with abnormal short term variability
9 MSTV Mean value of short term variability
10 ALTV Percentage of time with abnormal long term variability
11 MLTV Mean value of long term variability 12 Width Width of FHR histogram 13 Min Minimum of FHR histogram 14 Max Maximum of FHR histogram 15 Nmax # of histogram peaks 16 Nzero # of histogram zeros 17 Mode Histogram mode 18 Mean Histogram mean 19 Median Histogram median 20 Variance Histogram variance 21 Tendency Histogram tendency
B. Algorithms
Machine learning (ML) is an application of Artificial Intelligence (AI) that makes the computer systems to learn themselves on the basis of patterns and assumptions by using the study of algorithms and statistical models. Machine learning can be supervised, unsupervised and reinforcement type. In traditional programming data and algorithm decides the output whereas in Machine Learning output defines the algorithm to be implemented on the given data. [8][10][19]
Figure 2: Outline of Machine Learning [8] 1. Linear Regression
Linear regression model is a supervised learning technique used to find out the linear relationship between the dependent variable and series of changing independent variables and hence, the name is Linear Regression [19]. The main objective is to predict the Best Fit Line (straight line passes through the centroid of data points), so that the vertical distance between each of the independent variable point from the line should be minimal [8].
Hypothesis Function for linear regression: Y=B0 + B1 * X (1)
Where,
Y= prediction/output / dependent variable B0 = intercept
B1 = slope or coefficient of x X = input / independent variable
2. Logistic Regression
This supervised learning algorithm is used for classification problems and predicts the probability between 0 and 1 of the target class. This becomes possible by using a nonlinear function (also called logistic function or sigmoid function) that converts the form of output from continuous to probability [19]. In this model, the output or target values can take only distinct values for given input values (or features) and builds the regression model to predict probability [9]. Logistic regression models the data by sigmoid function:
g(z) = 1/(1 + e-z) (2) By (1):
g(z) = 1/(1 + e-(B0 + B1 * X ) (3)
The output curve formed is called Logistic Curve and usually an S-shaped.
3. Support Vector Machine(SVM)
SVM is a supervised learning technique used for classification and regression problems. It discriminates the data by a hyperplane that fairly separates two classes. Along with the linear classification, SVM can also perform non-linear classification by mapping the input to n-dimensional space where coordinates represent the value of n (number of features) [10][24].
4. Random Forest(RF)
This algorithm can also be used for classification and regression problems. Decision trees are the fundamental building blocks of random forest algorithm. Random forest classifier algorithm uses multiple decision trees that work independently. An individual
[image:2.595.42.299.322.589.2]5. K-fold Cross-Validation
Cross-validation is a statistical technique used to estimate the accuracy of a predictive model; the one where the goal is a prediction. Usually, data in a prediction problem is divided into training data, that is used to fit the model and testing or validation data, used to determine the performance of the model. Cross-validation is used to evaluate machine learning models over limited dataset.
In k-fold cross-validation, data is divided into k equal parts and relevant iterations are performed over one part as testing set and other k-1 as training set. Lastly, performance metrics are analyzed to determine accuracy, roc, sensitivity and other useful metric. [17][25]
6. Software Tools
There are various tools and systems available to predict the fetal state. Here, we used the open-source cluster-computing "PySpark Programming” framework for this paper. PySpark is the combination of Apache Spark and Python. It is a world-wide popular software that is easy to use, fast, general-purpose and also uses high-level programming language (Python). PySpark is majorly used for machine learning and real-time streaming analytics and also provides a variety of built-in libraries. Python provides simplicity whereas Apache Spark has the power to tame Big Data.
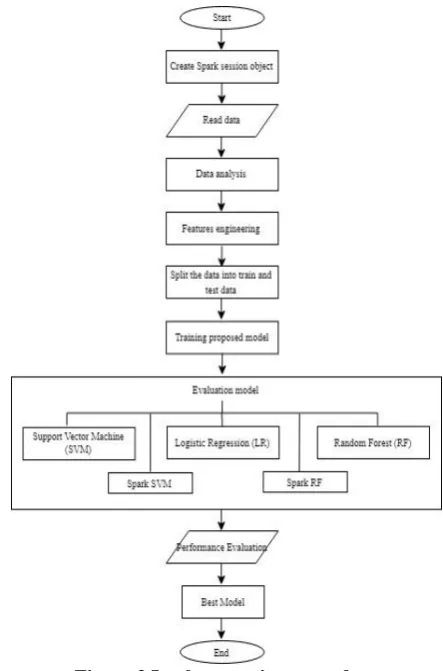
C. Procedure
Figure 3 Implementation procedure
a)Create a spark session object: session is a temporary interaction between two or more communicating devices or entities. Spark session is an entry point to provide a way
of interaction with various spark functionality and make it easy to program with Data frames and Dataset.
b)Read data: dataset is then read and load within the spark using data frames. Dataset need to be placed within the same directory or correct path of location need to be mentioned.
c)Data analysis: This is the process of evaluating the data to discover useful information. This deeper inspection of the dataset is drilled, starting with validating the shape and to end by finding the correlation between input and output variables.
d)Feature engineering: in this part, we combined all the input features to a single vector by using VectorAssembler. It created a single feature that captures all the inputs of a row. Instead of multiple input columns, it merges all the input columns to a single vector column. e)Split the data into train and test data: data is then split into training and testing data to train and evaluate the performance of the applied algorithm respectively. We split the data into 4 ratios 60/40, 70/30, 80/20 and 90/10 in which the first part shows the ratio of training data and rest is testing data.
f)Training models: here, we build and train various models using 21 input features described in data along with the output feature named features and labels respectively. g)Evaluating models: the final part of any exercise is to
check the performance. In this part, performance is evaluated by checking accuracy, execution time, mean squared error, area under ROC curve and various other parameters.
D. Performance Evaluation
[image:3.595.55.277.390.726.2]Evaluation of a model can be measured by various parameters but accuracy is the most obvious one. To completely understand the performance, a confusion matrix is generated that contains actual and predicted values. [26]
Table 2 Confusion Matrix
Actual/Prediction Predicted
(true) Predicted (false)
Actual (true) True Positive False Negative
Actual (false) False Positive True Negative
Various other criteria for evaluating the parameters are mentioned below:
1.Accuracy: score shows how correct or precise a model is. Accuracy = (TP+TN) / (TP+TN+FP+FN)
2.F-1 Score: harmonic mean between precision and recall. F1 is the best value at 1 and worst at 0.
F1score=2 * ((precision*recall) / precision+recall)) 3.Precision: is the fact of being accurate that is when the model predicted true and how often it is correct.
Precision = TP / (TP+FP)
4.Recall: when the results are actually true and how often it predicts true.
Recall = TP / (TP+FN)
6.Execution Time: how much time the system spent executing the model or the task.
III. EXPERIMENTALRESULTS
The accuracy score for SVM was 91% based on restricted data set with 1950 records and 2 output classes to predict fetal state. Using a simple machine learning algorithm on a big data platform performs better. The accuracy for spark SVM came as 91% similarly for random forest 96% of accuracy was measures whereas spark SVM and RF gave 93 and 97% respectively, as the total accuracy. Other parameters of the metrics such as f1 score, precision, recall, AUC also gave slightly different results when compared with spark algorithms. Results are mentioned in table 3.
Table 2 Results for proposed methods Accuracy
(in %) Precision Recall F-1
Score AUC
SVM 91 0.91 0.97 0.95 0.71
RF 96 0.96 0.96 0.97 0.97
SPARK
LR 93 0.96 0.97 0.96 0.97
SPARK
SVM 93 0.96 0.97 0.96 0.96
SPARK
RF 97 0.97 0.99 0.98 0.97
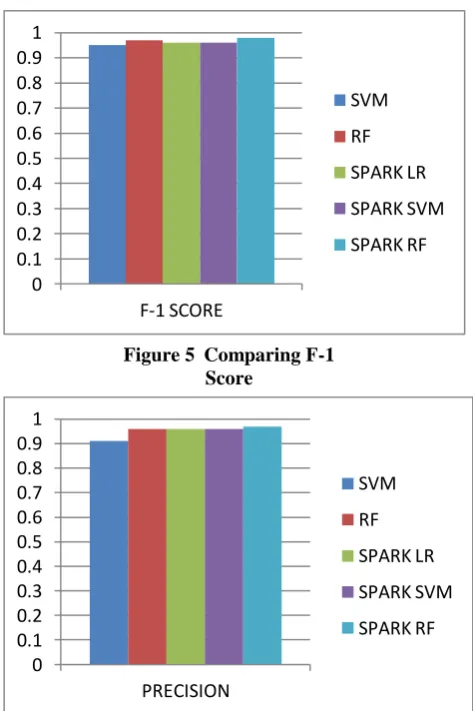
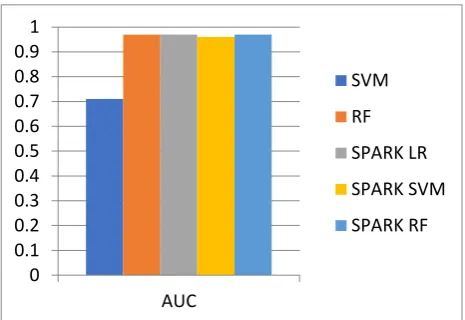
Each bar graph predicts the difference among various parameters and compares with one another. Accuracy chart shows the highest accuracy of Spark RF among others as 97%, Spark LR and Spark SVM gave same accuracy measure as 93% whereas 91 and 96% is gained by SVM and Random Forest respectively. F-1 score for every proposed model seems to have approximately equal measure. Precision for Spark RF shows difference of 0.01 units among other models. Bar of Recall for Spark RF counted as 0.99 whereas, other algorithm has approximately equal count. AUC for each model seems to have nearly same calculations except SVM (0.71).
80 82 84 86 88 90 92 94 96 98 100
ACCURACY
SVM
RF
SPARK LR
SPARK SVM
SPARK RF
Figure 4 Comparison of Accuracy
0 0.1 0.2 0.3 0.4 0.5 0.6 0.7 0.8 0.9 1
F-1 SCORE
SVM
RF
SPARK LR
SPARK SVM
SPARK RF
Figure 5 Comparing F-1 Score
0 0.1 0.2 0.3 0.4 0.5 0.6 0.7 0.8 0.9 1
PRECISION
SVM
RF
SPARK LR
SPARK SVM
SPARK RF
Figure 6 Comparison of Precision
[image:4.595.307.544.61.417.2] [image:4.595.50.290.511.649.2]0 0.1 0.2 0.3 0.4 0.5 0.6 0.7 0.8 0.9 1 AUC SVM RF SPARK LR SPARK SVM SPARK RF
Figure 8 Comparison of Area under Curve
IV. CONCLUSION
The right inference of CTG records can help in the early-stage prediction of fetal condition. This study aimed to imitate a solution using big data with various machine learning algorithms like SVM, RF. Simple SVM and RF are compared with Sparks' which makes machine learning algorithm to be easily scalable. Using the K-fold technique, the accuracy index was determined; the proposed, Spark RF, shows higher accuracy (97%) among other studies. Not only accuracy, precision (0.97), recall (0.99), AUC (0.98) also shows a slight difference. Hence, our system is capable to work effectively over a scalable dataset.
In the future, more big data computations, other machine learning algorithms such as unsupervised and reinforced algorithms can be enacted. Also, work can be shifted over deep learning models.
REFERENCES
1. Oscar Barquero-Pérez et al., “Fetal heart rate analysis for automatic detection of perinatal hypoxia using normalized compression distance and machine learning,” Front. Physiol., vol. 8, no. FEB, 2017.W.-K. Chen, Linear Networks and Systems (Book style). Belmont, CA: Wadsworth, 1993, pp. 123–135.
2. M. S. Iraji, “Prediction of fetal state from the cardiotocogram recordings using neural network models,” Artif. Intell. Med., vol. 96, pp. 33–44, 2019.B. Smith, “An approach to graphs of linear forms (Unpublished work style),” unpublished.
3. M. J. Stout and A. G. Cahill, “Electronic Fetal Monitoring: Past, Present, and Future,” Clin. Perinatol., vol. 38, no. 1, pp. 127–142, 2011. 4. M. G. Signorini, G. Magenes, S. Cerutti, and D. Arduini, “Linear and
nonlinear parameters for the analysis of fetal heart rate signal from cardiotocographic recordings,” IEEE Trans. Biomed. Eng., vol. 50, no. 3, pp. 365–374, 2003.
5. Z. Alfirevic, D. Devane, G. M. L. Gyte, and A. Cuthbert, “Continuous cardiotocography (CTG) as a form of electronic fetal monitoring (EFM) for fetal assessment during labor,” Cochrane Database Syst. Rev., vol. 2017, no. 2, 2017.
6. M. Romano, P. Bifulco, M. Cesarelli, M. Sansone, and M. Bracale, “Foetal heart rate power spectrum response to uterine contraction,” Med. Biol. Eng. Comput., vol. 44, no. 3, pp. 188–201, 2006.
7. A. Garrido, D. Ayres-de-Campos, and J. Marques-de-Sa, “Cardiotocograms,” vol. 318, no. November 1999, pp. 311–318, 2000. 8. N. B. Muppalaneni, M. Ma, and S. Gurumoorthy, Soft Computing, and
Medical Bioinformatics. Springer Singapore, 2019.
9. The Pennsylvania State University, ‘STAT 504 | Analysis of Discrete Data’. https:// onlinecourses.science.psu.edu/stat504/node/149 10. R. Gholami and N. Fakhari, SUPPORT VECTOR MACHINE :, 1st ed.
Elsevier Inc., 2017.
11. M. Cesarelli, M. Romano, and P. Bifulco, “Comparison of short term variability indexes in cardiotocographic fetal monitoring,” vol. 39, pp. 106–118, 2009.
12. D. Analytics, “Application of Machine Learning Techniques to classify Fetal Hypoxia Krishna Mohan Mishra Supervisor :”
13. D. Analytics, “Application of Machine Learning Techniques to classify Fetal Hypoxia Krishna Mohan Mishra Supervisor :”
14. Q. Ma and L. Zhang, "Progress in Neurobiology Epigenetic programming of hypoxic-ischemic encephalopathy in response to fetal hypoxia," Prog. Neurobiol., vol. 124, pp. 28–48, 2015.
15. G. Rm, Z. Alfirevic, G. Gml, and D. Devane, “Antenatal cardiotocography for fetal assessment ( Review ),” no. 9, 2015. 16. D. Ayres-de-Campos, C. Costa-Santos, M. Validation, and S. Group,
“Prediction of neonatal state by computer analysis of fetal heart rate tracings : the antepartum arm of the SisPorto 1 multicentre validation study,” vol. 118, pp. 52–60, 2005.
17. R. Kohavi, “A Study of Cross-Validation and Bootstrap for Accuracy Estimation and Model Selection,” no. March 2001, 2013.
18. M. Iii, “Big data and machine learning in critical care : Opportunities for collaborative research Organizing Committee of the Madrid 2017 Critical Care Datathon,” vol. 43, no. 1, pp. 52–57, 2019.
19. R. Bandi and G. Anitha, “Machine learning based Oozie Workflow for Hive Query Schedule mechanism,” 2018 Int. Conf. Smart Syst. Inven. Technol., no. Icssit, pp. 513–517, 2019.
20. P. A. Warrick, E. F. Hamilton, R. E. Kearney, and D. Precup, “A machine-learning approach to the detection of fetal hypoxia during labor and delivery,” AI Mag., vol. 33, no. 2, pp. 79–90, 2012.
21. A. L. Beam and I. S. Kohane, “Big data and machine learning in health care,” JAMA - J. Am. Med. Assoc., vol. 319, no. 13, pp. 1317–1318, 2018.
22. M. G. Signorini, A. De Angelis, G. Magenes, R. Sassi, D. Arduini, and S. Cerutti, “Classification of fetal pathologies through fuzzy inference systems based on a multiparametric analysis of fetal heart rate,” Comput. Cardiol., pp. 435–438, 2000.
23. Frank, A. and A. Asuncion, UCI Machine Learning Repository [http://archive. ics. uci. edu/ml]. Irvine, CA: University of California. School of information and computer science, 201.213 .0
24. Georgoulas, G., D. Stylios, and P. Groumpos, Predicting the risk of metabolic acidosis for newborns based on fetal heart rate signal classification using support vector machines. IEEE Transactions on biomedical engineering, 2006. 53(5): p. 875-884
25. T. Fushiki, “Estimation of prediction error by using K-fold cross-validation,” Stat. Comput., vol. 21, no. 2, pp. 137–146, 2011. 26. L. C. Briand, J. Wüst, J. W. Daly, and D. Victor Porter, “Exploring the
relationships between design measures and software quality in object-oriented systems,” J. Syst. Softw., vol. 51, no. 3, pp. 245–273, 2000.
AUTHORSPROFILE
Harmandeep Kaur is the Research Fellow in the
Department of Computer Science and Engineering, CT Institute of Engineering Management and Technology, Jalandhar, India. Her areas of interest are Machine Learning, Artificial Intelligence, IoT, Big data and Data Science
Vikas Khullar is working as Assistant Professor in the Department of Computer Science and Engineering, at CT Institute of Engineering, Management, & Technology, India. His area of research is Autism Spectrum Disorder, Big Data, IoT, Machine Learning, and Deep Learning. His teaching experience is 10 years and his research findings have been published through more than 20 research papers in refereed/indexed journals and international conferences.
![Figure 1: CTG and UC signals [4][6] CTG data analysis through Machine learning approaches](https://thumb-us.123doks.com/thumbv2/123dok_us/8165309.250778/1.595.304.558.320.459/figure-ctg-signals-ctg-analysis-machine-learning-approaches.webp)
![Figure 2: Outline of Machine Learning [8]](https://thumb-us.123doks.com/thumbv2/123dok_us/8165309.250778/2.595.330.523.50.168/figure-outline-of-machine-learning.webp)