International Journal of Innovative Technology and Exploring Engineering (IJITEE) ISSN: 2278-3075,Volume-8, Issue-11, September 2019
Abstract: Lung cancer is the second most causing cancer when compared to all the other cancers. According to WHO (World Health Organization) lung cancer contributes about 14 per cent among all the cancers. Therefore, early detection and treatment is very much required. Now-a- days, image processing techniques are playing a major role in early detection of disease which is very helpful in further treatment stages. These techniques help in detecting the abnormality of the tissues-tumor in target cancer images. In this research, the proposed methodology is majorly carried out in five phases. In phase one lung cancer and non-lung cancer, images are collected from the lung cancer database. In phase two preprocessing is done by using the Median filter. Median filter is chosen as it preserves the edges i.e, sharp features are preserved. In Phase three, segmentation of the target image is done using Fuzzy C Means. Fuzzy C Means Clustering is chosen as it gives better performance than K-means Clustering. In phase four, the features are extracted using GLCM (Gray Level Co-occurrence Matrix). GLCM have high discrimination accuracy and less computational speed. In phase five, these extracted features are given to SVM classifier for classification of lung cancer from normal lung. The SVM classier achieved accuracy of 96.7% for detecting and classification of lung cancer. Keywords: Median filter, FCM (Fuzzy C Means clustering), GLCM (Gray Level Co-occurrence Matrix), , SVM (Support Vector Machine).
I. INTRODUCTION
N
ow a days cancer is becoming the most common reason for human deaths, in which lung cancer occupies the second position. These cancer cells are produced due to the abnormal growth of cells in the human body. These cells can originate in any part of the body thereby leading to the cause of cancer [1]. Lung cancer can be caused in two ways. The first way is spreading of cancer cell in the lungs itself which is known as primary lung cancer. The second way is the spreading of cancer cells from other parts of the body to the lungs which is known as secondary lung cancer. According to WHO, 85 per cent of the lung cancer caused is of type NSCLC (Non-small cell lung cancer) and the remaining 15 per cent caused is due to SCLC (Small cell lung cancer) [2]. Detection of cancer atRevised Manuscript Received on September 03, 2019
* Correspondence Author
R.Ankita, M.Tech Scholar, Embedded Systems, Department of ECE, GRIET, Hyderabad. Email:[email protected]
Ch. Usha Kumari*, Professor, Department of ECE, GRIET, Hyderabad, Telangana, India. Email:[email protected]
Mr. Mohd. Javeed Mehdi, Assistant Professor. Department of ECE, GRIET, Hyderabad, Telangana, India. Email:[email protected]
N.Tejashwiniis M.Tech Scholar , Embedded Systems, Department of ECE, GRIET, Hyderabad
Dr T. Pavani, Professor, Department of ECE, GRIET, Hyderabad, Telangana, India
late stages is the main reason for increasing cancer rates leading to a greater number of death counts.
These death counts can be decreased by detecting the cancer cells at early stages itself. Image processing techniques can be used in early detection of this cancer cells and thus can help in treatment at initial stages.
The proposed methodology has five phases for the classification of lung cancer. In phase one, the required data is
collected from the database https://www.kaggle.com/datasets.
In phase two removal of noise is done by using the Median filter. In phase three, the taken input images are segmented using FCM (Fuzzy C Means) clustering. After segmentation, in phase four, features are extracted using GLCM (Gray Level Co-occurrence Matrix). These extracted features are used in phase five for classification purpose which is carried by SVM (Support Vector Machine).
Figure: Proposed Methodology for Cancer Detection
II. RELATEDWORKS
In this paper [3], detection of cancer was carried out with the help of ANN (Artificial Neural Network back- propagation). From the lung cancer database, a total of 50 images were considered and these images were divided into two groups- cancer and non-cancer images. The features were extracted with the help of GLCM (Gray Level Co-occurrence Matrix) and these were given to ANN. The cancer was detected and 80% of accuracy was obtained.
In this paper [4][20], two segmentation methods were used for early detection of lung cancer. The first method was Hopfield Neural Network (HNN) and the second method was Fuzzy C-Mean (FCM) algorithm. With the help of HNN, nuclei and cytoplasm regions were extracted successfully. HNN was preferred as FCM failed in extracting these features with accuracy.
This paper [5][19], proposed an automatic detection of lung cancer by suing CT scan
images. While diagnosing lung cancer, lung nodule detection
Lung Cancer Image- Feature Extraction and
Classification using GLCM and SVM Classifier
plays an important role. Therefore, FCN (Fully Convolutional Network) was selected for gaining more accuracy. First, FCN was used for segmentation and then lung nodules were detected. The proposed method was able to detect the lung nodules with 100 percent accuracy.
In this paper [6][18], CAD (Computer Aided Diagnosis) was preferred for detection of lung nodule. Here the disease can be detected after extracting the lung nodule region from the taken input CT scan images. Firstly, threshold value is set and then optimal thresholding is performed. After selection and application of this threshold value, region growing with connectivity analysis is applied to extract the cavity region.
In this paper [7], a novel technique was proposed for easing the segmentation technique. During analysis of lung cancer many images are considered and thus segmentation process becomes difficult for these huge number of data. Therefore, BNMB (Bayesian Network Model) was selected which is graphical model based on probability. This graphical
approach helped the images resulting from
over-segmentation.
In this paper [8], input color images were first converted into grey scale images as processing of grey scale image is easier than that of the color images. histogram equalization was then applied to the images for obtaining the sharp borders which can help in further analysis as it highlights the borders thereby increasing the contrast of the images. thresholding was applied and features were extracted based on the pixel value. By applying Baack Propagation Network, an overall efficiency of 78 percent was achieved.
In this paper [9], proposed methodology used CT (Computerized Tomography) scan images. The methodology has several steps such as pre-processing where the noise of the images is removed. The second step is image segmentation where over segmentation is removed using Marker Controlled Watershed Segmentation. The segmented image was then applied to Binarization and masking technique. Watershed achieved more accuracy when compared with Threshold which is 85.27 percent.
In this paper [10][17], lung cancer was detected using X-ray images. Median filter was used for removing noise. In segmentation stage, K-mean clustering and fuzzy C-mean is used for feature extraction. These extracted features were given to SVM classifier for classification. MATLAB tool with GUI where normality and abnormality of lungs can be shown easily.
In this paper [11], detection of lung cancer was done using CT images. The proposed system uses median filter and the wiener filter for preprocessing stage to remove the noise in the image. Features were extracted using GLCM technique and these extracted features were given to classifier. Here two classifiers were used- SVM and BPNN. The accuracy obtained by SVM classifier is 96.32 percent which is more when compared with that of BPNN which is 83.07 percent respectively.
III. METHODOLOGY
The process of classifying lung cancer is shown in Figure 1. The entire process of lung cancer detection is divided into five phases: image collection, image Preprocessing, image
segmentation, feature extraction and classification.
A.Image Collection
The cancer effected and non-cancerous images are collected from https://www.kaggle.com/datasets. Al the CT (Computed Topography) scan images are in Dicom format. Here CT scan images are selected because CT scan images are an advancement to X-ray images. CT scan images are a combination of X-ray images observed from different angles. CT scan images also have an advantage of high resolution, less noise. In this research, a total of 100 images are collected from the internet of which 70 are cancerous effected images and 30 are non-cancerous images.
B.Image Preprocessing
All the images collected are grayscale images. Grayscale images are easy to process when compared to that of RGB images. These collected images may contain noise, which can be of any type. So, filters are applied for removal of this noise. In this research, Median filter which is a non-linear digital filter is utilized for removing of noise. The advantage of median filter is, during removal of noise from the image the edges are preserved without any disturbance but under certain conditions only.
C.Image Segmentation
Segmentation plays an important role in classification of diseases. In this process the images are portioned into multiple segments. These segments combinedly cover the entire region or image. In this research, Marker-controlled watershed segmentation is utilized for segmentation purpose [12]. The main advantage of this technique is it provides fast segmentation results than the other techniques and moreover it helps in eliminating over-segmentation formed in watershed transformation technique [13].
D.Fuzzy C-means Clustering
Fuzzy C-means Clustering algorithm can be used for both classification and for clustering algorithm. It is used to find out clusters present in the provided data but this method is not similar to K-means clustering. It groups the similar data in one group and different types of data in different group. One of the advantages of FCM method is it gives accurate result when compared with that of K-means clustering [14].
E.Feature Extraction
There are many techniques available for extracting features from the images. in this research GLCM (Gray level co-occurrence matrix) is used for extracting texture features from the target image. This technique is preferred because it deals with the pixel information about position of identical gray level values. A total of 13 different features are extracted-Autocorrelation, Contrast, Correlation, Correlation, Cluster Prominence, Cluster Shade, Dissimilarity, Energy, Entropy, Homogeneity, Homogeneity, Maximum probability, Sum of squares, and Variance
F.Classification
SVM (Support Vector Machine) [15] is a machine learning
algorithm used for
International Journal of Innovative Technology and Exploring Engineering (IJITEE) ISSN: 2278-3075,Volume-8, Issue-11, September 2019
the patterns and classifies by identifying different patterns from the given data. First a set of input data is considered, from these two classes are categorized. These classes are given to classifier for detection[16].
In this research SVM classifies the abnormal images with that of the normal image and the result is obtained. The result provides the accuracy for the taken classification.
IV. RESULTS AND DISCUSSIONS
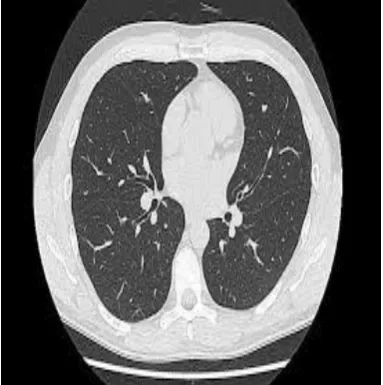
[image:3.595.313.547.41.596.2]Phase 1: Here figure 2a and 2b represents the normal and abnormal images taken from the dataset for classification purpose. All the collected cancerous and non-cancerous images are in Dicom format.
[image:3.595.339.515.50.239.2]Figure 2a: Normal Lung iamge
Figure 2b: Abnormal Lung image
Phase 2: Noise is removed successfully with the help of median filter while preserving all the edges carefully for classification purpose. The filtered image is as shown in Figure 3.
Phase 3: After filtering of image, segmentation of the image was done using Fuzzy C-Means clustering. FCM was successfully applied and better results were shown as in Figure 4.
Phase 4: Table 1 represents the extracted features of the taken input image by using GLCM. These are given to the classifier for the further classification.
Figure 3: Filtered image
Figure 4: FCM Segmented image
S.no Features Extracted value for
taken input image
1 Autocorrelation 4.9129
2 Contrast 2.8974
3 Correlation 9.0993
4 Cluster Prominence 1.0292
5 Cluster Shade 1.5734
6 Dissimilarity 2.2932
7 Energy 4.2073
8 Entropy 1.5343
9 Homogeneity 8.9457
Table 1: Feature values extracted for taken input image. Phase 5: The dataset used for this research consists of total 60 CT lung images. Among these 30 are cancerous images and 30 are non-cancerous images.
Total 9 features were selected for classification purpose which gave the below scatter plot as shown in Figure 5. This plot was obtained by plotting the obtained autocorrelation values against contrast values. In this plot the blue color represents the cancerous images, red represents the non-cancerous images and cross marks represents the misclassified images.
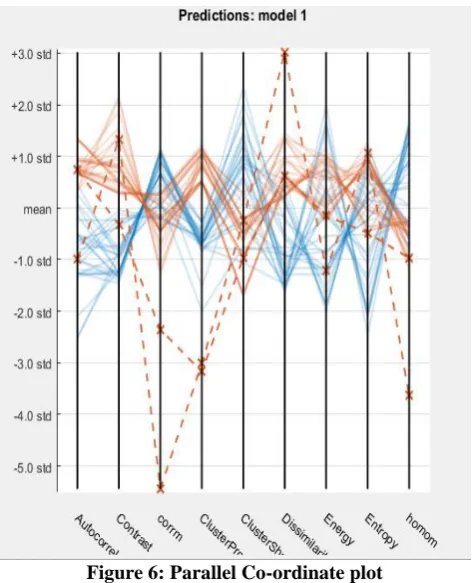
Here Figure 6 represents the parallel co-ordinate plot for the taken 9 features. In this plot the blue color curve represents the cancerous images
[image:3.595.73.265.212.405.2] [image:3.595.73.264.431.622.2]and red dotted curve represents the misclassified images curve.
[image:4.595.302.543.68.684.2]Figure 5: Scatter plot for Autocorrelation versus Contrast
Figure 6: Parallel Co-ordinate plot
The confusion matrix of taken 60 images is given as shown in Figure. From the result it is clear that among these 60 images 2 of the images are misclassified.
[image:4.595.52.286.74.338.2]ROC (Receiver Operating Characteristic) curve for the taken input images is as shown in Figure. After a successful 100 iterations for the taken 60 images an accuracy of 97.6 % was achieved. With the help of this images TP, TN, FN, FP values are known which was used to calculate the accuracy.
Figure 7: Confusion matrix Where,
A
TP=True Positive TN=True Negative FN=False Negative FP=False Positive
Figure 8: ROC Curve
[image:4.595.51.288.379.671.2]International Journal of Innovative Technology and Exploring Engineering (IJITEE) ISSN: 2278-3075,Volume-8, Issue-11, September 2019
V. CONCLUSION
The proposed methodology was followed by five phases image collection, image pre-processing, image segmentation, features extraction and classification. Median filter was used for image filtering in which the edges were preserved for classification. After completion of filtering, Fuzzy C-Means clustering is used for segmentation for fast and better results. Features for the taken images were extracted using Gray Level Co-occurrence Matrix. A total of 9 features were considered for classification and these were given to the classifier for classification purpose. Final result was obtained by applying SVM classifier. Plots for the classifier were successfully obtained and accuracy of 96.7 percent was achieved with the help of derived values from the respective plots.
REFERENCES
1. Al-Tarawneh, M.S. (2018). Lung Cancer Detection Using Image Processing Techniques.
2. Dhaware, B. U., & Pise, A. C. (2016, September). Lung cancer detection using bayasein classifier and FCM segmentation. In 2016 International Conference on Automatic Control and Dynamic Optimization Techniques (ICACDOT) (pp. 170-174). IEEE. 3. Anifah, L..., Haryanto, Harimurti, R.P., Permatasari, Z., Rusimamto,
P.W., & Muhamad, A.R. (2017). Cancer lungs detection on CT scan image using artificial neural network backpropagation based gray level coocurrence matrices feature. 2017 International Conference on Advanced Computer Science and Information Systems (ICACSIS), 327-332.
4. Taher, F., & Sammouda, R. (2011, February). Lung cancer detection by using artificial neural network and fuzzy clustering methods. In 2011 IEEE GCC Conference and Exhibition (GCC) (pp. 295-298). IEEE.
5. Chunran, Y., Yuanvuan, W., & Yi, G.X. (2018). Automatic Detection and Segmentation of Lung Nodule on CT Images. 2018 11th International Congress on Image and Signal Processing, BioMedical Engineering and Informatics (CISP-BMEI), 1-6.
6. Memon, N. A., Mirza, A. M., & Gilani, S. A. M. (2006, August). Segmentation of lungs from CT scan images for early diagnosis of lung cancer. In Proceedings of world academy of science, engineering and technology (Vol. 14).
7. Mohamed, A. S. E. D., Salem, M. A., Hegazy, D., & Shedeed, H. A. (2015, December). Probablistic-based framework for medical CT images segmentation. In 2015 IEEE Seventh International Conference on Intelligent Computing and Information Systems (ICICIS) (pp. 149-155). IEEE.
8. Kalaivani, S., Chatterjee, P., Juyal, S., & Gupta, R. (2017, April). Lung cancer detection using digital image processing and artificial neural networks. In 2017 International conference of Electronics, Communication and Aerospace Technology (ICECA) (Vol. 2, pp. 100-103). IEEE.
9. Patil, B. G., & Jain, S. N. (2014). Cancer cells detection using digital image processing methods. International Journal of Latest Trends in Engineering and Technology, 3(4), 45-49.
10. Segmentation and Detection of Lung Cancer Using Image Processing and Clustering Techniques Preeti Joon, Shalini Bhaskar Bajaj and Aman Jatain
11. Li, L., Wu, Y., Yang, Y., Li, L., & Wu, B. (2018, June). A New Strategy to Detect Lung Cancer on CT Images. In 2018 IEEE 3rd International Conference on Image, Vision and Computing (ICIVC) (pp. 716-722). IEEE.
12. Makaju, S., Prasad, P. W. C., Alsadoon, A., Singh, A. K., & Elchouemi, A. (2018). Lung cancer detection using CT scan images. Procedia Computer Science, 125, 107-114.
13. E. Ariascastro, and D. L. Donoho, “Does median filtering truly preserve edges better than linear filtering,” Annals of Statistics, vol. 37,2009, pp.1172-1206, doi:10.1214/08-AOS604.
14. R. M. Haralick, “Statistical and structural approaches to texture,” Proceedings of the IEEE, vol. 67, May. 1979, pp. 786-804, doi:10.1109/PROC.1979.11328.
15. Joon, P., Bajaj, S. B., & Jatain, A. (2019). Segmentation and Detection of Lung Cancer Using Image Processing and Clustering Techniques.
In Progress in Advanced Computing and Intelligent Engineering (pp. 13-23). Springer, Singapore.
16. Kumari, C.U., Rao, G.S.B. and Madhu, R., 2012. Erlang Capacity Evaluation In Gsm And Cdma Cellular Systems. International Journal Of Mobile Network Communications & Telematics (Ijmnct) Vol2, (5). 17. Kumari, C.U., Mounika, G. and Prasad, S.J., 2019, March. Identifying Obstructive, Central and Mixed Apnea Syndrome Using Discrete Wavelet Transform. In International Conference on E-Business and Telecommunications (pp. 16-22). Springer, Cham.
18. Kumari, C.U. and Padma, T., 2019. Energy-Efficient Routing Protocols for Wireless Sensor Networks. In Soft Computing and Signal Processing (pp. 377-384). Springer, Singapore.
19. Kumari, C.U., 2018, April. Investigation: Life-Time and Stability Period in Wireless Sensor Network. In 2018 3rd International Conference for Convergence in Technology (I2CT) (pp. 1-5). IEEE. 20. Kumari, C.U. and Krishna, R., M.: High performance wireless
communication channel using LEACH protocols. Pak. J. Biotechnol, 13, pp.52-56.
AUTHORSPROFILE
R.Ankitais currently pursuing M.Tech in the field of Embedded Systems in Gokaraju Rangaraju Institute of Engineering and Technology. She has pursued her B.Tech in the field of Electronics and Communication Engineering. Her research interests include Image processing and Signal processing.
Dr Ch Usha Kumari is a professor in Department of ECE, Gokaraju Rangaraju Institute of Engineering and Technology (GRIET), Hyderabad. She completed her Ph.D from Jawaharlal Nehru Technological University, Hyderabad. She completed her M.Tech from Andhra University Visakhapatnam. She had 14years of teaching experience. She published many journals and research papers in national and international conferences. She is life associate member of IETE and fellow member of IEEE.
Mr. Mohd. Javeed Mehdi is an Assistant Professor in the Dept. of E.C.E., Gokaraju Rangaraju Institute of Engineering and Technology, Hyderabad, India. He completed M.Tech.(Embedded Systems) from VIF College of Engineering and Technology, Hyderabad . He has 13 years of teaching experience, and published and presented papers in national and international conferences and journals. His areas of research interests are Embedded Systems, IOT, Data Science, and Image Processing.
N.Tejashwiniis currently pursuing M.Tech in the field of Embedded Systems in Gokaraju Rangaraju Institute of Engineering and Technology. She has pursued her B.Tech in the field of Electronics and Communication Engineering. Her research interests include Image processing and Signal processing.
.