International Journal of Innovative Technology and Exploring Engineering (IJITEE) ISSN: 2278-3075, Volume-8 Issue-10, August 2019
Abstract:. Various fields like Text Mining, Linguistics, Decision Making and Natural Language Processing together form the basis for Opinion Mining or Sentiment Analysis. People share their feelings, observations and thoughts on social media, which has emerged as a powerful tool for rapidly growing enormous repository of real time discussions and thoughts shared by people. In this paper, we aim to decipher the current popular opinions or emotions from various sources, hence, contributing to sentiment analysis domain. Text from social media, blogs and product reviews are classified according to the sentiment they project. We re-examine the traditional processes of sentiment extraction, to incorporate the increase in complexity and number of the data sources and relevant topics, while re-populating the meaning of sentiment. Working across and within numerous streams of social media, expression of sentiment and classification of polarity is re-examined, thereby redefining and enhancing the realm of sentiment. Numerous social media streams are analyzed to build datasets that are topical for each stream and are later polarized according to their sentiment expression. In conclusion, defining a sentiment and developing tools for its analysis in real time of human idea exchange is the motive.
Index Terms: Sentiment Analysis, Big Data, Sentiment Polarity, Decision Support System.
I.INTRODUCTION
To learn about a large population, traditionally, the polled population is subjected to a questionnaire that is standardized and this questionnaire is carefully sampled. This scenario has changed in recent times, due to the wider internet accessibility and the advent of social media, which has paved a path for newer concepts for analysis about bigger populations. This paper specifically is dedicated to the sentiment analysis dealing with extraction of sentiments or emotions or opinions from textual data, obtained from social media networks. Sentiment Analysis may be used to find popular opinion about newly launched products, services or events. It may also include Pre Poll opinions and help political parties to revamp their campaign strategies to adjust accordingly. The objective of Sentiment Analysis is classification of the opinions expressed on online platforms into positive, negative and neutral opinions, thus giving the current popular sentiment. As an advanced task, Sentiment Analysis may convey a diverse spectrum of emotions like sad, happy, angry, excited or disappointed.
Revised Manuscript Received on August 03, 2019.
Nymphea Saraf Sandhu, CSE, ASET, Amity University, Gwalior, M. P., India
Dr. A. K. Upadhyay, CSE, ASET, Amity University, Gwalior, M. P., India.
Dr. Sanjiv Sharma, CSE & IT, MITS, Gwalior, M. P., India.
Previous Sentiment Analysis research works were centered around reviews of products left by buyers on websites like Ebay and Amazon etc. and such researches had a narrow definition of sentiments, constituting of negative, positive and neutral sentiments. This labeling was a convenient classification and to gauge the buyer’s opinion in a quantitative way, star ratings were used as a mathematical indicator. Subsequently, web pages, articles and blogs were classified according to datasets that were elucidated specifically for generalized writings. The growth that online platforms like Twitter and Facebook have seen in previous decade has paved the way for an overabundance of researches for analyzing sentiments about varied topics and led to multiple modern applications and tools to analyze the same. In spite of the diverse applications that these have shown, the drawback with most of these studies or researches is that most of them have only focused on single source of data and have limited their findings to only a part of the actual variety of data available online. When one analyses the current research, [1], [2] and [5], it becomes a challenging query if lexicon or sentiment based concepts used for extracting product reviews is the right path to be followed in sentiment Analysis. A guideline set is being developed through this paper for representing of documents that can be used as a classifier for polarity of the sentiment at play. An experiment is conducted, encompassing popular datasets for Sentiment Analysis, to evaluate definition of popular features ad techniques for selection, including conventional techniques of Information Retrieval, including weighting schemes for features ad stemming.
II. LITERATURE SURVEY
Representation is a primary concern in the automatic classification process of documents. The most popular and basic representation is the Standard ‘bag of words’ which constitutes the vectors that are enclosed in the document. In order to classify the polarity, we thoroughly examine the strategies for weighing sentiments and test the performances of these classifiers on various deviations of the scheme of Term Frequency – Inverse Document Frequency (TFIDF).As a result of these examinations, we find that weighing of features by raw term frequency is surpassed by dual features with symbolization of occurrence of keywords. The uniformity of these findings was further checked based on the sources and vastness of the datasets used in these studies, further exploring the sturdiness using two bigger datasets, as in [4], [6] and [7].
Sentiment Trend Analysis of Big Data
For capturing a part of the context around standalone words, N-grams may be used. In spite of that, it is inconclusive weather they may be of value in classification of polarity. Further, no significant improvement is noticed in the performance using bi grams as compared to the use of unigrams, with a baseline of bag of words. However, using much bigger values of n, ranging up to 6, we notice a considerable improvement when bigger datasets are analyzed experimentally. The recall and precision statistically is much more conspicuous with very small improvements in the measure of Frequencies. To take this question into consideration, one must examine if there is an improvement in the performance, with the increase in calculations and n-grams with feature space as in [8] and [9].
Previous researchers of Sentiment Analysis have used the information on Part-of-Speech with success. There are four groups of adjectives, namely Orientation, Attitude, Polarity and Graduation, that can be semantically used to gauge the positive or negative inclination of the opinion expressed through a word. In addition, parts of speech other than adjectives are also useful in sentiment analysis; i.e., verbs, nouns and adverbs. Negation is another essentially important part of speech used for classification of polarity. This is important and an essential part of speech as while we use a polarity lexicon due to the fact that essentially the word polarity of is rendered the opposite of the original word, when negation is applied to it. The standard bag-of-words representation of a document can be supplemented by creating distinct features including words that are negated. Hence, the exploration of general Parts of Speech like nouns, verbs and adjectives along with negation is necessitated [10]. There have been several efforts to develop features that are more semantically interconnected than n-grams. To recognize n-grams and to identify the features for extraction of patterns that are closely associated with the text that is opinionated, one can use hierarchy features. Specific tools using software can be used to generate the patterns of extraction, organically. The patterns that result out of these are phrases that may be generalized, such as “drive <noun> nuts”. Although, nuts is a noun itself and does not express an opinion as such, but the entire phrase gives the sentiment that the subject is annoyed or irritated. Bootstrapping can be used to extract patterns from texts. For various categories’ templates, the extraction of lexicons semantically, one can propose the use of Mutually Exclusive Weighted Algorithm for Bootstrapping. To develop an alternate method to n-grams, in this research the use of a tagger is established for part-of-speech to extract phrases out of the text. Essentially, the use of lexicons for parts-of-speech is done for generalization of the particular features, in addition to dependency generalization with relation to the triples. The use of these generalizations facilitates the assumptions implicitly in research, related to the lexicons in addition to parts-of-speech [11].
III. PROPOSED METHODOLOGY
The sentiment analysis undertaken in this research, adopts a three pronged technique and that is due to the advancements in present methodologies used for the same. The first phase is the examination of the units like phrases, words and
n-grams, which are essentially basic and are an extraction from the original text. Secondly, in order to explore the selection of features, both strategies, namely, probabilistic and frequency-based are considered. Lastly, exploration of generalization of features is undertaken. Three separate lexicons are explored in addition to parts of speech: The first one is an extraction from basic sociological study of sentiment and is a theoretical study of Affect Control. Specific hypothesis are tested in the third part of the research which summarize the underlying definition of features and the methods employed in the research pertaining to Sentiment Analysis. Lastly, an analysis of the cost incurred for space needed to store and time taken to process the features is carried out for establishing the feasibility of the research.
Method Proposed for Sentiment Categorization Definition of Features
While retrieving information, the technique used classically is where words are stemmed or traced back to their morphological roots. As the variations of the word under question are cumulated across their occurrences, the size of the feature vectors that are stemmed grows smaller. In text mining and information retrieval, the success rates of stemming are mixed.
Term Frequency Weights
In information retrieval, a technique that is standard is the use of Term Frequency (TF) and its weights as an indication of the comparative importance for representation in documents. In spite of this, some work in SA indicates the use of 0 as the binary weight in case of appearance of the word in the document and 1 in case of its non-appearance where it is more apt for the classification of polarity. Although a scaled version of the Term Frequency works as well as the binary method, a certain research studying the weighing schemes in information retrieval for sentiment analysis concluded that the binary features have an edge over raw term frequency. Hence, in this research we accommodate experiment runs that are used for comparing the two schemes for weighting.
Reverse Negations Vs Negations
Never and Not are examples of negations that are more often than not included in the stop word lists and are therefore not considered while analyzing the text. On the other hand, when they are combined with other words, polarity of words is reversed by negations. Because of the reason that negation affects the polarity classification, most Sentiment Analysis researchers have tried to include and use them in combination with feature vectors. By adding NOT to various words, a new feature is created. This is a heuristic approach for identifying negated words.
Phrases with Negation
International Journal of Innovative Technology and Exploring Engineering (IJITEE) ISSN: 2278-3075, Volume-8 Issue-10, August 2019
A high n of up to 6 was used in a research of text fragments that are subjective and the findings were that the classification of polarity was significantly improved by the same. The use of n-grams in data sets that are smaller in size is still not clear as the data may not be sufficient in order to get detailed information about the pattern of their occurrence. Due to the fact that n-grams are usually unreal as they do not essentially depict a part of text that is semantically bound, one must look at using grammatical phrases as properties of the text under the scanner.
Selection based on Frequency
If the words do not appear often in the corpus, the common practice in text modeling is to remove these words. Presumption is made that these words may be spelled incorrectly and hence are of no help in the generalization process. Words occurring on only one instance in the corpus are generally discovered to be highly accurate indicators showing subjectivity. Thus these rare words are very significant in the classification process.
Selection based on Information
Features that are less useful may be removed in order to improve the performance of the classifier. Interdependent information that is expected beforehand is a regular feature in the measurements in the selection process. If we use a random binary variable R, then a variable of binary class, V can be calculated as follows:
In this equation, ew=1 when the word w is present in the document, otherwise it is 0. In the same way, eg is 1 when group g includes the document, otherwise it is 0. The features presence or absence may hence take up a binary value, depending on their existence or non-existence in the document. This criterion is followed throughout in this research.
Selection Based on POS
Some POS are more useful than others in the process of classification of sentiment. If we use only adjectives, it may not have as desired an effect as using both adverbs and adjectives. Verbs can also be used for classifying sentiments. If we consider adjectives to be the most important POS for determining the polarity of the expressed sentiment, the performance of the classifier can be improved by limiting the space of the features to adjectives only and less significant words may be removed. The final testing is done by examining words from POS like verbs, nouns and adjectives, both individually and in a combined manner.
Selection based on Lexicon
Feature selection can also be done in a similar manner by using lexicons that are sentiment annotated. Feature set may exclude features that are less useful, by choosing words that indicate sentiment that is strong in nature. Most lexicons that are well known are usually a part of Word-Net, which is an extensive database of lexical English words. In our analysis, both lexicons are used. Affect Control Theory lexicon is also used for the analysis.
Generalization
POS based Phrase Generalization
Generalization in a drastic manner can be done by exchanging all the words with their respective POS, which may change the meaning of the original sentence and remove all the meaning it conveys. Another way of achieving this is to generalize words that do not belong to important POS and to replace only the significant ones. Sentiment polarity is mostly indicated by verbs, nouns and adjectives. A thorough analysis is done to gauge the affect of these POS individually and in a combined manner on the classification of sentiment. In a similar manner, we can analyze nouns and verbs.
Lexicon based Phrase Generalization
Generalization of phrases can also be achieved by considering the importance of lexicon words that are sentiment-annotated.
IV. RESULT ANALYSIS
Depending on the overall accuracy in each dataset, the performance scores for classifiers are given in addition to the F-measure, which forms a combination of information for recall as well as precision, for both types of classes, positive and negative. The method adopted in each run is explained through results that use n-grams, basic phrases, stems and single words.
The resultant assignment of the text into negative or positive sentiment depends on the votes in majority of a particular class. Table 1 below shows the Run Design Description with its components described below.
Table 1: Description of Run Design
Stemming
Not always does stemming add value to the work of Information Retrieval. If we do not stem the terms in the first run, it may increase the average accuracy but this increase is insignificant when compared to the second run. This enhancement is more significant in case of A dataset, where the significance conspicuously increases.
Binary Weights versus Term Frequency
If we compare the second run of Term Frequency to the third run of binary weights or the first and fourth runs,
Run No.
Stemming Binary Weights vs Term Frequency
Negative Words
n-gram
1 Noc TFc Noc {c
2 Yesc TFc Noc {c
3 Yesc Binc Noc {c
4 Noc Binc Noc {c
5 Noc TFc yesc {c
6 Noc TFc Noc 2c
7 Noc TFc Noc 3c
8 Noc TFc Noc 1,2c
9 Noc TFc Noc 1,2,3c
we observe that the dataset performances change insignificantly. Hence, there isn’t a visible benefit of the usage of binary in place of weighting the term frequency. On the other hand, there is a noticeable change in the frequency measure in the dataset B for a negative class. Since only about 10% of documents with negative sentiment are contained in this dataset, it poses a bigger challenge and this leads to a lower performance in classification for this class that is not represented amply. The class that is in minority is more often than not of interest and the features helping in classifying it is significant in further research about the subject.
Negations
In the fifth run, the addition of words that are negated finds significant use. If we compare this to a similar first run, we notice a significant improvement level in all three of the datasets. While considering the words to be the unit at the base of all datasets, the best performance is achieved in the fifth run. Taking the standard Pang & Lee dataset using the document representation that is simple, the achieved accuracy outperforms all others.
N-grams
N-grams of up to 3 are included in from sixth to ninth runs. In order to effectively check the influence of every level ofcn, every other aspect of feature-space is maintained at a constant. Here, we do not use stemming, don’t add any features of negated words and we do use the term frequency. All datasets experience a reduction in accuracy with the increase in the n-grams. The best performance for the smallest dataset is observed in observed in the eighth run in which 1 and 2 grams are included. Also, the ninth run that include 1, 2 and 3-grams performs the finest for the dataset that is smallest and is the best one for the remaining two. Hence it is observed that the appropriate n must be chosen in accordance with the dataset size. For smaller datasets, strings that are longer are not useful.
Phrases
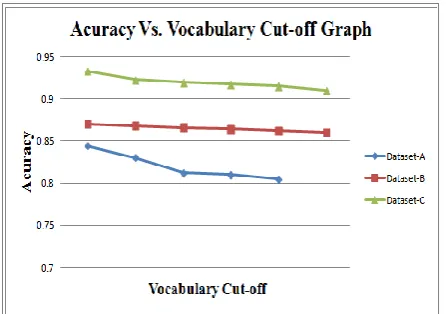
[image:4.595.316.540.49.206.2]When we train the classifier to classify the phrases that are generated by lexical phrases, the baseline run of the phrase’s performance is shown by the tenth run. This shows a substantial upgrading over most of the baseline even when the performance of this approach is much lower than the first run on every dataset using single words. This is an unexpected result because features that are similar semantically should by logic be in a position to represent the document in a better fashion. For any future work, a closer observation and analysis may be required while using this type of feature. Figure 1 shows the graph depicting the vocabulary cut-off versus the accuracy, in case of datasets a, B and C. In conclusion, when we compare n-grams, phrases and words, we may observe that the combination of an n-grams vocabulary that has single words is the best approach possible. Even when we use stemming, features that are enriched by negation or words weighted differently are not found to make a significant change in general. On the other hand, for smaller datasets or datasets having largely lesser represented classes, these techniques may be more apt.
Figure 1: Single word runs feature selection using cut offs on frequency based vocabulary
Feature Selection
Selection based on Frequency
In this module, we gauge the merits of not considering the words appearing lesser times than the appearance of c in the given dataset which is a part of the feature space that is also known as cutting the tail of the used vocabulary. There wasn’t a noticeable decline in performance in comparison with a full run of the vocabulary. When we observe the acceptable cutoffs for all the three datasets, it is different for each. This points to the fact that while classifying certain datasets, there is more sensitivity to rare words in some datasets and in others, this is not so.
Selection of Mutual Information
The datasets are divided into three subsets to gauge the effect that the selection of features from the mutual information on the working of categorization of polarity. These subsets are Test (20%), Tune (30%) and Train (50%). We keep a constant proportion of negative and positive documents for both datasets that have an unequal share of polarities. For reaching this goal, first step was to remove the features from training set and calculating their MI scores. For calculating these features, we use the settings of the run that are based on the best word, that is, the fifth run. Once the features are sorted in an ascending order, we choose top N for representing the documents in the Tune set. Here, N varies from the documents that belong to the top few to the feature space size. In the end, a value of N is chosen for each available dataset for maximizing the performance and we use the Test set for determining the performance of classifiers at this cut off. It is a possibility that because the features have been developed on different subsets than the ones that they are representing, their accuracy is affected negatively due to the mismatching vocabulary. This can especially be observed in the dataset that is smaller which is most accurate.
Selection based on POS
International Journal of Innovative Technology and Exploring Engineering (IJITEE) ISSN: 2278-3075, Volume-8 Issue-10, August 2019
Even when the accuracy is best achieved while using all these POS, most improvement achieved for each feature is firstly gained with adjectives, followed by verbs, which depicts those adjectives and verbs which are the most useful in classification of polarity.
Selection based on Lexicons
By constricting the feature space to lexicons that are sentiment annotated, we can employ a different path for using knowledge that is external in selection of features. In the given table, the second half depicts the classifier performance which is trained by using features which are limited to any of the three main lexicons. The lexicon that is largest is SentiWord Net or SWN, which has 53875 lexicons has the top most performance for both C datasets and Pang & Lee datasets. While using B dataset, the performance of SWA is equivalent to the Word Net A or WNA (containing 2543 lexicons) run, which makes its feature or improvement ratio less than the WNA run by 25 times. Thus, the feature space can be decreased successfully by the use of collection of specific measurements like MI and term frequency, while performance can be improved significantly in the case of MI. Lexicons and POS were not found to be useful, which suggests that the dataset vocabulary is the most apt way for starting to build a classifier.
Generalization of Features
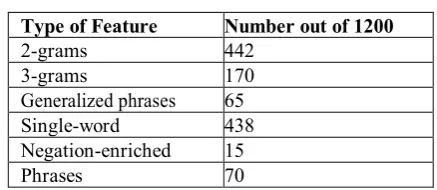
[image:5.595.332.551.68.163.2]Various heuristics are applied to the phrases to generalize the features in an attempt to examine the worth of lexicons and POS in a different scenario. The tenth run being a baseline phrase fall short when compared to n-grams and single word. As the features that are generated are enormous in number in the test conducted, we only discuss Pang & Lee results in this phase. To begin with, we take an approach that is more drastic and we take all the words and replace them with their POS, resulting in an accuracy of 0.6, which is an unexpected figure when the non significance of resulting features is considered. After this, all words are replaced with their respective P.O.S., excluding certain words that are more imperative for the purpose, to avoid major generalization. The performance sees a considerable improvement once the words that constitute the lexicons that are sentiment annotated are considered. The accuracy of the lexicons sees a jump to 0.8, especially with SWN. These results use MI and show the topmost 50 features for the dataset by Pang & Lee. All of these are either 2 or 3-grams or features with single word. Some words are more conspicuous in expressing the opinions and hence are more obvious, e, worst, stupid, bad, horrible, etc. Some other words may be more surprising, like ‘the’ and ‘both’, which implies that certain punctuations and stop words may better indicate the polarity of the sentiment. As an extension, one may notice features suggesting plot, script, bad play or awesome movie, which pertain to the dataset’s main topic that is being analyzed. If we use MI for selecting features, the lexicons that are created may not only be highly accurate, but also more specific to the domain, encompassing almost all types of feature. The discussed features and their numbers out of 1200 are tabulated in Table 2.
Table 2: Features Found in Lexicons
Cost Analysis
A primary and significant issue in the practical deployment of any research is the cost that it incurs in its deployment. Here, the cost is directly related to the computational time that is required for generation of various features and the need of space for their storage. Phrases were the second largest les that were produced, only preceded by n-grams. In the given table the columns show in milliseconds, the time that it takes in the generation of feature space and the time on average that it takes for generation of a feature vector pertaining to each document. These tests have been run on a 2.2 GHz Pentium Processor with a 3 GB RAM.
Considering the number of features, the features that are enriched by negation are smaller in size when compared to features of other types as to extract these, we use templates and hence in generation of feature space, the time that is taken is much higher than the time needed in generation of the feature space of 2-gram. The time it takes for the generation of the feature space and the processing of each document, is greatly affected by the lexicon size that is used for generalization.
V.DATA AVAILABILITY STATEMENT
The social media data used to support the findings of the study have been obtained from ‘Keyhole’, which is a social media hashtag tagging tool. The data is currently being used for further study, along with subsequently collected data until the further research findings are submitted to the University. Requests for data after 10 months of the publication of this article will be responded to by the authors after the final thesis submission and simulation implementation.
VI. CONCLUSION
To analyze most of the contemporary and most used selection, generalization and definition of features, we explore three main datasets for testing the most popular Sentiment Analysis Techniques. We conclude that some of the hypothesis that are prevalent like the importance of adjectives for classification of polarity hold true. We also confirm that using binary and using stemming in place of ‘termcfrequencyfeaturecvectors’ does not affect the working of the system efficiently, and also conclude that the use of some methods are dependent on the dataset behaviour. As an example, the selection of few top features when we use Mutual Information or MI, adversely affects the classifier performance while analyzing a smaller datasets and at the same time, the same technique proves to be a good approach for datasets that are larger in
size. In conclusion, the analysis of cost with respect
Type of Feature Number out of 1200
2-grams 442
3-grams 170
Generalized phrases 65
Single-word 438
Negation-enriched 15
oto
to the space required for storing the dataset and the time taken for its computation.
REFERENCES
1. Kouloumpis E, Wilson T, Moore J. Twitter sentiment analysis: The good the bad and the omg!. InFifth International AAAI conference on weblogs and social media 2011 Jul 5.
2. Coletta LF, Hruschka ER, Acharya A, Ghosh J. Using metaheuristics to optimize the combination of classifier and cluster ensembles. Integrated Computer-Aided Engineering. 2015 Jan 1;22(3):229-42.
3. Silva NF, Coletta LF, Hruschka ER. A survey and comparative study of tweet sentiment analysis via semi-supervised learning. ACM Computing Surveys (CSUR). 2016 Jul 28;49(1):15.
4. Lourenco Jr R, Veloso A, Pereira A, Meira Jr W, Ferreira R, Parthasarathy S. Economically-efficient sentiment stream analysis. InProceedings of the 37th international ACM SIGIR conference on Research & development in information retrieval 2014 Jul 3 (pp. 637-646). ACM.
5. Medhat W, Hassan A, Korashy H. Sentiment analysis algorithms and applications: A survey. Ain Shams engineering journal. 2014 Dec 1;5(4):1093-113
6. Miura Y, Sakaki S, Hattori K, Ohkuma T. TeamX: A sentiment analyzer with enhanced lexicon mapping and weighting scheme for unbalanced data. InProceedings of the 8th International Workshop on Semantic Evaluation (SemEval 2014) 2014 Aug (pp. 628-632).
7. Ren Y, Kaji N, Yoshinaga N, Kitsuregawa M. Sentiment classification in under-resourced languages using graph-based semi-supervised learning methods. IEICE TRANSACTIONS on Information and Systems. 2014 Apr 1;97(4):790-7.
8. Velichkov B, Kapukaranov B, Grozev I, Karanesheva J, Mihaylov T, Kiprov Y, Nakov P, Koychev I, Georgiev G. Su-fmi: System description for semeval-2014 task 9 on sentiment analysis in twitter. InProceedings of the 8th International Workshop on Semantic Evaluation (SemEval 2014) 2014 Aug (pp. 590-595).
9. Saif H, He Y, Fernandez M, Alani H. Contextual semantics for sentiment analysis of Twitter. Information Processing & Management. 2016 Jan 1;52(1):5-19.
10. Severyn A, Moschitti A. Twitter sentiment analysis with deep convolutional neural networks. InProceedings of the 38th International ACM SIGIR Conference on Research and Development in Information Retrieval 2015 Aug 9 (pp. 959-962). ACM.
11. Tang D, Qin B, Liu T. Deep learning for sentiment analysis: successful approaches and future challenges. Wiley Interdisciplinary Reviews: Data Mining and Knowledge Discovery. 2015 Nov;5(6):292-303.
AUTHORS PROFILE
Nymphea Saraf Sandhu is a B.E. (Computers) from Pune University and having done her M.Tech in CSE from SATI, Vidisha. She is currently pursuing PhD from AST, Amity University, Gwalior. She has earned a certificate in Gamification from University of Pennsylvania and has an industry experience of over 17 years in Hardware, Software, Media and Communications. She works in a Film Production House and specializes in Media Management, with emphasis on Social Media.
Dr. A. K Upadhyay is a Masters of Engineering from BITS, Pilani, with a PhD in Regression Testing from MNNIT, Allahabad. He has 7 years of Industry Experience with 18 years experience in teaching Engineering students across various Institutes. He has contributed in over 13 conferences across India with Two publications as the main author and various others as co-author. He earned the U.P. State Scholarship from 1979 to 1981 and received Merit Scholarships from U.P. Board and Luckhnow University. He is presently a Professor in ASET, Amity University, Gwalior, teaching and guiding students in B.E. and PhD, respectively.