Int. J. Electrochem. Sci., 10 (2015) 10199- 10209
International Journal of
ELECTROCHEMICAL
SCIENCE
www.electrochemsci.orgEQCM Study on Pulse Current Pt Electrodeposition
I-Te Lu1, Yu-Chi Hsieh2,Po-Chun Chen1,3,* and Pu-Wei Wu1,*
1
Department of Materials Science and Engineering, National Chiao Tung University, Hsinchu 30010, Taiwan
2
Brookhaven National Laboratory, Chemistry Department, Building 555, Upton, NY 11973, USA
3
Biomedical Electronics Translational Research Center, National Chiao Tung University, Hsinchu 30010, Taiwan
*
E-mail: [email protected]; [email protected]
Received: 4 August 2015 / Accepted: 18 September 2015 / Published: 4 November 2015
Electrochemical Quartz Crystal Microbalance (EQCM) was used to investigate the events occurring during current-on (Ton) and current-off (Toff) for pulse current electrodeposition of Pt in both air and Ar
atmospheres. The EQCM profiles indicated a transient mass loss when the current was turned on, followed by a linear mass gain associated with the Pt electrodeposition from the H2PtCl6 plating bath.
During the Toff, the mass revealed a steady increase until it leveled off after 10 sec. The minute
transient mass loss during the initial stage of Ton was attributed to the reduction of the adsorbed PtCl6
2-whereas the mass gain during the Toff was due to the absorption of PtCl62- onto the freshly-deposited Pt
surface. In air atmosphere, the parasitic oxygen reduction reaction consumed part of the reduction current and thus, reduced the Pt plating efficiency by 6%. In addition, smaller mass gains during Toff
and Ton were observed for the Pt plating in air atmosphere.
Keywords: Pulse Current Electrodeposition, EQCM, Platinum, Electrodeposition Efficiency
1. INTRODUCTION
in nanoparticular forms. For electrochemical application, however, the most straightforward approach is to electroplate the Pt directly onto the current collector because the electrodeposition enables the formation of Pt at the surface so the catalyst utilization rate can be significantly enhanced. [13-16]
The electrodeposition can be conducted in direct-current or pulse mode. Between these two, the pulse mode allows for multiple events of nucleation and growth, as well as sufficient resting time to replenish the electrolyte. To date, the pulse plating technique has been demonstrated for depositing materials within sub-micrometer trenches and producing deposits in unique shapes. [17-19] In pulse electrodeposition, independent parameters, such as current density (Ja), current-on time (Ton), and
current-off time (Toff) are adjusted to obtain deposits with different particle sizes and distributions. [20,
21] In addition, the events occurring during Ton and Toff play significant roles in determining the
deposit morphology and coulombic efficiency. For example, Chen et al. studied the current efficiency under various pulse current conditions and observed a significant morphology change by simply adjusting the Ton in Pb/Sn plating bath. [22] It is anticipated that the chemical species in the plating
bath or produced during Ton would adsorb and interact with the freshly-deposited metal surface during
Toff, and thus participates in the reduction reaction during subsequent Ton.
The electrochemical quartz crystal microbalance (EQCM) is a powerful tool to investigate the events occurring at the working electrode. The operation principle of EQCM and the critical factors affecting the EQCM data have been reviewed in details. [23-25] The EQCM detects the change in the resonance frequency of the working electrode during electrochemical reaction, and correlated the frequency change to the variations in the mass of the deposit, the viscosity of the electrolyte, and temperature. [26-28] Based on the information obtained via EQCM, relevant electrochemical steps can be identified and analyzed, such as electrodeposition, dissolution, adsorption/desorption, and coulombic efficiency. [29-34] In the case of electroplating, the mass change can be determined using the Sauerbrey equation. [35] In short, the mass change caused by the chemical and physical reactions on the working electrode can be monitored in-situ, along with the corresponding potential or current. The mass sensitivity of the EQCM is in the order of ng/cm2 and therefore, even a subdued mass change on the electrode surface can be detected accurately.
Earlier, the EQCM has been utilized to study the electrodeposition of Pt using potential-controlled methods such as constant potential, pulse potential, and cyclic voltammetric (CV) scans. [25, 36-41] However, none of them discussed the electroplating behavior using pulse galvanostatic deposition via EQCM. In this study, we employed the EQCM to investigate the events occurring during pulse current Pt electrodeposition in both air and Ar atmospheres. The EQCM recorded the variations in mass and potentials during Ton and Toff in order to identify the chemical reductions,
adsorption/desorption, and the role of dissolved oxygen.
2. EXPERIMENTAL
MHz polished Au-coated AT-cut quartz crystal (INFICON) with a geometric area of 1 cm2. The Ag/AgCl and Pt foil (8 cm2) were served as the reference and counter electrodes, respectively. The distance between the working electrode and the counter electrode was 6 cm, and the volume of the electrolyte was 100 ml.
Prior to the EQCM calibration and Pt electrodeposition, the working electrode was subjected to multiple CV scans between -0.4 and 1.2 V (vs. Ag/AgCl) in a 0.1 M aqueous H2SO4 solution at a scan
rate of 50 mV/s. The purpose of the CV scans was to remove any contaminant on the Au surface. Subsequently, the sensitivity of the working electrode was determined using a mixture of 0.01 M AgNO3 and 0.5 M HNO3 aqueous solutions in which a potentiostatic plating at 50 mV (vs. Ag/AgCl)
was conducted for 5 sec. The plating of Ag produced a minute weight increment which resulted in a slight reduction of the resonance frequency of the quartz crystal. The Ag plating was repeated for five consecutive times and assuming its coulombic efficiency was 100%, the sensitivity factor for the Au-coated quartz crystal was 5.799 ng/Hz·cm2
, based on the Saubrey equation. After the calibration, the working electrode was immersed in a 0.1 M aqueous H2SO4 solution for multiple CV scans from -0.4
to 1.2 V (vs. Ag/AgCl) at 50 mV/s until the resonance frequency remained unchanged. At this stage, the deposited Ag was stripped completely from the Au surface.
The Pt plating electrolyte was prepared by dissolving 99.9 wt% H2PtCl6 (UniRegion Bio-Tech)
in deionized water. The resulting concentration was 10 mM and the pH value of the electrolyte was 1.78. The Pt electrodeposition was performed in both air and Ar atmospheres. For the experiments in Ar atmosphere, the plating bath was purged with Ar for 1 hr to remove any dissolved oxygen, and the electrodeposition was carried out in a sealed system saturated with Ar. The Pt electrodeposition was conducted in a pulse current mode in which the current density was -5 mA/cm2, the Ton was 1 sec, and
the Toff was 50 sec. In total, 20 pulses were imposed and their corresponding variations in mass and
potentials were recorded. All the electrochemical process was conducted at 25°C, and the electrolyte was unstirred throughout the entire experiments. Since the pH of the Pt plating bath was 1.78, the potential for the reversible hydrogen electrode (RHE) became -0.305 V (vs. Ag/AgCl) as RHE = [-0.200-0.0591×(pH)]. All the potentials in the figures were plotted against the RHE.
3. RESULTS AND DISCUSSION
The OCV for the working electrode in the Pt plating bath was 1.058 V (vs. RHE). This value reflected the interfacial structure between the Au surface and the Pt ions in the electrolyte. Once the pulse plating was performed, and the Au surface was fully covered by the Pt deposit (after 1 pulse), the OCV became 0.981 V (vs. RHE). Fig. 1(a) displays the EQCM results from pulses #5~#9 for the Pt electrodeposition in air atmosphere. Among these pulses, the OCV at Toff maintained a constant value
and a sharp drop to -0.272 V was observed once the current was switched on. This indicated a potential drive of 1.253 V for the reduction reaction. During Toff, the OCV rose up quickly and continued
increasing until it leveled off after 10 sec. As expected, considerable mass gain was recorded during Ton, which was attributed to the deposition of Pt from the electrolyte. These EQCM results
Table I. Possible reduction reactions and their respective redox potentials during pulse current electrodepositions (Ton) in air atmosphere.
Reduction reaction Redox potential estimated from Nernst equation (V
vs. RHE)a
Redox potential in standard state (V vs. RHE)
References
2H+ + 2e → H2 0 0 41
O2 + 4H+ + 4e → 2H2O N/Ab 1.334 41
PtCl62- + 4e → Pt + 6Cl- 0.819 0.849 41
PtCl62- + 2e → PtCl4- + 2Cl- N/Ab 0.831 41
PtCl42- + 2e → Pt + 4Cl- N/Ab 0.863 41
a
we assume that the activity coefficient is 1 so the value of activity is equal to the concentration.
b
the exact concentrations of dissolved O2 and PtCl42- are unknown.
Table I lists the possible electrochemical reactions during Ton and their corresponding redox
potentials. In principle, these reactions were likely to occur to various degrees contingent on their respective concentrations and overpotentials.
250 300 350 400 450 500
-0.4 0.0 0.4 0.8 1.2 Voltage Mass gain Current density Time (sec) V o lt a g e ( V v s. R H E ) 4 6 8 10 12 14 M a ss g a in ( g /c m 2 ) -5 -4 -3 -2 -1 0 C u rr e n t d e n si ty ( m A /c m 2 )
355 360 365 370 375
-0.4 0.0 0.4 0.8 1.2 mass gain Voltage Mass gain Current density Time (sec) V o lt a g e ( V v s. R H E )
slight mass loss
8 9 M a ss g a in ( g /c m 2 ) -5 -4 -3 -2 -1 0 C u rr e n t d e n si ty ( m A /c m 2 )
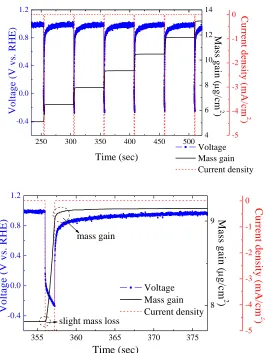
Figure 1. (a) The EQCM profiles from pulses #5~#9 for the Pt electrodeposition in air atmosphere (Ton
= 1 sec; Toff = 50 sec; current density = -5 mA/cm2). (b) The enlarged EQCM profile from a
[image:4.596.44.552.112.229.2] [image:4.596.167.432.342.695.2]
Fig. 1(b) exhibits the EQCM profile from a single pulse (#7) so the detailed responses of in mass and OCV can be better distinguished. During Toff, the OCV reading was 0.981 V. Once the
current started flowing (Ton), the potential decreased sharply at the beginning, followed by a slow
decline. We realized that the former was caused by the double-layer charging and parasitic ohmic drop whereas the latter was associated with the activation and concentration polarizations of possible reactions listed in Table I. Once the current was switched off (Toff), the potential rebounded
immediately reflecting the removal of ohmic drop. However, the potential continued rising for a few seconds during Toff,suggesting the dynamic reconstruction of electrode/electrolyte interface. Table II
lists the possible reactions occurring during the initial stages of Toff and Ton, as well as their expected
variations in the mass and OCV.
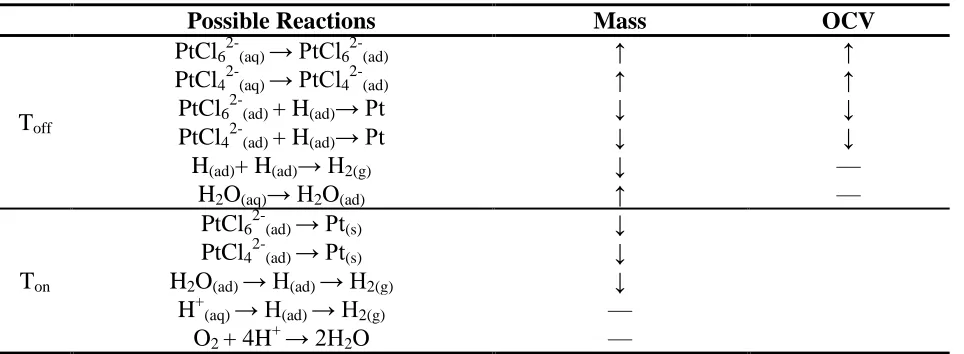
Table II. Possible reactions during the initial stage of Toff and initial stage of Ton, as well as their
expected variations in the mass and OCV (↓: Decrease; ↑: Increase; —: No change).
Possible Reactions Mass OCV
Toff
PtCl62-(aq) → PtCl62-(ad) ↑ ↑
PtCl42-(aq) → PtCl42-(ad) ↑ ↑
PtCl62-(ad) + H(ad)→ Pt ↓ ↓
PtCl42-(ad) + H(ad)→ Pt ↓ ↓
H(ad)+ H(ad)→ H2(g) ↓ —
H2O(aq)→ H2O(ad) ↑ —
Ton
PtCl62-(ad) → Pt(s) ↓
PtCl42-(ad) → Pt(s) ↓
H2O(ad) → H(ad) → H2(g) ↓
H+(aq) → H(ad) → H2(g) —
O2 + 4H+ → 2H2O —
For the mass variation, a slight mass loss was observed during the start of Ton, which was due
to the reduction of the adsorbed PtCl62- on the freshly-deposited Pt surface. Afterwards, a sizeable
mass gain was recorded owing to the deposition of Pt from the Pt ions in the electrolyte, i.e., the electrochemical reduction of PtCl62- and PtCl42-. Interestingly, during Toff, a moderate mass increment
was also recorded which was attributed to the adsorption of PtCl62- from the electrolyte. According to
earlier studies of Pt (111) film immersed in an aqueous solution containing 0.6 mM H2PtCl6 and 50
mM HClO4, the adsorbed species on the Pt (111) surface at potential between 0.7 ~ 0.95 V (vs. RHE)
was exclusively PtCl62-. [42] Therefore, in our case we believed that once the current was turned off,
the PtCl62- was adsorbed preferentially to the fresh Pt surface, leading to a steady rise of the OCV to
0.981 V (vs. RHE). It is noted that this 0.981 V was more positive than the redox potential of PtCl62-/Pt
which was 0.819 V (vs. RHE) for 10 mM H2PtCl6 electrolyte from Nernst equation. Hence,
thermodynamics favored the formation and stability of PtCl62- adsorption onto the fresh Pt surface.
An alternative explanation for the mass gain during Toff might be the formation of Pt(OH)x or
the adsorption of Cl- ions. In the literatures, the Pt surface was prone to form Pt(OH)x at potential up to
[image:5.596.61.543.308.485.2]
and thus the presence of Pt(OH)x was likely. However, the H2PtCl6 was not used in those studies but in
our plating bath the PtCl62- was the predominant constituent. In theory, the mass gain associated with
the Pt(OH)x during Toff should be equal to the transient mass loss during Ton because the reduction
current was expected to reduce the adsorbed species first. However, in our case the EQCM profiles indicated a different pattern; the transient mass loss during Ton was merely 13% of the mass gain
during Toff. Therefore, we concluded that the formation of Pt(OH)x was not the principal contributor to
the mass gain during Toff. Likewise, the amount of adsorbed Cl- during Toff was likely to be relatively
low. It is also possible that during Toff, the adsorbed hydrogen engaged in a displacement reaction with
the PtCl62- ions from the electrolyte, resulting in a mass gain. However, according to Solla-Gullon et
al. and Nutariya et al., the adsorbed hydrogen can only exist on the fresh Pt surface in a potential range between 0.12 and 0.27 V (vs. RHE). [45] Therefore, we concluded that the mass gain during Toff was
not caused by the formation of Pt(OH)x, the adsorption of Cl-, and the displacement reaction of the
adsorbed hydrogen.
The Pt is an electrocatalyst for oxygen reduction reaction (ORR) and the pulse plating inevitably induces the ORR in conjunction with the deposition of Pt.
250 300 350 400 450 500
-0.4 0.0 0.4 0.8 1.2 Voltage Mass gain Current density Time (sec) V o lt a g e ( V v s. R H E ) 4 6 8 10 12 14 M a ss g a in ( g /c m 2 ) -5 -4 -3 -2 -1 0 C u rr e n t d e n si ty ( m A /c m 2 )
355 360 365 370 375
-0.4 0.0 0.4 0.8 1.2
[image:6.596.166.426.346.701.2]slight mass loss mass gain Voltage Mass gain Current density Time (sec) V o lt a g e ( V v s. R H E ) 9 10 M a ss g a in ( g /c m 2 ) -5 -4 -3 -2 -1 0 C u rr e n t d e n si ty ( m A /c m 2 )
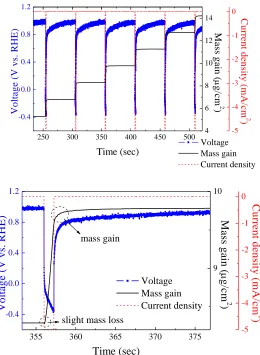
Figure 2. (a) The EQCM profiles from pulses #5~#9 for the Pt electrodeposition in Ar atmosphere (Ton
= 1 sec; Toff = 50 sec; current density = -5 mA/cm2). (b) The enlarged EQCM profile from a
To investigate the effect of dissolved oxygen in the electrolyte, we performed the EQCM experiments in deaerated bath. Fig. 2(a) displays the EQCM results from pulses #5~#9 for the Pt electrodeposition in Ar atmosphere. In general, the EQCM results were rather similar to those shown in Fig. 1(a). The OCV at Toff was 0.981 V (vs. RHE), and the potential experienced a sharp drop when
the current was turned on. Likewise, during Ton, a transient mass loss was observed followed by a
notable mass gain. Once the current was switched off, both the OCV and mass continued increasing and leveled off after 10 sec. Fig. 2(b) shows an enlargement of pulse #7 which revealed a similar pattern as that of Fig. 1(b).
303 306 309 312 315
-0.4 0.0 0.4 0.8 1.2 Air Ar V o lt a g e ( V v s. R H E ) Time (sec) -5 -4 -3 -2 -1 0 Current density C u rr e n t d e n si ty ( m A /c m 2 )
303 306 309 312 315
7 8 Air Ar C u rr e n t d e n si ty ( m A /c m 2 ) M a ss g a in ( g /c m 2 ) Time (sec) -5 -4 -3 -2 -1 0 Current density
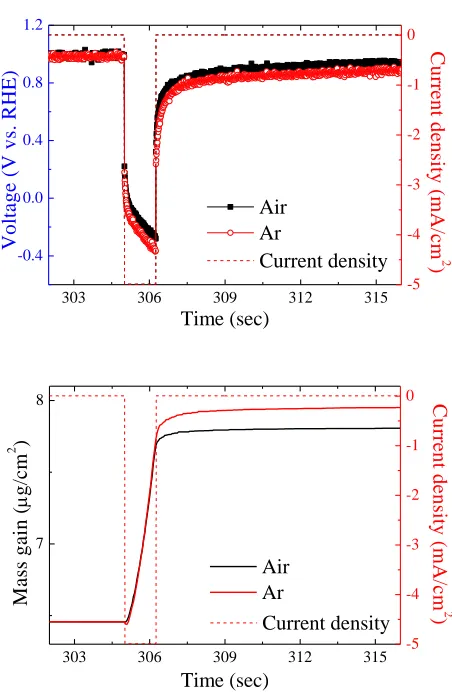
Figure 3. Comparison of EQCM profiles from pulse #7 in air and Ar atmospheres; (a) voltage vs. time, and (b) mass gain vs. time.
Fig. 3 provides the EQCM profiles in potentials and mass gains from the pulse #7 in both air and Ar atmospheres, respectively. As shown in Fig. 3(a), the OCVs during Toff in both samples
exhibited values of 0.981 V (vs. RHE), suggesting identical electrode/electrolyte structures. During Ton, their potentials revealed an instantaneous drop to 0.221 V, and became increasingly negative with
plating time. In a galvanostatic mode, the potential response can be explained by chronopotentiometric behavior in which the flux of PtCl62- at the electrode surface (x = 0) can be deduced at any given time
[image:7.596.181.407.232.578.2]
(1)
where the J0 is the flux of PtCl62- toward the working electrode, the D0 is the diffusion
coefficient of PtCl62- in the plating bath, the A is the microscopic area of the deposited Pt, the F is the
Faraday’s constant, and the i(t) is the input current. Because the i(t) was kept constant, the flux or the concentration gradient at the working electrode surface remained unchanged throughout the plating process. This behavior agreed well with the linear mass gain shown in Fig. 1(b) and Fig. 2(b).
The concentration of PtCl62- at the working electrode surface (C0(0,t)) can be obtained by the
following equation; [46]
(2)
where the is the bulk concentration of PtCl62-, and the t is the plating time. According to
equation (2), the C0(0,t) was expected to fall steadily with plating time. Because the mass increased
linearly during Ton, a constant deposition rate was anticipated. Therefore, the C0(0,t) did not fall to
zero; if the C0(0,t) did fall to zero, the potential was expected to drop significantly to a more negative
value in order to initiate an alternative reduction reaction. It is realized that the potential was related to the surface concentration of PtCl62-, as dictated by the Nernst equation. Because of the steady reduction
in the surface PtCl62- concentration as plating time progressed during Ton, the potential became
increasingly negative, a typical behavior known as concentration polarization. As shown in Fig. 3(a), the potential drop in air atmosphere was relatively smaller as compared to that in Ar atmosphere. This inferred that at any given time the surface concentration of PtCl62- in air atmosphere was higher. We
realized that in air atmosphere part of the reduction current was consumed by the ORR which was facilitated by the presence of freshly-deposited Pt. This led to a relatively slow decrease in the concentration of surface PtCl62-. The occurrence of ORR also reduced the coulombic efficiency and as
a result, rendered a smaller amount of Pt deposition in air atmosphere, as shown in Fig. 3(b). During the Toff, the OCV rose faster in air atmosphere because of the relatively abundant PtCl62- on the
surface. This produced a more positive potential as predicted by the Nernst equation.
0 3 6 9 12 15 18
0.0 0.3 0.6 0.9 1.2 1.5
M
a
ss
g
a
in
d
u
ri
n
g
T
on
(
g
/c
m
2 )
Air Ar
Pulse
M
a
ss
g
a
in
d
u
ri
n
g
T
o
ff (
g
/c
m
2
)
0.0 0.3 0.6 0.9 1.2 1.5
Air Ar
Figure 4. The amount of mass gain for 20 consecutive pulses during Ton and Toff in both air and Ar
[image:8.596.181.413.539.696.2]
Fig. 4 demonstrates the amount of mass gain for 20 consecutive pulses during Ton and Toff in
both air and Ar atmospheres, respectively. To cover the entire Au surface, the necessary Pt amount was 0.484 μg/cm2 for a monolayer of Pt (111). Therefore, from the mass gain during Ton, the Au surface
was fully covered by the Pt after the first pulse, which was consistent with the OCV observation during Toff. For both samples, the mass gains during Ton were much greater than those during Toff. In addition,
the mass gain during Ton in Ar atmosphere was consistently larger than that in air because the absence
of dissolved oxygen for the ORR in the latter case. On the other hand, the mass gain due to the adsorption of PtCl62- was larger in Ar atmosphere than that in air atmosphere. Except for the first few
pulses, the amount of mass gain during Ton for both samples exhibited a decreasing trend whereas the
mass gain due to the surface PtCl62- adsorption revealed an opposite pattern. We believed that an
increasing microscopic surface area of the Pt with increasing pulses allowed for more adsorption of PtCl62-. The adsorbed PtCl62- was subsequently reduced when the current was turned on, so the current
left for reducing the PtCl62- in the electrolyte became less and the amount of Pt deposit became smaller
with increasing pulses.
0 3 6 9 12 15 18
0 30 60
Air
Ar
C
o
u
lo
m
b
ic
e
ff
ic
ie
n
c
y
(
%
)
[image:9.596.129.449.348.603.2]Pulse
Figure 5. The coulombic efficiencies of Pt deposition during Ton for both air and Ar atmospheres.
Fig. 5 exhibits the coulombic efficiencies of Pt deposition during Ton for both air and Ar
PtCl62- to PtCl42-, and engaged in the parasitic hydrogen evolution reaction. It is noted that the PtCl42-
was not adsorbed on the working electrode and hence was not responsible for the mass loss during Ton.
4. CONCLUSION
The EQCM was utilized to study the events occurring during Ton and Toff in pulse current
electrodeposition of Pt. For both air and Ar atmospheres, during Ton, the EQCM profiles indicated a
transient mass loss, followed by a linear mass gain. The transient mass loss was caused by the reduction of the adsorbed PtCl62- whereas the linear mass gain was associated with the Pt plating from
the electrolyte. During Toff, the mass revealed a steady increase until it leveled off after 10 sec which
was due to the absorption of PtCl62- onto the freshly-deposited Pt surface. In air atmosphere, the
parasitic ORR reduced the Pt plating efficiency by 6%. In addition, smaller mass gains during Toff and
Ton were observed for the Pt plating in air atmosphere.
ACKNOWLEDGEMENT
This work was fully supported by the Taiwan Ministry of Science and Technology under grant numbers (MOST-104-2220-E-009-005), and in part by “Aim for the Top University Plan” of the National Chiao Tung University and Ministry of Education, Taiwan, R.O.C.
References
1. P. Mathew, J.P. Meyers, R. Srivastava, P. Strasser, Journal of the Electrochemical Society, 159 (2012) B554-B563.
2. F. Takasaki, S. Matsuie, Y. Takabatake, Z. Noda, A. Hayashi, Y. Shiratori, K. Ito, K. Sasaki, Journal of the Electrochemical Society, 158 (2011) B1270-B1275.
3. K.-W. Park, J.-H. Choi, B.-K. Kwon, S.-A. Lee, Y.-E. Sung, H.-Y. Ha, S.-A. Hong, H. Kim, A. Wieckowski, The Journal of Physical Chemistry B, 106 (2002) 1869-1877.
4. J. Solla-Gullon, F. Vidal-Iglesias, A. Lopez-Cudero, E. Garnier, J. Feliu, A. Aldaz, Physical Chemistry Chemical Physics, 10 (2008) 3689-3698.
5. J. Zhang, PEM fuel cell electrocatalysts and catalyst layers: fundamentals and applications, Springer, 2008.
6. M. Croissant, T. Napporn, J.-M. Léger, C. Lamy, Electrochimica Acta, 43 (1998) 2447-2457. 7. N. Marković, T. Schmidt, V. Stamenković, P. Ross, Fuel Cells, 1 (2001) 105-116.
8. C. Wang, H. Daimon, Y. Lee, J. Kim, S. Sun, Journal of the American Chemical Society, 129 (2007) 6974-6975.
9. J. Zhang, M.B. Vukmirovic, K. Sasaki, A.U. Nilekar, M. Mavrikakis, R.R. Adzic, Journal of the American Chemical Society, 127 (2005) 12480-12481.
10.K.M. Bratlie, H. Lee, K. Komvopoulos, P. Yang, G.A. Somorjai, Nano Letters, 7 (2007) 3097-3101. 11.R. Narayanan, M.A. El-Sayed, Journal of the American Chemical Society, 126 (2004) 7194-7195. 12.R. Narayanan, M.A. El-Sayed, Nano Letters, 4 (2004) 1343-1348.
13.S.D. Thompson, L.R. Jordan, M. Forsyth, Electrochimica Acta, 46 (2001) 1657-1663.
14.A. Mikhaylova, O. Khazova, V. Bagotzky, Journal of Electroanalytical Chemistry, 480 (2000) 225-232.
Journal of Electrochemical Science, 8 (2013) 2468-2478.
17.P. Dixit, J. Miao, Journal of the Electrochemical society, 153 (2006) G552-G559.
18.N. Qu, D. Zhu, K. Chan, W. Lei, Surface and Coatings Technology, 168 (2003) 123-128. 19.J. Zhu, S. Liu, O. Palchik, Y. Koltypin, A. Gedanken, Langmuir, 16 (2000) 6396-6399.
20.S.-S. Kim, Y.-C. Nah, Y.-Y. Noh, J. Jo, D.-Y. Kim, Electrochimica Acta, 51 (2006) 3814-3819. 21.J.A. Bennett, Y. Show, S. Wang, G.M. Swain, Journal of the Electrochemical society, 152 (2005)
E184-E192.
22.C. Chen, C. Wan, Journal of the Electrochemical society, 136 (1989) 2850-2855. 23.A. Arnau, Sensors, 8 (2008) 370-411.
24.D.A. Buttry, M.D. Ward, Chemical Reviews, 92 (1992) 1355-1379.
25.S. Nilsson, F. Björefors, N.D. Robinson, Applied Surface Science, 280 (2013) 783-790. 26.D. Wang, P. Mousavi, P.J. Hauser, W. Oxenham, C.S. Grant, Colloids and Surfaces A:
Physicochemical and Engineering Aspects, 268 (2005) 30-39.
27.D.Y. Ryu, M.L. Free, Journal of colloid and interface science, 264 (2003) 402-406.
28.A. StankeviČiu, K. Leinartas, G. BikulČius, D. VirbalytĖ, A. SudaviČius, E. Juzeliu, Journal of applied electrochemistry, 28 (1998) 89-95.
29.T.L. Knutson, W.H. Smyrl, Journal of the Electrochemical society, 154 (2007) B1095-B1099. 30.Y. Hussain, Y.-T. Wu, P.-J. Ampaw, C.S. Grant, The Journal of supercritical fluids, 42 (2007)
255-264.
31.K. Wang, H. Pickering, K. Weil, Electrochimica Acta, 46 (2001) 3835-3840.
32.M. Santos, D. Miwa, S. Machado, Electrochemistry communications, 2 (2000) 692-696. 33.H.-W. Lei, H. Uchida, M. Watanabe, Langmuir, 13 (1997) 3523-3528.
34.Z. Nováková, R. Oriňáková, A. Oriňák, P. Hvizdoš, A.S. Fedorková, International Journal of Electrochemical Science, 9 (2014) 3846-3863.
35.M.R. Deakin, D.A. Buttry, Analytical Chemistry, 61 (1989) 1147A-1154A. 36.Y. Liu, D. Gokcen, U. Bertocci, T.P. Moffat, Science, 338 (2012) 1327-1330.
37.H.-F. Waibel, M. Kleinert, L. Kibler, D. Kolb, Electrochimica Acta, 47 (2002) 1461-1467. 38.B. Gollas, J.M. Elliott, P.N. Bartlett, Electrochimica Acta, 45 (2000) 3711-3724.
39.K. Uosaki, S. Ye, Y. Oda, T. Haba, K.-i. Hamada, Langmuir, 13 (1997) 594-596. 40.T.-Y. Chiang, M.-C. Huang, C.-H. Tsai, Applied Surface Science, 308 (2014) 293-300.
41.A. Kishi, M. Inoue, S. Shironita, M. Umeda, Applied Surface Science, 258 (2012) 7497-7502. 42.K. Uosaki, S. Ye, H. Naohara, Y. Oda, T. Haba, T. Kondo, The Journal of Physical Chemistry B,
101 (1997) 7566-7572.
43.B. Conway, Progress in surface science, 49 (1995) 331-452.
44.H. Angerstein-Kozlowska, B. Conway, W. Sharp, Journal of Electroanalytical Chemistry and Interfacial Electrochemistry, 43 (1973) 9-36.
45.J. Nutariya, M. Fayette, N. Dimitrov, N. Vasiljevic, Electrochimica Acta, (2013). 46.A.J. Bard, L.R. Faulkner, (2001).