Int. J. Electrochem. Sci., 7 (2012) 8458 - 8467
International Journal of
ELECTROCHEMICAL
SCIENCE
www.electrochemsci.orgOptical Properties of CdSe Quantum Dots via Non-TOP based
Route
Nor Aliya Hamizi*, Mohd Rafie Johan
Advanced Materials Research Laboratory, Department of Mechanical Engineering, University of Malaya, 50603 Kuala Lumpur, Malaysia.
*
E-mail: [email protected]
Received: 19 March 2012 / Accepted: 18 July 2012 / Published: 1 September 2012
This work reports on the refractive index and permittivity of cadmium selenide quantum dots (CdSe QDs) synthesized without the use of trioctylphosphine (TOP). The transmittance, reflectance, extinction coefficient and permittivity values increase with QDs’ size. The refractive index is about 2.64 for CdSe QDs with crystallite sizes between 2.1-4.1 nm. The refractive index and absorbance is dependent on the real and imaginary parts of the dielectric constant respectively. The forbidden direct, allowed indirect and forbidden indirect band gap transitions are not present in the CdSe QDs synthesized via non-TOP based route.
Keywords: Semiconductors; nanostructures; chemical synthesis; optical properties
1. INTRODUCTION
knowledge has been obtained for the formation mechanism of CdSe QDs using this technique [8]. Furthermore, the cost of large-scale synthesis of CdSe QDs is very high for such expensive TOP solvents. Furthermore, TOP is hazardous, unstable and not environmentally friendly. Recently, a new method has been developed for the synthesis of CdSe QDs without TOP solvents [9-11]. The method is affordable, safer and produces CdSe QDs of high quality. Furthermore, the process can be operated in open atmosphere [12].
In this paper, CdSe QDs are synthesized using Inverse Micelle technique, and the size-dependent optical properties of CdSe QDs are reported.
2. EXPERIMENTAL
CdSe QDs were prepared using CdO and Se as precursors as reported [13]. 0.5 g of CdO, 25 ml of paraffin oil and 15 ml of oleic acid were loaded into a three-neck round bottom flask. The solution was heated to 160 C and stirred until the CdO was completely dissolved and a light yellow homogeneous solution was obtained. Following this, 0.079 g of Se in 50 ml of paraffin oil was carefully heated to 220 ºC with rapid stirring in another three-neck round bottom flask. The solution turned orange and then wine red. Following this, approximately 5 ml of Cd solution was injected swiftly into the Se solution during rapid stirring. The temperature dropped to 210 C immediately after injection, and then rose to 220 C. The temperature was maintained at 220 C for the growth of CdSe QDs for 46 min. Finally, the precipitate was isolated from the solvents and unreacted reagents via centrifugation, further washed with methanol several times and was dried in air at 50C.
The absorption spectra of each ripened sample were obtained using UVIKON 923 Double Beam UV-vis spectrophotometer.
3. RESULTS AND DISCUSSION
(1)
where , and represents the absorbance, transmittance and reflectance, respectively.
Figure 1. Transmission spectra of CdSe QDs synthesized by non-TOP routes at different reaction times: a) 0.2, b) 0.5, c) 1, d) 5, e) 16, f) 46 and g) 90 min
The reflectance of CdSe QDs synthesized via non-TOP based route was calculated from Equation (1) and presented in Fig. 2. The reflectance spectra represent the interference between the UV-rays which are reflected from the surface of QDs. It can be observed that the reflectance increases with reaction time and size of QDs. The reflectance spectra demonstrate that high reflectance occurs at a wavelength of 541, 544, 549, 580, 593, 625 and 646 nm for a reaction time of 0.2, 0.5, 1, 5, 16, 46 and 90 min, respectively.
The refractive index was determined from the reflectance data using Equation (2):
(2)
[image:3.596.133.468.147.480.2]Figure 2. Reflectance spectra of CdSe QDs synthesized by non-TOP routes at different reaction times: a) 0.2, b) 0.5, c) 1, d) 5, e) 16, f) 46 and g) 90 min
[image:4.596.161.438.67.352.2] [image:4.596.164.435.420.724.2]
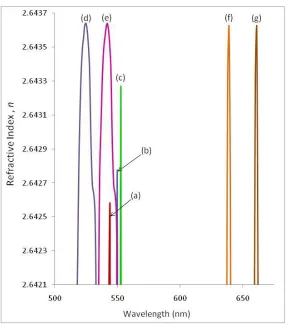
Figure 4. Refractive index for CdSe QDs synthesized by non-TOP routes at different reaction times: a) 0.2, b) 0.5, c) 1, d) 5, e) 16, f) 46 and g) 90 min at a smaller scale
[image:5.596.156.444.65.389.2]Figs. 3 and 4 show the refractive index with respect to the incident photon wavelength for non-TOP CdSe QDs. The increase in reaction time causes an overall shift in refractive index towards longer wavelengths, as shown in Fig. 3. This is due to the overall increase in reflectance with reaction time as reported by Zucolotto group [14] . However, the smaller scale in Fig. 4 shows a different perspective of the shifting behaviour. It is clear that the refractive index values increase for 0.2, 0.5, 1 and 5 min reaction times. However, the refractive index for 5, 16, 46 and 90 min CdSe QDs samples does not exhibit an apparent variation or increment.
Table 1. Refractive index values for CdSe QDs samples
Reaction time (min) Refractive index, n
0.2 2.6425
0.5 2.6427
1 2.6431
5 2.6436
16 2.6436
46 2.6436
Figure 5. Extinction coefficient for CdSe QDs at different reaction times: a) 0.2, b) 0.5, c) 1, d) 5, e) 16, f) 46 and g) 90 min
[image:6.596.180.417.78.372.2] [image:6.596.186.411.437.714.2]
Table 1 summarizes the refractive index values. The values can be explained by the definition of refractive index itself and by physical observations of the CdSe QDs.
Fig. 5 shows the extinction coefficient of CdSe QDs determined using Equation (3):
(3)
(4)
where is the extinction coefficient, is the absorption coefficient, is the incident photon wavelength, is the absorbance and is the crystallite size of CdSe QDs.
[image:7.596.163.436.325.658.2]The extinction coefficient values show a similar trend as the absorption spectra, as shown in Fig. 5. The extinction coefficient of CdSe QDs shifts towards longer wavelengths as the reaction time increases.
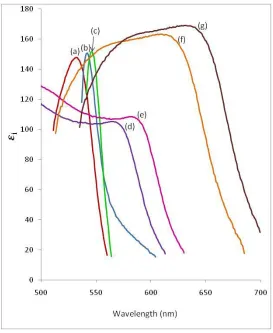
Figure 7. Imaginary dielectric constants for CdSe QDs synthesized by non-TOP routes at different reaction times: a) 0.2, b) 0.5, c) 1, d) 5, e) 16, f) 46 and g) 90 min
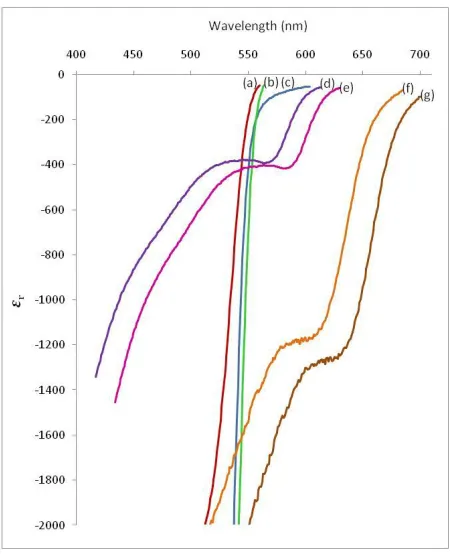
Fig. 6 exhibits the variations of the real part of the dielectric constant of CdSe QDs with respect to the incident photon wavelength.
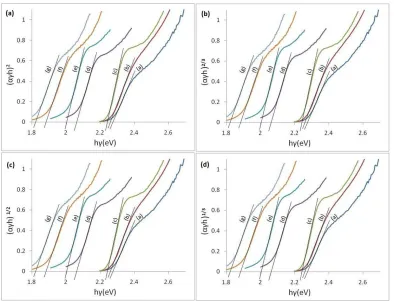
[image:8.596.63.534.547.763.2]Figure 8. Tauc plots of the synthesized CdSe QDs at different reaction times for: a) allowed direct, (b) forbidden direct, (c) allowed indirect and (d) forbidden indirect transitions
Table 2. Optical band gap obtained from Tauc’s plots (Fig. 8)
Reaction time (min)
Allowed direct
Forbidden direct
Allowed indirect
Forbidden indirect
Band gap (eV)
0.2 2.28 2.28 2.28 2.28
0.5 2.27 2.27 2.27 2.27
1 2.25 2.25 2.25 2.25
5 2.06 2.06 2.06 2.06
16 2.01 2.01 2.01 2.01
46 1.89 1.89 1.89 1.89
Theoretically, the real part of the dielectric constant is directly proportional to the refractive index. In Fig. 6, the calculated real dielectric constants show an overall red-shift with increasing reaction time, for values above -400. A sharp decrease in real dielectric constant values is observed below -400, whereby the samples having a reaction time of 46 and 90 min exhibit a decrease in real dielectric constant at shorter wavelengths, even lower than the 0.2 min sample. This is also observed in Figs. 3 and 4, whereby some portions of the 46 and 90 min spectra occur at shorter wavelengths. This proves that the refractive index is dependent on the real part of the dielectric constant.
Fig. 7 shows the imaginary part of the dielectric constant ( ) of CdSe QDs calculated using Equation (6):
(6)
Fig. 7 shows the variations in the imaginary part of the dielectric constant of CdSe QDs with respect to the incident photon wavelength. Theoretically, the imaginary part of the dielectric constant represents the absorbance. In Fig. 7, the calculated imaginary dielectric constants show an overall red-shift as the reaction time increases. This proves that the absorbance is dependent on the imaginary part of the dielectric constant.
It is noteworthy to note that the energy band gap of optical materials can occur in direct and indirect forms, which refers to the electron and holes concentration at the conduction and valence band [15]. Fig. 8(a) represents the allowed direct energy band gap using the Tauc’s theory. Figs. 8(b) – 8(c) were plotted in order to investigate the existence of forbidden direct, allowed indirect and forbidden indirect band gaps. It is observed in that a similar transition pattern is evident in each figure, which gives a similar value of energy band gap for all transitions as presented in Table 2. The band gap values are similar to the values of allowed direct transition. Therefore, it can be concluded that the forbidden direct, allowed indirect and forbidden indirect band gap transitions were not present in CdSe QDs synthesized via non-TOP based route.
4. CONCLUSIONS
The overall transmittance is observed to occur at longer wavelengths as the reaction time increases. A similar shifting behaviour is observed in the reflectance spectra. The refractive index calculated based on the reflectance data increases with reaction time. The extinction coefficient shows a similar behaviour as the absorption spectra. The calculated real dielectric constants are observed to be directly proportional to the refractive index and the calculated imaginary dielectric constants are directly proportional to the absorbance. The forbidden direct, allowed indirect and forbidden indirect band gap transitions were not present in CdSe QDs synthesized via non-TOP based route.
ACKNOWLEDGEMENT
PPP fund (No. PS079/2008C) and (PS115/2010A) and HIR grant (J-16006-73820).
References
1. L. Qu, X. Peng, J. Am. Chem. Soc. 124 (2001) 2049.
2. Y. Dongzhi, C. Qifan and X. Shukun, J. Lumin. 126 (2007) 853.
3. X.G. Peng, J. Wickham and A.P. Alivisatos, J. Am. Chem. Soc. 120 (1998) 5343.
4. X. P. Zhou, Z. Shao, Y. Kobayashi, X. Wang, N. Ohuchi, M. Taketa and A. Kasuya, J. Crystal Growth. 214/215 (2000) 752.
5. J.J. Zhu, O. Palchik, S. Chen and A. Gedanken, J. Phys. Chem. B. 104 (2000) 7344. 6. J. Hambrock, A. Birkner and R.A. Fischer, J. Mater. Chem. 11 (2001) 3197.
7. C.R. Bullen and P. Mulvaney, Nano Lett. 44 (2004) 2303.
8. D. Zhengtao, C. Li, T. Fangqiong and Z. Bingsuo, J. Phys. Chem. B. 109 (2005) 16671.
9. G.G. Yordanov, H. Yoshimura and C.D. Dushkin, Coll. Surf. A: Physicochem. Eng. Aspects. 322 (2008) 177.
10.H. Mao, J. Chen, J. Wang, Z. Li, N. Dai and Z. Zhu, Physica E. 27 (2005) 124.
11.T. Aichele, I.C. Robin, C. Bougerol, R. André, S. Tatarenko and G.V. Tendeloo, J. Cryst. Growth. 301, (2007) 281.
12.S.J. Rosenthal, J. Mcbride, S.J. Pennycook and L.C. Feldman, Surf. Sci. Rep. 62 (2007) 111. 13.N. A. Hamizi and M. R. Johan, Mat. Chem. Phys. 124 (2010) 395.
14.V. Zucolotto, K. M. Gattas-Asfura, T. Tumolo, A. C. Perinotto, P. A. Antunes, C. J. L.
Constantino, M. S. Baptista, R. M. Leblanc and O. N. Oliveira Jr., Appl. Surf. Sci. 246 (2005) 397-402.
15.S.K. Mehta, S. Chaudhary, S. Kumar, K.K. Bhasin, K. Torigoe, H. Sakai and M. Abe, Nanotechnology. 19 (2008) 295601-295612.