GROWING UP IN SCOTLAND:
ISBN: 978-1-78045-200-5 (web only)
The Scottish Government St Andrew’s House
Edinburgh EH1 3DG
Produced for the Scottish Government by APS Group Scotland DPPAS11601 (06/11)
Prepared for the Scottish Government: Children and Families Directorate by the Scottish Centre for Social Research
ACKNOWLEDGEMENTS
First and foremost, the author would like to thank all the families who have given up their time to take part in the study and have supported it continuously sweep by sweep.
The Growing Up in Scotland study is very much a collaborative venture. We owe a huge debt of gratitude to our colleagues in NatCen’s operations and computing departments and to our team of interviewers and supervisors for conducting the interviews with such dedication and professionalism.
I would also like to thank everyone involved in the preparation of this report – particularly John Curtice who provided advice on the analysis and Wendy van Rijswijk and
colleagues at the Scottish Government who provided feedback on early drafts.
1.4.1 The Growing Up in Scotland study 5
1.4.2 Measuring cognitive ability 5
1.5 Technical appendix 6
2 EXAMINING THE GAP IN COGNITIVE ABILITY 7
2.1 Introduction 8
2.2 Key findings 8
2.3 Differences in expressive vocabulary at ages 3 and 5 9
2.3.1 Age equivalent differences 11
2.3.2 Changes in the ability gap 12
2.4 Differences in problem solving ability at ages 3 and 5 12
2.4.1 Age equivalent differences 14
2.4.2 Changes in the ability gap 14
2.5 Income, education or social class? 15
2.6 Summary 17
3 FACTORS WHICH HELP OR HINDER IMPROVEMENT 20
3.1 Introduction 21
3.2 Key findings 22
3.3 Domains of influence on cognitive development 23
3.3.1 Demographic characteristics 23
3.3.2 Family composition 27
3.3.3 Parenting factors 29
3.3.4 Experience of childcare and pre-school 32
3.3.5 Child health and early development 35
3.3.6 Parenting support 39
3.3.7 Maternal health and health behaviours 42
3.3.8 Material and economic circumstances 45
3.4 Summary of single domain effects 48
3.5 Combined domain effects 49
3.5.1 Summary of combined domain effects 52
3.5.2 Explaining the effect of education on gaps in ability 52
4 DIFFERENT EFFECTS BY PARENTAL LEVEL OF EDUCATION 55
4.1 Introduction 56
4.2 Key findings 56
4.3 Education independent effects – to what degree? 58
4.3.1 Differences amongst those with higher qualifications 58
4.3.2 Differences amongst those with lower qualifications 59
4.4 Reducing the gap – are different factors important for children
with lower educated and higher educated parents? 60
5 CONCLUSION 63
5.1 Differences in cognitive ability by social background characteristics 64
5.2 Other factors affecting change in cognitive ability 64
5.3 Factors and associated policy responses which may help narrow
the gap in cognitive ability 66
REFERENCES 69 APPENDIX 1: FURTHER DETAILS OF EXPLANATORY AND OUTCOME
VARIABLES 74
Social background variables 75
v
This report examines changes in cognitive ability between the ages of 3 (34 months) and 5 (58 months) years amongst children with different social background characteristics and seeks to identify which circumstances and experiences contribute to the relative improvement of cognitive ability of children in lower (and higher) socio-economic groups in the pre-school period. In so doing, the report aims to identify factors which policy could usefully affect in order to maximise children’s cognitive ability ahead of entering school and help to narrow the considerable difference in ability between children from more and less advantaged circumstances.
The report aims to answer a number of distinct research questions:
• Does the gap in cognitive ability between children with different social background characteristics change between ages 3 and 5?
• Which factors help or hinder improvement in cognitive ability between ages 3 and 5?
• Are the factors which influence improvements in cognitive ability during the pre-school period different for children whose parents have lower levels of educational qualifications and those whose parents have higher level qualifications?
Examining the gap in cognitive ability
• Children from higher income households, those whose parents have higher
educational qualifications, and those with higher socio-economic classifications, have better vocabulary and problem solving scores, on average, at both ages than children whose parents have lower incomes, lower educational qualifications and are in lower socio-economic classifications.
• The largest differences in ability are between children whose parents have higher and lower educational qualifications. At age 5, compared with children whose parents have no qualifications, those with a degree-educated parent are around 18 months ahead on vocabulary and 13 months ahead on problem solving ability.
• The difference in vocabulary ability between children in the lowest and highest income groups reduced slightly between ages 3 and 5. The difference by social class did not change. The gap in vocabulary ability between those children in the lower and upper education groups widened in the pre-school period.
• The gap in problem solving ability by parental education and social class narrowed whilst differences in problem solving ability by income level widened.
• Of the three social background characteristics considered, parental level of education was most strongly associated with change in cognitive ability between ages 3 and 5. Children whose parents had higher qualifications were more likely to see their ability improve, relative to their peers, compared with those whose parents had
• A parent’s lack of educational qualifications appears to have a continuing detrimental effect on children’s vocabulary ability during the pre-school years. Children whose parents have lower qualifications have lower ability at age 3, and they are less likely to see an improvement in their ability during the pre-school period. This means that these children, who are already at a disadvantage, fall further behind their peers ahead of their entry to school. Other research suggests that those children who are developmentally behind at school entry will continue to stay behind.
Factors which help or hinder improvement
• Compared with children whose parents are degree-educated, those whose parents have no qualifications are more likely, amongst other things, to have younger mothers, live in lone parent families, experience lower levels of home learning activities and household rules, had a low birth weight, poorer general health, and a mother who smokes.
• Due to these characteristics also being associated with cognitive ability, some of these differences in circumstances and experiences of children from different educational backgrounds explain some of the education-related gaps in their cognitive ability.
Changes in vocabulary ability during the pre-school period were found to be more strongly related to aspects of the child’s home environment and the choices and behaviours of parents (such as frequency of reading to the child, and level of infant-maternal attachment), than external influencing factors such as pre-school education.
• After controlling for parental education level, greater consistency of parenting, stronger parent-child attachment, attendance at ante-natal classes and breastfeeding were each independently associated with a relative improvement in vocabulary ability in the pre-school years.
• Early language development is also important – those children who display better communicative skills at an earlier stage are more likely to see their skills improve during the pre-school period. It would appear generally beneficial therefore, to seek to improve children’s communication ability from the very earliest stages and establish better skills earlier in order to ensure continued positive language development.
Changes in problem solving ability during the pre-school period are related to parenting, the home environment and external factors like the type of pre-school the child attended.
• Attending a private nursery school for pre-school education and having some experience of primary school were both associated with positive development whereas not attending pre-school and living in an area in the most deprived quintile were associated with a relative decline in ability.
These factors present a complex picture of the numerous elements of children’s lives which, taken together, can influence their cognitive development. Influencing just one factor is unlikely to generate any change in children’s ability.
Were the effects different according to parental level of education?
Analysis was undertaken to examine whether the factors associated with change in ability identified above had different effects for children from lower educated households and those in higher educated households.
Vocabulary ability
• Lack of educational qualifications amongst younger mothers appears to be of less significance than a lack of qualifications amongst older mothers in respect of change in relative language ability. Rather than ‘doubling’ the negative effect, having a younger mother in the low qualifications group appeared to cancel out some of the negative impact of the lack of qualifications.
• The positive impact of infant-maternal attachment on improvement in relative language ability was specific to children whose parents have lower qualifications. This implies that the overall negative effect on cognitive development associated with a lack of parental qualifications can be limited somewhat by improving early infant-maternal attachment.
• The positive relationship between early communication skills and relative improvement in vocabulary between ages 3 and 5 was more pronounced for children whose
parents had no or lower qualifications. Thus, children from less educated
backgrounds whose relative vocabulary ability improves in the pre-school period are those who were already demonstrating more advanced communication skills at an earlier age. For children whose parents have no or lower qualifications, poor early communication skills will likely persist through the pre-school period with little or no relative improvement. In contrast, a lack of advanced early communication skills does not appear to necessarily prohibit later improvement in vocabulary for children in families where parents have higher qualifications.
• The positive effect of attendance at ante-natal classes on relative improvement of vocabulary applied equally to children in all educational groups. Thus ante-natal classes appear to have a ‘universal’ positive effect. However, it is possible that
attendance at ante-natal classes is measuring characteristics associated with a desire to be a good parent which are also beneficial to the improvement of vocabulary ability in the pre-school period. Thus, simply improving attendance at ante-natal classes alone is not likely to lead to improved cognitive ability.
Problem solving ability
• Experiencing a higher frequency of parent-child activities such as reading, drawing, and singing nursery rhymes at the ages of 2 and 3 has more benefit in respect of the relative improvement of problem solving ability for children whose parents have lower qualifications than for those who had higher qualifications. Increasing such activity for children from less educated backgrounds may therefore help to reduce the ability gap.
• None of the remaining factors associated with change in problem solving ability – attending a private pre-school, starting primary school, being breastfed and living in an area in the most deprived quintile – showed different effects for children in lower and higher educational groups.
Conclusion
The level of parents’ educational qualifications is both a driver of overall changes in child cognitive ability at age 3 and age 5, and of change in cognitive ability for individual children in the pre-school period. However, some of these differences are accounted for by variations in other aspects of the lives of children from lower and higher educational groups. The findings suggest that by influencing some of these other factors, the education gaps in cognitive ability may be somewhat reduced.
The factors which showed some potential in this respect were associated with aspects of the child’s home environment and the choices and behaviours of their parents – factors which are traditionally more difficult for policy to affect than more external, service-based influences such as pre-school and primary school education. However, external
ix
The factors that mattered for supporting child development were different for parents with lower and parents with higher educational qualifications. This suggests that universal policies which seek to improve children’s cognitive ability and school readiness in the pre-school period will not benefit all children equally.
The mix of family and institution effects for lower and higher educated parents suggests that any strategies aimed at improving school readiness via the pre-school setting will require, for more disadvantaged children, a parallel strand which seeks to influence the child’s home environment and parenting experiences. This confirms findings from Geddes et al (2010) who, in their review of interventions designed to improve school readiness, found that the most successful interventions utilised a mixed (centre and home-based), two generation (child and parents) approach. To ensure that children’s cognitive ability is maximised in the pre-school period, our findings suggest that, in the home, such strategies should focus on the quality of the parent-child relationship and the frequency of home learning activities.
1
1.1 Background
Analysis in this report examines differences in cognitive ability at age 3 and 5 years amongst children with different social background characteristics and seeks to identify which circumstances and experiences contribute to change in the cognitive ability of children in lower (and higher) socio-economic groups in the pre-school period. In so doing, the report aims to identify factors which policy could usefully affect in order to maximise children’s cognitive ability ahead of entering school and help narrow the considerable difference in ability between children from more and less advantaged circumstances.
To date, research from the Growing Up in Scotland (GUS) study has demonstrated stark variation in cognitive ability at age 3 amongst children from different backgrounds. Bromley (2009) found that children from less advantaged families were outperformed by their more affluent counterparts and noted worse ability in particular amongst boys, children with younger mothers, those from lone parent families, children with early
developmental difficulties and those with a low birth weight. Bradshaw and Wasoff (2009) further revealed a relationship between early experience of childcare and cognitive ability, with children who experienced between 17 and 40 hours of non-parental childcare a week shown to have better vocabulary acquisition at age 3. Considerable other research has linked childcare and pre-school experiences to cognitive ability, indicating, for
example, that as compared to no experience of centre-based care or pre-school education, children with any experience tend to have improved language and cognitive skills (Sylva, 2009; Butt et al, 2007; Magnuson et al, 2010). The quality of provision is the key element of the care and pre-school experience associated with making the greatest impact on on intellectual and cognitive development (Sylva et al, 2009). Experiences in the home are also important, as analysis from GUS has shown. Both Bromley (2009) and Melhuish (2010) have demonstrated a positive relationship between the amount of home learning activities a child experiences and their level of cognitive ability. In other analysis poor maternal mental health and experience of poverty have been linked to lower cognitive scores (Marryat and Martin, 2010; Barnes et al, 2010).
children in the lowest and highest income groups, did not demonstrate any significant widening of the ability gap between these groups of children in that specific period, contrary to Feinstein’s earlier data, but neither did they show that the gap narrowed.
These, and other studies, demonstrate clearly that the relationship between social background and cognitive development is present at pre-school age (see also Denton, West and Walston, 2003) and even before (McCall 1981). Crucially, long-term analysis of cognitive development and attainment from birth, through pre-school into school and beyond suggests that children’s movement between ability groups slows on entering school. Feinstein (2000) found that assessment scores at 60 months were more closely related to educational qualifications at age 26 than were earlier scores. Such evidence has led a number of authors to conclude that patterns of cognitive development and attainment are more difficult to change once children enter school (Heckman and Wax, 2004; see also evidence from CECD and Mustard in Haw, 2010). Other evidence demonstrates the potential long-term benefits of narrowing the early ability gap on, for example, reducing inequalities in final educational attainment or labour market
participation (Feinstein, 2000; Heckman et al, 2006; Sinclair, 2007). Combined, these findings highlight the important role that experiences and development during the early years have on later educational achievement and suggest that more should be done to maximise the improvement of children’s development before they enter school, including in the immediate pre-school period.
The theme of early intervention has been a prominent feature of much recent UK and Scottish Government policy. In Scotland, the National Performance Framework, which has underpinned and provided focus to all policy development since 2007, has as one of its national outcomes that “children should have the best start in life and are ready to succeed”. To achieve this, each of the three policy frameworks – Achieving Our Potential, Equally Well and the Early Years Framework – acknowledge the importance of early intervention and the improvement of children’s circumstances in the early years in order to benefit them in later life. The particular economic benefits of early intervention to Scotland’s public spending have also recently been explored (Finance Committee of the Scottish Parliament, 2011; Scottish Government, 2010a). The preventative spending enquiry led by the Scottish Parliament’s Finance Committee examined how public spending could be focussed more on preventing negative outcomes than dealing with them when they occur. In written evidence to the enquiry, the Scottish Government noted that preventative action was “integral to the approach to government in Scotland and delivering the outcomes set out in the National Performance Framework” (Scottish Government, 2010). Similar policy moves are also evident in the UK Government
3
Data from the Growing Up in Scotland study (GUS) offers the potential to present a detailed exploration of changes in children’s cognitive ability – more specifically their knowledge of vocabulary and skills in non-verbal reasoning – between the ages of 3 and 5 and to identify the factors associated with different directions and magnitudes of
change for different groups of children, adding to the existing evidence referenced above. The existing analysis of GUS data on this topic has focused on cognitive ability at a single time point – age 3 (34 months) and the child’s circumstances and experiences prior to that. The same cognitive assessments were more recently repeated at the fifth sweep of fieldwork, when the children were aged 5 (58 months). Using these two sets of data, this research will explore change in cognitive ability between the ages of 3 and 5 and examine, in particular, the extent to which early gaps in ability by children’s social background remain, reduce or increase in this period.
A key aim of this report is to identify which circumstances and experiences contribute to the improvement of cognitive ability of children in lower (and higher) SES groups in the pre-school period. The results will allow policy to focus on improving those
circumstances and experiences in order to maximise children’s cognitive ability ahead of entering school in a period shown, in the longer-term research cited above, to be crucial to children’s outcomes in adulthood. The pre-school period presents a unique
opportunity for policy to make an impact on children’s lives via statutory pre-school education. Evidence from GUS (Bradshaw et al, 2009) and from Scottish Government statistics (Scottish Government, 2010) suggests that over 95% of children eligible for a pre-school place take-up that place. Understanding better the factors which inhibit and which improve children’s cognitive ability during this time will permit the provision of services and support to maximise children’s ability ahead of school entry. In so doing, outcomes for children in these domains will not only improve throughout their school career but also beyond, in their transitions to further education and employment.
1.2 Adding to the evidence base
This report will go beyond the existing analysis of BCS 1970 and MCS data by
investigating which factors, in addition to indicators of social background – such as child health, parenting behaviours and area deprivation - impact on changes in cognitive development between the ages of 3 and 5. The focus of much work in this area has been on differences observed by household income and social class1 (Blanden and
Machin, 2010; Feinstein, 2003; Waldfogel and Washbrook, 2010). For example, recent analysis of MCS data (Blanden and Machin, 2010) suggested that there was little change in the size of the ability gap between children in lower and higher income households between ages 3 and 5, and further that average scores amongst children in the lowest income groups had not declined during the period considered. This was cautiously
1 Although Cullis and Hansen (2008) consider other factors which influence cognitive ability at age 5, including maternal
offered as a small, but positive improvement for that group. As this report will show, GUS data, whilst detecting only a small amount of change in the income ability gap, suggests that gap narrows during the pre-school period with children in all income groups showing a relative improvement in scores, but particularly those in the lowest income group. This contrasts with change across income groups in relation to problem solving ability, where a slight increase in the ability gap is evident. Whilst household income and social class will be considered initially, the analysis of ability gaps in this report will centre on differences by level of parental education.
In addition, whereas only data on vocabulary acquisition has been considered in the previous analyses, the GUS analysis will also examine changes in problem solving ability (non-verbal reasoning). The analyses in this report suggest that the variations in ability observed by level of parental education are quite different to those associated with income. Our findings suggest that lack of parental qualifications has a continuing detrimental effect on children’s vocabulary ability during the pre-school years seeing those children fall further behind their peers ahead of their entry to school.
1.3 Research questions
This report aims to answer a number of distinct research questions:
• Does the gap in cognitive ability between children with different social background characteristics change between ages 3 and 5?
• Which factors help or hinder improvement in cognitive ability between ages 3 and 5?
• Are the factors which influence improvements in cognitive ability during the pre-school period different for children whose parents have lower levels of educational qualifications and those whose parents have higher level qualifications?
Initial analysis will look simply at the difference in cognitive ability at ages 3 and 5 between children with different social backgrounds. Social background characteristics considered will include parental education, annual household equivalised income and socio-economic classification. Comparison of average scores on each of the
assessments for children in each of the groups is undertaken to demonstrate broad differences in ability, and to identify any changes in the magnitude of those differences at an overall level.
5
The final analytical stage examines whether the impact of key factors on pre-school cognitive development are stronger or weaker for children with degree educated parents compared with those whose parents have lower or no qualifications or whether there is no difference in effects at all between children in each group.
1.4 Methods
1.4.1 The Growing Up in Scotland study
The analysis in this report uses information from families in the birth cohort that took part in all of the first five sweeps of GUS (n = 3621)3. Some families who initially took part
in GUS did not do so for all of the subsequent sweeps. There are a number of reasons why respondents drop out from longitudinal surveys and such attrition is not random. All of the statistics have been weighted by a specially constructed longitudinal weight to adjust for non-response and sample selection. Both weighted and unweighted sample sizes are given in each table. Standard errors have been adjusted to take account of the cluster sampling4.
At each sweep/year of fieldwork, interviews took place around six weeks before the child’s next birthday, therefore in the first year of the study, children were 10 months old, in the second year they were 22 months old and so on. For the purposes of this report, beyond the first interview, the child’s age will be referred to in years. It is worth bearing in mind however that a 3-year-old child at sweep 3 for example, is actually 34 months old or just under 3, and a 5-year-old child at sweep 5 is actually 58 months old or just under 5.
1.4.2 Measuring cognitive ability
Cognitive ability was measured in the GUS birth cohort via two assessments: the naming vocabulary and picture similarities subtests of the British Ability Scales Second Edition (BASII). These two assessments measure, respectively, language development and problem solving skills. Each subtest is part of a cognitive assessment battery designed for children aged between 2 years and 6 months and 17 years and 11 months. The assessments are individually administered. Numerous tests of ability and intelligence exist but the BAS is particularly suitable for administration in a social survey like GUS.
The naming vocabulary assessment measures a child’s language development. The test requires the child to name a series of pictures of everyday items and assesses the expressive language ability of children. The picture similarities assessment measures a child’s problem solving ability (or non-verbal reasoning). In the assessment children are
3 Further information on the design, development and future of the project is available from the study website:
www.growingupinscotland.org.uk
4 The GUS sample is generated in two stages. The first stage randomly selects geographic areas or clusters, the
shown a row of four pictures on a page. They are asked to place a free-standing card with a fifth picture underneath the picture with which the card shares a similar element or concept. There are 36 items in total in the naming vocabulary assessment and 33 items in the picture similarities assessment. However, to reduce burden and to avoid children being upset by the experience of repeatedly failing items within the scale, the number of items administered to each child is dependent on their performance. For example, one of the criteria for terminating the naming vocabulary assessment is if five successive items are answered incorrectly.
Children in the birth cohort have been asked to complete the same two assessments at two different sweeps of data collection: sweep 3, when they were aged 3 years old (34 months) and sweep 5, when they were aged 5 years old (58 months). As such, the assessment scores offer a snapshot of children’s ability in expressive vocabulary and problem solving, first a little ahead of their entry to pre-school education, and second around the time they start primary school.
As children age, their expected rate of development and their expected ability level also changes. As such, the assessments alter slightly with a different item range used at age 5 as compared with age 3. Furthermore, ability scores at age 5 tend to be higher across the board than scores at age 3. As a result, the basic, raw ‘ability’ score generated from the assessment cannot be compared across time as a child’s ability will usually improve with age as a matter of course, and the rate of improvement will differ at different ages (being generally faster at younger ages). In order to examine whether a child’s ability relative to his or her peers changes over time therefore, the ability score from each age point was standardised into a z-score. Z-scores are derived from the survey data, they count the number of standard deviations5 from the score mean and have a mean of zero.
Therefore a child with a z-score of zero at either age 3 or 5 has an average ability across all children in that age group. Those with a z-score greater than zero scored above average and those with a score of less than zero scored below average. By using the standardised scores it is possible to compare ability at age 3 and 5 and to consider whether children who scored above, below or about average at age 3 continued to do so at age 5.
1.5 Technical Appendix
Readers interested in the details of the analyses should consult the Technical Appendix
2.1 Introduction
This section will consider the difference in cognitive ability between children in different social groups at age 3 and age 5. Differences in ability are considered according to parents’ level of education6, annual household equivalised income and parental
socio-economic classification (NS-SEC7). The gap in average scores between children in
different groups will be defined with the size of the gap compared at both time points. In so doing, it is possible to indicate whether known differences in cognitive ability at age 3 persist as children get older and whether the gap in ability increases, decreases or remains stable over time. The effect of other factors will be considered in chapter 3.
2.2 Key findings
• Children in higher income households, those whose parents have higher educational qualifications, and those with higher socio-economic classifications, on average, have better vocabulary and problem solving scores at both ages than children whose parents have lower incomes, lower educational qualifications and are in lower socio-economic classifications.
• The largest differences in ability are between children whose parents have higher and lower educational qualifications. At age 5, compared with children whose parents have no qualifications, those with a degree-educated parent are around 18 months ahead on vocabulary and 13 months ahead on problem solving ability.
• The gap in vocabulary ability between those children in the lower and upper education groups widened between ages 3 and 5 whereas the difference in vocabulary ability between children in the lowest and highest income groups reduced slightly and the difference by social class did not change.
• The gap in problem solving ability by parental education and social class narrowed whilst differences in problem solving ability by income level widened.
• Of the three social background characteristics considered, parental level of education was most strongly associated with change in cognitive ability between ages 3 and 5. The largest change in size of the ability gap for all children was in relation to differences in education and children whose parents had higher qualifications were more likely to see their relative ability improve in the period than those whose parents had no qualifications.
6 This is measured as the highest educational qualification achieved by any of the child’s parents who are resident in
the household.
9
• Lack of parental qualifications appears to have a continuing detrimental effect on children’s vocabulary ability during the pre-school years. Children whose parents have lower qualifications have lower ability at age 3 and are less likely to see a improvement in their ability, when compared to their peers, during the pre-school period meaning that they fall further behind other children ahead of their entry to school where, other research suggests, they will continue to do so.
2.3 Differences in expressive vocabulary at ages 3 and 5
Figure 2-A to Figure 2-C display the mean standardised vocabulary ability scores at 3 and 5 years by household equivalised income, parental level of education, and parental socio-economic classification. In each graph, the horizontal line with the value ‘0’ represents the mean score for all children in Scotland at the respective age. The bar in the furthest right position illustrates the difference in mean scores between the top and bottom groups – that is, the size of the ability gap (measured in standard deviations). For example, in Figure 2-A, this bar indicates that the mean vocabulary score for children in the lowest income group is 0.77 standard deviations below the mean score for children in the highest income group. In addition, the bar for the lowest income group (at the very left-hand side of the graph) indicates that, on average, those children scored 0.5
standard deviations below the average score for all children.
Irrespective of the particular characteristic considered, the graphs clearly indicate the difference in knowledge of vocabulary by the child’s social background. Children in higher income households, those whose parents have higher educational qualifications, and those with higher socio-economic classifications, on average, have better vocabulary scores at each age than children whose parents have lower incomes, lower educational qualifications and are in lower socio-economic classifications.
Figure 2-A Mean standardised vocabulary ability score by equivalised household income
Age 3 Age 5
-0.5 -0.13 0.05 0.17 0.27 -0.77 -1 -0.8 -0.6 -0.4 -0.2 0 0.2 0.4 S tandar d de v iati ons -0.45 -0.1 0.06 0.2 0.28 -0.73 -1 -0.8 -0.6 -0.4 -0.2 0 0.2 0.4 S tandar d dev ia tions
[image:23.595.78.487.486.743.2]Lowest income 2 3 4 Highest income Difference between highest and lowest
Figure 2-B Mean standardised vocabulary ability score by parents’ level
of education
Age 3 Age 5
No qualifications Lower Standard Grades or VQs or Other Upper level SGs or Intermediate VQs Higher grades and upper level VQs Degree level academic and vocational qualifications Difference between degree and no quals
11
Figure 2-C Mean standardised vocabulary ability score by parental
NS-SEC
Age 3 Age 5
Routine/Semi-routine Lower supervisory Small employers and own account workers Intermediate occupations
Managerial/professional Difference between managerial and routine
-0.43 -0.24 -0.3 -0.03 0.16 -0.59 -1 -0.8 -0.6 -0.4 -0.2 0 0.2 0.4 S tandar d dev ia tions -0.42 -0.31 -0.22 -0.01 0.18 -0.6 -1 -0.8 -0.6 -0.4 -0.2 0 0.2 0.4 S tandar d dev ia tions
2.3.1 Age equivalent differences
The use of standardised scores, whilst necessary to compare changes over time, makes it difficult to comprehend the actual size of these differences in developmental terms. To allow a better, although cautious, understanding of this it is possible to report the difference in average scores as an ‘age equivalent’ based on the progress which would be expected of a typical child at the respective age. Calculations undertaken and published by researchers on the Millennium Cohort Study (Hansen, 2008) provide such monthly estimates8.
Based on these estimates, at age 5, children with a degree educated parent have a vocabulary ability around 6 months ahead of the average level obtained by GUS children at 5 years and around 18 months ahead of those whose parents have no qualifications, who are therefore around 12 months behind the average ability.
Compared with children in the lowest income group, those in the highest income group were around 13 months ahead in their knowledge of vocabulary. Finally, children from managerial and professional households were approximately 11 months ahead on vocabulary when compared with children whose parents had routine or semi-routine occupations. This again illustrates that the largest gaps occur according parental level of education.
8 The method used by MCS researchers uses differences at the median, averaged across a range of ages. The resulting
2.3.2 Changes in the ability gap
As noted above, the very right-hand bar in Figure 2-A to Figure 2-C displays the
difference in mean scores between the top and bottom groups. In other words, this bar illustrates the size of the ability gap. By comparing this figure at both time points it is possible to infer whether the gap has decreased or increased over time.
The ability gap by parental level of education increases, there is a slight reduction in the gap between the lowest and highest income groups and there is virtually no change in the gap between children in routine or semi-routine households and those in managerial or professional households.
The gap between the lowest and highest education groups increases over time by 0.1 standard deviations. At age 3, children whose parents had no qualifications on average scored 0.78 standard deviations below children with a degree educated parent. By age 5, this difference had increased to 0.88 standard deviations. This overall increase in the gap is caused both by a drop in the average scores for the lowest education group (moving from -0.56 at age 3 to -0.62 at age 5) and an increase in scores for the highest education group (moving from 0.23 at age 3 to 0.27 at age 5).
Scores improve generally for children in all income groups. The reduction in the gap results predominantly from the scores of children in the lowest group increasing to a greater degree than those in the highest income group.
2.4 Differences in problem solving ability at ages 3 and 5
Figure 2-D to Figure 2-F display the mean standardised problem solving scores at age 3 and at age 5 by household equivalised income, parental level of education, and parental socio-economic classification. As before, the bar in the furthest right position in each graph displays the difference in mean scores between the top and bottom groups – the size of the ability gap.
The trends observed in relation to problem solving ability are similar to those seen for the vocabulary scores. Across each background measure, children in the most
disadvantaged groups score lowest and those in the most advantaged groups score highest, with relative scores increasing as levels of income, education and socio-economic classification increase.
13
maximum 0.73 standard deviations between those in the lowest and highest income households. The magnitude of differences observed by parental education and level of household income are quite similar at around 0.7 standard deviations between the top and bottom groups at both time points.
Figure 2-D Mean standardised problem solving score by equivalised household
income
Age 3 Age 5
-0.45 -0.05 0.05 0.170.24 -0.69 -1 -0.8 -0.6 -0.4 -0.2 0 0.2 0.4 S tandar d dev ia tions -0.45 -0.1 0.06 0.2 0.28 -0.73 -1 -0.8 -0.6 -0.4 -0.2 0 0.2 0.4 S tandar d dev ia tions
[image:26.595.107.515.303.511.2]Lowest income 2 3 4 Highest income Difference between highest and lowest
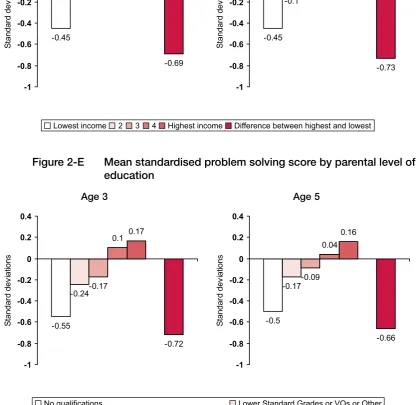
Figure 2-E Mean standardised problem solving score by parental level of
education
Age 3 Age 5
No qualifications Lower Standard Grades or VQs or Other Upper level SGs or Intermediate VQs Higher grades and upper level VQs Degree level academic and vocational qualifications Difference between degree and no quals
[image:26.595.103.520.389.794.2]Figure 2-F Mean standardised problem solving score by household NS-SEC
Age 3 Age 5
Routine/Semi-routine Lower supervisory Small employers and own account workers Intermediate occupations
Managerial/professional Difference between managerial and routine
S
tandar
d dev
ia
tions
-0.4 -0.12
-0.2 0.01
0.13
-0.53
-1 -0.8 -0.6 -0.4 -0.2 0 0.2 0.4
-0.2 -0.3
-0.1
0.1
-0.3 0
-1 -0.8 -0.6 -0.4 -0.2 0 0.2 0.4
S
tandar
d dev
ia
tions
2.4.1 Age equivalent differences
Again, estimates (based on MCS research) allow the consideration of age equivalent differences based on the expected progress of an average child around the respective assessment age.
These estimates suggest that, at age 5, age equivalent differences between children in the most and least advantaged groups are a little narrower for problem solving ability than for knowledge of vocabulary, although they are still considerable. Children whose parents have no qualifications had an average score which placed them around 10 months behind the average ability and 13 months behind those with a degree educated parent. Compared with children in the highest income group those in the lowest income group were around 10 months behind in their problem solving ability (compared with 13 months difference in vocabulary). Finally, children whose parents had routine or semi-routine occupations, when compared with children from managerial and professional households, were approximately 6 months behind on problem solving (compared with 11 months behind on vocabulary).
2.4.2 Changes in the ability gap
15
The ability gap by parental level of education decreases, there is a slight increase in the gap between the lowest and highest income groups and there is a notable decrease in the gap between children in routine or semi-routine households and those in managerial or professional households.
The gap in ability by household income increases slightly from 0.69 to 0.73 standard deviations. This change results from an increase in average scores amongst children in the highest group – there is no change in scores amongst children from the lowest income group. Differences by parental level of education decrease from 0.72 to 0.66 standard deviations. This decrease occurs via an improvement in scores amongst children whose parents have no qualifications (from -0.55 to -0.50) and a slight
downward movement in scores amongst the degree-educated group (from 0.17 to 0.16). The largest change is in relation to socio-economic classification where the gap reduces considerably from 0.53 to 0.30 standard deviations. The majority of this change is realised through a considerable improvement in scores amongst children in the routine/ semi-routine group where scores increase from 0.40 standard deviations below the mean to 0.20. There is also a slight decrease in scores at the top end from 0.13 to 0.10.
2.5 Income, education or social class?
There is some overlap between which people belong to the various social background categories considered thus far; families where parents are more highly educated are more likely to have higher incomes and to be in managerial or professional occupations. The analysis undertaken thus far does not identify whether each characteristic impacts on children’s ability independently of the other characteristics. For example, it is unclear whether the changes observed by socio-economic classification have occurred simply due to the fact that managerial and professional parents are more likely to be degree-educated, or to have higher incomes.
Analysis was used to determine which characteristics are related to positive and negative individual level change9 in relative ability on each assessment when holding the other,
potentially confounding, characteristics constant.10 The results of this analysis indicate,
irrespective of the child’s ability score at age 3 (thus whether or not they had a low, average or high score at that time), which factors are associated with a relative improvement or decline in ability during the pre-school period. The results are summarised in Table 2.111.
9 That is, change in ability at the level of an individual child rather than change at an overall group level.
10 The statistical analysis and approach used in this report represents one of many available techniques capable of exploring this data. Other analytical approaches may produce different results from those reported here. A description of the analysis is included in the technical appendix.
Parental level of education was the only characteristic which was associated with individual level change in relation to both assessments. When compared to children whose parents had no qualifications, those whose parents had passes at Standard Grade, Higher Grade, or a qualification at degree level, were more likely to improve on their relative ability during the pre-school period. Whilst significantly associated with relative improvements in both types of ability, the relationship between education and problem solving ability was weaker and only those children whose parents had Higher Grades or above were more likely to improve their relative score more so than those in the no qualifications group.
Household income was also significantly associated with change in vocabulary ability. Children in higher income households at the third quintile or above were more likely than those in the lowest income group to show improvement in vocabulary in the pre-school period.
Socio-economic classification was not significant in either model suggesting that the changes in the ability gap observed in relation to this variable in section 2.4.2 appear to be explained largely by differences in income and education.
17
Table 2.1 Statistical significance of independent associations between
selected social background characteristics and change in cognitive ability between ages 3 and 5
Social background characteristic Cognitive ability
Knowledge of vocabulary Problem solving
Household equivalised income
(ref: lowest income quintile) Sig.*
Direction of
change** Sig.*
Direction of change** 2nd Quintile (>=£11,875<£19,444) NS NS
3rd Quintile (>=£19,444<£25,625) <.05 + NS 4th Quintile (>=£25,625<£37,500) <.01 + NS Top Quintile (>=£37,500) <.05 + NS
Parental level of education
(ref: no qualifications)
Lower SGs or VQs or ‘Other’ quals NS NS Upper level SGs or Intermediate VQs <.01 + NS
Higher Grades or upper level VQs <.05 + <.05 + Degree level academic or VQs <.001 + <.05 +
Household socio-economic classification
(ref: routine/semi-routine)
Lower supervisory NS NS Small Emps and Own Account NS NS Intermediate NS NS Managerial/professional NS NS
Weighted base 3133 3130
*Statistical significance is presented either as ‘Not Significant’ (NS) or at three levels of ‘confidence’ – 95% (<.05), 99% (<.01) or 99.9% (<.001). All figures quoted in this report have an associated margin of error, due to the fact that they are estimates based on only a sample of children, rather than all children. This margin can be estimated for each figure. For a figure which has a significance value (or p-value) of <.05 or 95%, this indicates that there is a 95% chance that the true value across all children in the subgroup (as opposed to just those in the sample) falls within the margin. Thus a lower significance value (of <0.1 or <0.01) indicates a lower margin of error and a greater chance that the figure or relationship presented in the report occurs within the population.
**A plus sign (+) indicates relative improvement in ability score and a minus sign (-) indicates relative decline in ability score for children in the various sub-groups as compared those in the reference sub-group. The reference sub-group is indicated in brackets. Where the variable is not significant, direction of change has not been included.
2.6 Summary
In relation to the first research question posed by this report – whether the gap in cognitive ability between children from different social backgrounds changes between ages 3 and 5 – the answer is yes. However, the size and direction of the change varies according to the particular background characteristic considered and the ability being assessed.
Washbrook, 2010). Recent analysis of MCS data (Blanden and Machin, 2010) suggested that there was little change in the size of the gap in vocabulary ability between children in lower and higher income households between ages 3 and 5, and further that average scores amongst children in the lowest income groups had not declined during the period considered. This was interpreted as a small, but positive improvement for that group.
The analysis here did show change in the ability gap between children in different groups:
• For vocabulary, the ability gap by parental level of education increases, there is a slight reduction in the gap between the lowest and highest income groups and there is virtually no change in the gap between children in routine or semi-routine households and those in managerial or professional households.
• For problem solving, the ability gap by parental level of education decreases, there is a slight increase in the gap between the lowest and highest income groups and there is a notable decrease in the gap between children in routine or semi-routine households and those in managerial or professional households.
The GUS data shows a slight reduction in the ability gap by household income during the pre-school period. Whilst children in all income groups show a relative improvement in scores, there is a particular improvement in the average scores for children in the lowest income group. This contrasts with change across income groups in relation to problem solving ability, where a slight increase in the ability gap is evident.
The variations in ability observed by level of parental education are quite different. Our findings suggest that lack of parental qualifications has a continuing detrimental effect on children’s vocabulary ability during the pre-school years; children from lower educated households, already likely to have poorer ability at age 3, fall further behind their peers ahead of their entry to school. Other research suggests (Feinstein, 2000; Heckman and Wax, 2004) they will continue to fall further behind after entering school. In contrast, those children with a degree educated parent improve on their position, moving further ahead than the average child, and considerably further from those whose parents have no qualifications. This effect is not observed in relation to problem solving ability. Indeed, the gap in problem solving ability between children in the lowest and highest educational groups reduces slightly in the pre-school period.
19
Earlier research using GUS data on children’s cognitive ability at age 3 (Bromley, 2009) showed that other factors in a child’s circumstances and environment can mediate the very strong effects of parental education on cognitive ability. These other factors
21
3.1 Introduction
Children who differ according to the level of their parents’ education also differ in a range of other ways such as their family characteristics, living circumstances and their
experience of parenting behaviours. Many of the dimensions along which these families differ are also known to impact on children’s early cognitive ability (Washbrook and Waldfogel, 2010). It is not possible to assume, therefore, that improving educational qualifications amongst parents alone would close all or most of the education-related gaps in cognitive ability because some of those gaps are created by the different experiences of children whose parents have different levels of education. For example, better vocabulary ability amongst children with degree-educated parents is known to be, at least in part, a function of higher levels of parent-child reading amongst these parents. Thus, improving vocabulary ability could require increasing parent-child reading as well as improving parental educational qualifications.
This chapter examines the extent to which other factors that exist in children’s lives contribute to improvement in cognitive ability and may help explain the developmental gap between those with poorly educated parents and those with highly educated parents. In so doing the analysis will permit some suggestion of where policy interventions designed to maximise children’s cognitive ability during the pre-school period could be focused.
Existing research on child cognitive ability identifies a range of factors experienced by young children that impact upon their cognitive development. Given that these factors are related to level of cognitive ability at a single time point, we are anticipating that they may also be related to how children’s cognitive ability changes over time – particularly during the pre-school period. The factors can be summarised across a range of ‘domains’:
• Demographic
• Family composition
• Parenting styles
• Experience of childcare and pre-school education
• Child health and development
• Parenting support
• Maternal physical and mental health
These domains have been selected for three main reasons: first, other research has shown that the characteristics, circumstances and experiences they represent are associated, in different ways, with early cognitive ability; secondly, they cover a large part of the important experiences of children’s early lives; and thirdly, GUS has collected data suitable for exploring them. In the following sections, the evidence which links measures within each of these domains to children’s cognitive development in their early years will be cited.
A particular aim of this report is to identify factors which may lead to a narrowing of the gap in children’s cognitive ability at age 3 during the pre-school period – factors which are associated with a relative improvement in ability from age 3 to age 5. Thus the analysis is not looking for factors necessarily associated with higher or lower cognitive ability – but those which are associated with change in ability, particularly a positive change from earlier scores. Whilst a certain characteristic may predict higher ability at age 3 or at age 5, it will not necessarily be associated with a change in scores in the pre-school period. However, we are assuming that the same factors are associated with both level of ability and change in ability to some degree.
The effect of factors in each domain was explored using multivariate analysis12. The
results of this analysis allow us to determine which characteristics, circumstances and experiences of children’s lives were independently associated with a relative improvement or decline in cognitive ability in the pre-school period after controlling for level of parental education. In addition, by looking at whether these factors weaken the strength of the relationship between parental level of education and cognitive ability at age 5, it is possible to measure whether variations in the additional factors are behind some of the education-related differences. That is, for example, to see whether some of the difference in ability by parents’ education actually occurs because children whose parents have different levels of education have different experiences, circumstances or relationships.
3.2 Key findings
• Compared with children whose parents are degree-educated, those whose parents have no qualifications are more likely, amongst other things, to have younger mothers, live in lone parent families, experience lower levels of home learning activities and household rules, to have had a low birth weight, poorer general health, and a mother who smokes.
23
education continues to have an independent positive effect on change in either ability after the full range of other factors is taken into account. This suggests that much of the difference in ability amongst children from lower educational backgrounds is explained by differences in the home and external environments, and parenting experiences of the children in these groups.
• Changes in vocabulary ability during the pre-school period are more strongly related to aspects of the child’s home environment and the choices and behaviours of parents than external influencing factors such as pre-school education. After controlling for parental education, greater consistency of parenting, stronger parent-child attachment, attendance at ante-natal classes and breastfeeding were each independently associated with a relative improvement in vocabulary ability in the pre-school years.
• Early language development is also important – those children who display better communicative skills at an earlier stage are those who are more likely to see their skills improving during the pre-school period. It would appear generally beneficial therefore, to seek to improve children’s communication ability from the very earliest stages and establish better skills earlier in order to ensure continued positive language development.
• Parenting and the home environment were also associated with change in problem solving ability; a higher frequency of home learning activities and being breastfed were each independently associated with a relative improvement in problem solving scores. External factors were also related to changes in this ability. Attending a private nursery school for pre-school education and some experience of primary school13 were both
associated with positive development whereas not attending pre-school and living in an area in the most deprived quintile were associated with a relative decline in ability.
• The significant variables present a complex picture of the numerous elements of children’s lives which, taken together, can influence their cognitive development. Influencing just one factor is unlikely to generate any change in children’s ability.
3.3 Domains of influence on cognitive development
First we examine how demographic characteristics vary by levels of education, then we will look at whether they are independently associated with change in cognitive ability and whether they explain any of the education-related differences.
3.3.1 Demographic characteristics
A range of evidence exists demonstrating the importance of demographic characteristics – including gender, parental ethnicity and maternal age – in predicting pre-school
cognitive test scores. Previous analysis of GUS data, for example, has shown that at age 3, on average girls scored significantly higher than boys in both vocabulary and problem solving assessments (Bromley, 2009). In the same analysis, children with younger
mothers – particularly mothers who are aged under 20 at the child’s birth – are shown to have lower scores than are those with older mothers. Similar patterns are observed at age 3 in other comparable UK data from the Millenium Cohort Study which demonstrates that such demographic differences persist at age 5 and age 7 (Hansen, 2008; Hansen et al, 2010). The MCS data, and a considerable range of other research (Magnuson and Duncan, 2006; Keels, 2008) also show difference in early test scores between children of different ethnic backgrounds, particularly in the US.
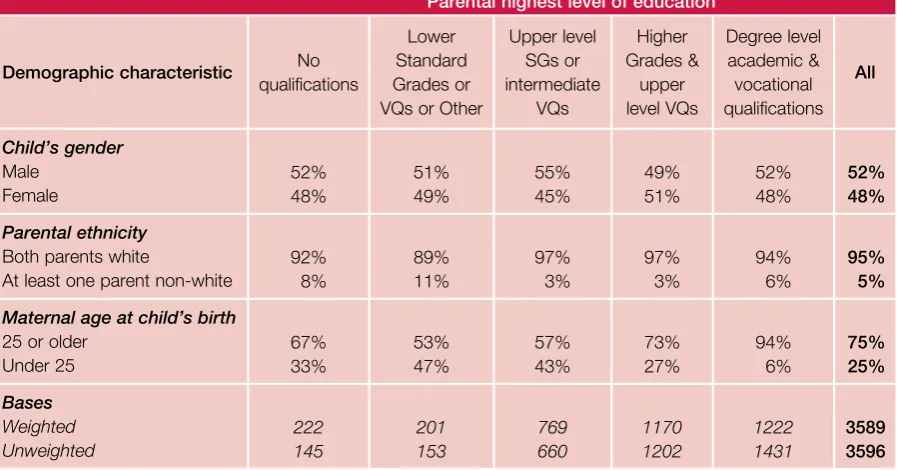
Table 3.1 displays the demographic characteristics of children in each education group.
• There are few differences in the gender split of children from different educational backgrounds.
• There is a greater concentration of children with a non-white parent amongst the lower educational groups with fewer represented in the higher education groups. Eight per cent of families with no qualifications have at least one parent who is non-white compared with 3% of those with Higher Grades or upper level vocational qualifications.
Table 3.1 Selected demographic characteristics by parental highest level of education
Parental highest level of education
Demographic characteristic No
qualifications
Lower Standard Grades or VQs or Other
Upper level SGs or intermediate VQs Higher Grades & upper level VQs Degree level academic & vocational qualifications All Child’s gender Male Female 52% 48% 51% 49% 55% 45% 49% 51% 52% 48% 52% 48% Parental ethnicity
Both parents white
At least one parent non-white
92% 8% 89% 11% 97% 3% 97% 3% 94% 6% 95% 5%
Maternal age at child’s birth
25 or older Under 25 67% 33% 53% 47% 57% 43% 73% 27% 94% 6% 75% 25% Bases Weighted Unweighted 222 145 201 153 769 660 1170 1202 1222 1431 3589 3596
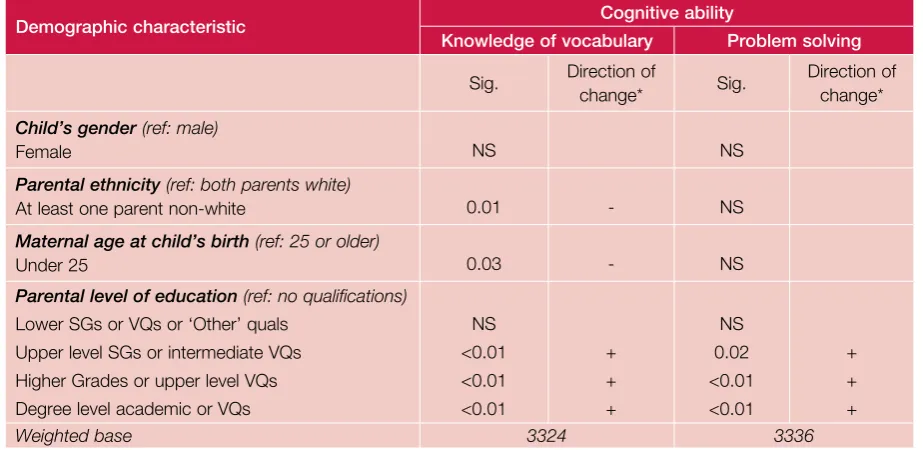
A summary of the demographic domain regression is included in Table 3.214. The results
suggest that demographic factors are more important for change in vocabulary ability than for problem solving. After accounting for parental education, having non-white parents and a younger mother at birth are both associated with a decrease in vocabulary ability during the pre-school period.
14 Full results from the regression are shown in Tables 3 and 4 in the Technical Appendix.
Table 3.2 Demographic domain linear regression – summary results
Demographic characteristic Cognitive ability
Knowledge of vocabulary Problem solving
Sig. Direction of
change* Sig.
Direction of change*
Child’s gender(ref: male)
Female NS NS
Parental ethnicity(ref: both parents white)
At least one parent non-white 0.01 - NS
Maternal age at child’s birth (ref: 25 or older)
Under 25 0.03 - NS
Parental level of education(ref: no qualifications)
Lower SGs or VQs or ‘Other’ quals NS NS
Upper level SGs or intermediate VQs <0.01 + 0.02 + Higher Grades or upper level VQs <0.01 + <0.01 + Degree level academic or VQs <0.01 + <0.01 +
Weighted base 3324 3336
*A plus sign (+) indicates relative improvement in ability score and a minus sign (-) indicates relative decline in ability score for children in the various sub-groups as compared those in the reference sub-group. The reference sub-group is indicated in brackets. Where the variable is not significant, direction of change has not been included.
The effect of education persists after the domain variables have been added to the model – this is illustrated in Figure 3-A and Figure 3-B. The graphs display the values of the standardised regression co efficient (which measures the strength of the association) between parental level of education and cognitive ability at age 5. The solid line displays the values in a model with just education and ability score at age 3 as explanatory
variables. The dotted line displays the values after the domain (in this case, demographic) measures have been added. If the dotted line falls below the solid line, this indicates a weakening of the association between education and change in ability after the domain measures have been added suggesting that differences in the domain measures by level of education help explain some of the association between education and change in ability. In contrast, if the dotted and solid lines show little separation, this indicates that the domain variables explain little or none of the association between education and change in ability.
27
Figure 3-A Associations between parental education and change in vocabulary ability before and after taking account of demographic characteristics
0 0.2 0.4 0.6
Lower SGs or VQs or 'Other'
quals
Upper level SGs or Intmed
VQs Higher Grades or Upper level VQs Degree level academic or VQs S tan d a rd ised co -e ff icien t Before After
Note: reference category is ‘no qualifications’.
Figure 3-B Associations between parental education and change in problem solving ability before and after taking account of demographic characteristics
0 0.2 0.4 0.6
Lower SGs or VQs or 'Other'
quals
Upper level SGs or Intmed
VQs Higher Grades or Upper level VQs Degree level academic or VQs S tan d a rd ised co -e ff icien t Before After
Note: reference category is ‘no qualifications’.
3.3.2 Family composition
Table 3.3 Selected family composition characteristics by parental highest level of education
Parental highest level of education
Family composition characteristics No qualifications Lower Standard Grades or VQs or Other
Upper level SGs or Intermediate VQs Higher grades and upper level VQs Degree level academic & vocational qualifications All
Family type transitions, 10mths to 34mths15
Stable couple
Couple who separated Stable lone parent
Lone parent who re-partnered
38% 6% 47% 9% 57% 7% 28% 9% 58% 7% 26% 8% 78% 5% 10% 7% 94% 3% 2% 1% 75% 5% 14% 6%
Number of children in household at 10mths
One Two
Three or more
29% 30% 42% 32% 45% 23% 35% 39% 26% 36% 45% 18% 31% 50% 19% 34% 44% 22%
Cohort child’s birth order
First born in household Not first born
41% 59% 44% 56% 48% 52% 51% 49% 54% 46% 50% 50% Bases Weighted Unweighted 230 150 206 157 779 668 1172 1204 1228 1437 3621 3621
• Almost all (94%) families with a degree-educated parent are headed by a stable couple, compared with around two-fifths (38%) of families where parents have no qualifications. Families in the lower educational groups are significantly more likely to be stable lone parents.
• The key variation in number of children by education is on the proportion of households with three or more children This is significantly higher in the no
qualifications group than in all other groups and is lowest for the degree-educated group. There is very little difference in the proportion of singleton households by education.
• Among the lower qualified groups, the child was significantly more likely to be the oldest in the household – 59% were the first born in the no qualifications group compared with 46% in the degree group. This reflects, at least in part, the differences in maternal age amongst the two groups seen in Table 3.1 above.
29
When entered into the multivariate model alongside score at age 3 and parental level of education, none of the family composition variables were found to be significantly associated with a change in cognitive ability – on either assessment16. Neither was there
any notable change in the strength of the relationship between education and ability. Thus, these factors are neither independently related to change in cognitive ability during the pre-school years nor do they explain any of the difference in ability by education.
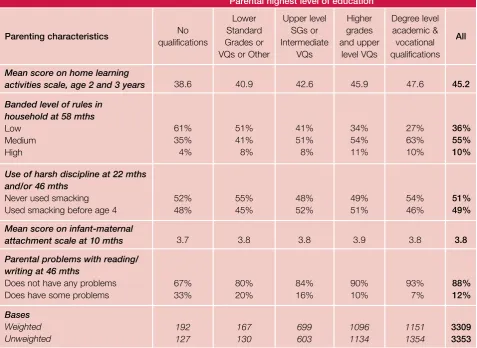
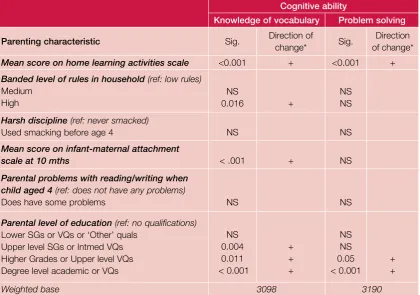
3.3.3 Parenting factors
Considerable attention has been focused in recent years on the relationship between parenting activities and children’s development – including their cognitive development. In particular, numerous studies have shown a significant relationship between aspects of parenting – such as the nature of the parent-child relationship and the pursuit of home learning activities17 – and children’s early language skills (Bromley, 2009; Waldfogel and
Washbrook, 2008; Waldfogel and Washbrook 2010; Foster et al, 2005; National Evaluation of Sure Start, 2008; Sylva et al, 2003).
Five aspects of parenting are considered in this section:
• Frequency of home learning activities.
• The existence of rules.
• Use of harsh discipline.
• Early infant-maternal attachment.
• Parental problems with reading or writing.
Table 3.4 provides information on how these factors vary according to parental level of education.
16 Full results of the regression analysis are shown in Tables 5 and 6 in the Technical Appendix.