The SEN and Disability
Pathfinder programme
Evaluation
Progress and indicative costs of
the reforms
Research report
March 2014
2
Contents
List of figures 4
List of tables 6
Acknowledgements 7
The team 8
The Evaluation team 8
Executive Summary 9
Background 9
Overview 9
Organisational engagement and cultural change 9
Engaging and involving families 10
Setting up the infrastructure 10
Updating the indicative costs of reform 11
1: Introduction 12
Structure of this report 12
2: Organisational engagement and cultural change 13
Introduction 13
A. Engagement of relevant stakeholders 14
B. Recruitment of designated staff 15
Commitment to share resources 16
Engagement of parent carers, children and young people and the VCS 18
C. Change management 18
D. Development of local offer and market development 19
Variations of self-assessed progress across pathfinder areas 20
3
3: Engaging and involving families 22
E. Awareness-raising with families and young people 22
F. Peer support 23
Summary 24
4: Setting up the infrastructure 25
G: Mapping of the co-ordinated assessment and single plan pathway 26
Assessment 26
Planning 27
H. Co-ordination and delivery of the EHC planning approach 27
I. Delivery of personal budgets 28
J. Development of IT resources 29
K Review of safeguarding and risk management procedures 30
Variations of self-assessed progress across pathfinder areas 30
Summary 31
5. Updating the indicative costs of reform 33
Costs of developing the pathfinder approach 34
Funding and spend 34
Estimating the costs of setting up the pathfinder approach 39
Summary 40
Annex A: The Common Delivery Framework 41
Annex B: Work undertaken to inform this programme report 44
The monitoring tool 44
4
List of figures
Figure 1 Organisational responsibilities 8
Figure 2 Pathfinder progress setting up governance structures by end of September 2013 14
Figure 3 Stakeholders engaged in the governance of the pathfinder 15
Figure 4 Pathfinder progress recruiting designated staff by end of September 2013 15
Figure 5 Which agencies were the project lead and manager from? 16
Figure 6 Progress in gaining commitment to share resources by the end of September
2013 17
Figure 7 Which of the following agencies had agreed to share resources by end of
September 2013? 17
Figure 8 Progress engaging parent carers, children and young people and the VCS by
the end of September 2013 18
Figure 9: Pathfinder progress developing change management at the end of September
2013 19
Figure 10 Pathfinder area progress developing the local offer and provider market at the
end of September 2013 19
Figure 11 Responses to the series of monitoring questions on organisational
engagement and cultural change by the end of September 2013 20
Figure 12 Pathfinder area progress relating to awareness-raising with families by the end
of September 2013 23
Figure 13 Pathfinder area progress relating to the delivery of peer support by the end of
September 2013 24
Figure 14 Pathfinder area progress mapping the assessment and plan pathway by the
end of September 2013 26
Figure 15 Assessment stage of the pathway 26
Figure 16 Single planning stage of the pathway 27
Figure 17 Co-ordination and delivery of the pathfinder approach 28
Figure 18 Pathfinder area progress developing personal budgets by the end of
5
Figure 19 Pathfinder area progress developing IT resources by the end of September
2013 29
Figure 20 Pathfinder area progress relating to safeguarding and risk management by the
end of September 2013 30
Figure 21 Responses to the series of monitoring questions on setting up the
infrastructure and risk management by the end of September 2013 31
Figure 22 Profile of actual spend to September 2013 across a distribution of five of the
pathfinder areas 36
Figure 23 Financial and in kind costs by type of activity 37
Figure 24 Breakdown of costs from first 2 years of the pathfinder by CDF theme and by
the service that incurred the cost 38
Figure 25 Scale against which progress was judged 41
Figure 26 Research undertaken to inform the December 2013 Report 44
6
List of tables
Table 1 Departmental core grant funding allocation for the first two years of the pathfinder
programme 34
Table 2 Average funding allocation and spend over first two years of the pathfinder 35
Table 3 Average in-kind staff days spent on pathfinder activities over first two years of the
pathfinder 36
Table 4 Unit costs of staff time 39
Table 5 Overarching costs (first 2 years) 40
7
Acknowledgements
8
The team
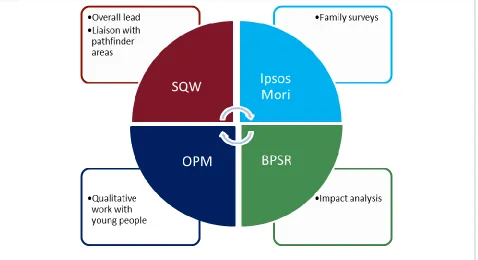
SQW was commissioned by the Department for Education to lead a consortium,
including Ipsos MORI, Bryson Purdon Social Research (BPSR) and the Office of Public Management (OPM), to undertake the evaluation of the SEN and Disability Green Paper pathfinder programme. The team drew together a wide range of complementary
[image:8.595.58.536.221.481.2]experience. Each organisation had a distinct role to contribute to the effective evaluation of the programme, as shown in the diagram below.
Figure 1 Organisational responsibilities
Source: SQW
The Evaluation team
Graham Thom, the Managing Director of SQW, acted as the Project Director of the Evaluation.
Meera Craston (nee Prabhakar), a Director at SQW, acted as the Project Manager of the Evaluation.
Rhian Spivack (nee Johnson), Kathryn Hill, Kerry Fox, Christopher Carr, Rachel Redman and Tarran Macmillan formed the other members of the SQW research team.
Claire Lambert and Fay Yorath, an Associate Director and a Research Manager, acted as the leads for Ipsos MORI.
Susan Purdon and Caroline Bryson acted as the leads from BPSR.
9
Executive Summary
Background
SQW was commissioned by the Department for Education in September 2011 to lead a consortium of organisations to undertake the evaluation of the Special Educational Needs and Disability (SEN and Disability) Pathfinder Programme.
This report presents commentary and analysis on self-reported progress made by 31 pathfinder areas against a Common Delivery Framework (CDF) developed by SQW. It uses data from the quarterly monitoring returns completed by areas to describe the progress made by pathfinder areas in the first two quarters of the 2013/2014 financial year, and compares progress between Quarter 4 of 2012/13 and the end of Quarter 2 of 2013/14.
Overview
This report shows that the pathfinders have continued to make progress between March and September 2014. They are generally most advance in addressing issues around organisational engagement and cultural change, and less advanced around setting up the infrastructure. This pattern is similar to that reported previously.
In the last six months most progress (in terms of reaching full implementation) was
reported in terms of: the commitment across services to share resources; developing and implementing change management; the development of a planning pathway; the local offer and peer support. That said, the latter two started from a low base and there remains fairly few areas claiming full implementation.
Organisational engagement and cultural change
Project governance structures were widely established by the end of September 2013, with project plans and objectives in place. In addition, all areas had engaged local authority education, children’s social care and the Parent Carer Forum in governance of the pathfinder.
Most pathfinder leads and managers had been sourced from education, or a combination of education and another service. This in part explains the 27 areas which had secured commitment from education to share resources. Commitment from social care to share resources was also high (26 areas). Commitment from health remained lower, despite an additional six areas securing heath commitment between March and September 2013.
10
All areas had engaged parent carers and 26 areas had engaged the Voluntary and Community Sectors (VCS) by the end of September, representing progress since March 2013. Progress remained slower in relation to the engagement of children and young people, with 13 areas having reached full implementation by the end of September.
There had been some progress in change management, although there was still some way to go. The majority of areas reported reaching full implementation in developing a change management process, and just over half of all areas (17) had reached full implementation in delivering the change management process.
Consultation with the provider market and the development of the local offer remained less developed. Only two areas had reached full implementation for both. The majority of areas had reached partial development.
Engaging and involving families
Good progress had been made engaging and involving families. The majority of areas had fully implemented or already established awareness-raising of the pathfinder with families (28 of 31 areas) and recruited families to participate in the pathfinder (26 of 31 areas).
Implementation of peer support was more mixed. Sixteen areas had fully implemented peer support for parent carers, or already had existing structures in place. Peer support for children and young people was less prevalent still, and had been fully implemented by three of the 31 areas.
Setting up the infrastructure
Twenty-five areas had fully implemented an assessment and plan pathway at the end of quarter 2 of 2013/14, which represented an increase of five areas in six months. The assessment element of the pathway most commonly entailed bringing together a set of assessments from different agencies (reported by 24 of 31 areas) or a single assessment episode supplemented by ad hoc assessments (20 of 31 areas). Planning was executed in a single event attended by professionals and the family (reported in 25 areas) or through use of a planning co-ordinator creating the plan with the family and seeking relevant professional input (also 25 areas).
Areas had made limited progress in offering personal budgets. Six areas had fully implemented a spectrum of choice for the management of personal budget funds, and four areas had established a resource allocation system.
Development of IT resources was mixed. While the majority of areas (23 of 31) had reached full implementation in gaining family consent to share information, and
11
and five of the 31 areas had done so with an IT system capable of storing assessments and plans.
Safeguarding remained another less developed element of the pathfinder approach. Sixteen areas reported full implementation in reviewing their safeguarding procedures in light of the pathfinder. Fourteen areas had reached full implementation in communicating the relevant safeguarding information to families or providers and 13 had communicated safeguarding procedures to professionals.
Updating the indicative costs of reform
The analysis updates the costs of developing the pathfinder approach, incorporating two additional quarters of data (Q1 and Q2 of 2013/14).
The median estimated total development cost per area was £454,412 over the first two years of the pathfinder, including both financial and in kind costs. However this varied substantially by area, from a minimum of £267,584 in one area to a maximum of £744,104 in another.
The proportion of financial and in-kind costs associated with organisational engagement and cultural change was highest within the first six months of the programme, while proportionate costs associated with the remaining themes of the CDF remained relatively stable across the duration of the programme. Substantial pathfinder costs were attributed to cross-cutting spend, implying joint development and working within areas. Costs
12
1: Introduction
This report presents commentary and analysis on self-reported progress made by 31 pathfinder areas against a Common Delivery Framework (CDF) developed by SQW and described in detail in Annex A. It uses data from the quarterly monitoring returns
completed by areas through the SQW monitoring tool to describe the progress made by pathfinder areas in the first two quarters of the 2013/2014 financial year, and compares progress between Quarter 4 of 2012/13 and the end of Quarter 2 of 2013/14. Progress over the preceding 18 month period is covered more fully in the April 2013 Process and
Implementation EvaluationResearch Report1. That report also draws on wider qualitative
evidence, which provides further explanation for some of the issues raised in this document.
In reporting on progress against the CDF, a base number of 31 pathfinder areas has been used, compared to 29 areas used in previous reports. This change is due to two cases where two local authorities had been working collaboratively in phase one and so were submitting a combined monitoring return. In phase two, both pairs of local
authorities have returned to working individually. In order to provide a baseline position for the areas, the Quarter 4 2012/2013 data for the combined area was duplicated for each of the two individual areas, to allow a comparison of 31 responses between both data points. In one of the four cases the local area appears to have regressed on a number of measures since the separation, while in the other three the change appears to have made little difference to overall progress.
The report also updates the indicative costs of developing the pathfinder approach
originally calculated for the July 2013 Impact Evaluation Research Report2, incorporating two additional quarters of data (Quarter 1 and Quarter 2 of 2013/14).
Structure of this report
The remainder of this report is structured as follows:
Progress made by areas across the four CDF themes is covered in
Chapter 2 - Organisational involvement and cultural change
Chapter 3 - Engaging and involving families
Chapter 4 - Setting up the pathfinder infrastructure, and safeguarding and risk management
The updated indicative costs of developing the pathfinder approach are covered in Chapter 5
Annex A provides a description of the Common Delivery Framework
Annex B sets out the method used to collect the data that informed this report.
1 Craston, M. et al (2013) ‘Evaluation of the SEND Pathfinder programme: Process and implementation
research report’
2
13
2: Organisational engagement and cultural change
Introduction
This chapter covers the progress of pathfinder areas in engaging relevant professionals and initiating cultural change to enable multi-agency working to deliver the pathfinder approach. Progress between April 2013 and the end of September 2013 is outlined against the four elements of this CDF theme:
A. Engagement of relevant stakeholders
B. Recruitment of designated staff
C. Change management
D. Market development and the local offer. KEY FINDINGS
All areas had established a clear set of objectives and developed a project plan by the end of September 2013, and 30 areas had established a project board and governance structure
All areas had engaged local authority education, children’s social care and the Parent Carer Forum in governance of the pathfinder
Most pathfinder leads and managers were primarily sourced from education, or from a combination of education and another service
The majority of areas had secured commitment from education (27 areas) and social care (26 areas) to share resources to develop and deliver the pathfinder. While an additional six areas had reached full implementation for health
engagement since March, fewer areas had secured a commitment from health to share resources than other services
Most areas had engaged the VCS by the end of September 2013. However, only 13 areas had had reached full implementation in relation to the
engagement of children and young people
Areas had made good progress in change management. The majority of areas reported reaching full implementation in developing a change management process (19) and delivering the change management process (17)
14
A. Engagement of relevant stakeholders
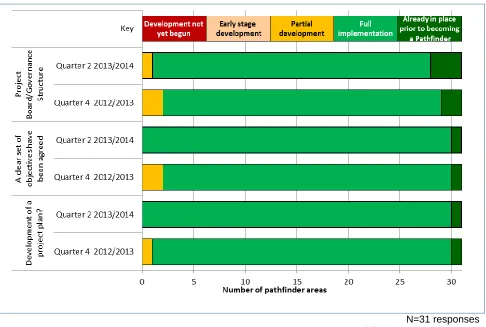
[image:14.595.52.538.234.561.2]Almost all areas had engaged the relevant stakeholders by the end of March 2013. Figure 2 shows further improvement between April and September. By September 2013 all areas had reached full implementation in establishing a clear set of objectives and developing a project plan. All bar one area had also achieved full implementation in establishing a project board and governance structure. The exception was an area that had moved from full implementation to partial development due to the project board being restructured in Quarter 2 of 2013/14.
Figure 2 Pathfinder progress setting up governance structures by end of September 2013
N=31 responses Source: Pathfinder monitoring returns
15
16
Figure 3 Stakeholders engaged in the governance of the pathfinder
N=31 responses Source: Pathfinder monitoring returns
B. Recruitment of designated staff
All areas had designated an overall lead for the pathfinder by the end of March 2013. The majority of areas also had a project manager and project development team in place. One area was still in the process of appointing a project manager at the end of quarter 2 2013/14, which reflected staff change. The one area that reported a partially-developed project development team at the end September had recently been working with another local authority and was now establishing its own team.
Figure 4 Pathfinder progress recruiting designated staff by end of September 2013
[image:16.595.52.539.500.770.2]17
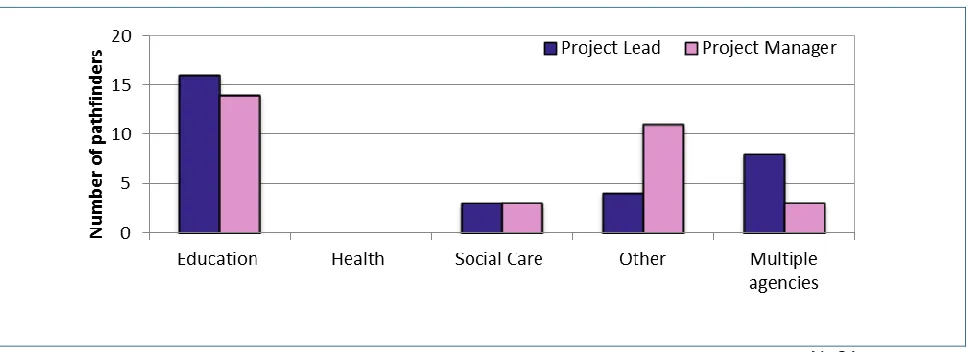
[image:17.595.53.537.199.375.2]Professionals with a background in education were most often engaged in leading or managing the pathfinder. As shown in Figure 5 , 16 pathfinder leads were from an education post, with an additional eight from both education and another service. Pathfinder managers were also predominantly sourced from education; 14 were from education with an additional three managers that were from both education and another service.
Figure 5 Which agencies were the project lead and manager from?
N=31 responses Source: Pathfinder monitoring returns
Commitment to share resources
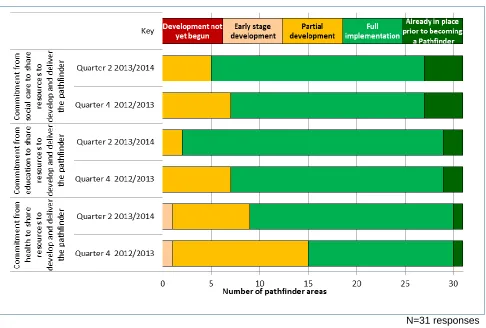
The majority of areas had commitment from both education (27 areas) and social care (26 areas) to share resources, which was an improvement from the situation in March 2013. While an additional six areas had secured commitment from health to share resources since March, commitment from health remained less prevalent across areas. The one pathfinder area at early stage development at the end of quarter 2 2013/14 had previously worked with another local authority and therefore was still establishing the pathfinder process.
18
Figure 6 Progress in gaining commitment to share resources by the end of September 2013
N=31 responses Source: Pathfinder monitoring returns
Figure 7 Which of the following agencies had agreed to share resources by end of September 2013?
[image:18.595.53.546.475.686.2]19
Engagement of parent carers, children and young people and the VCS
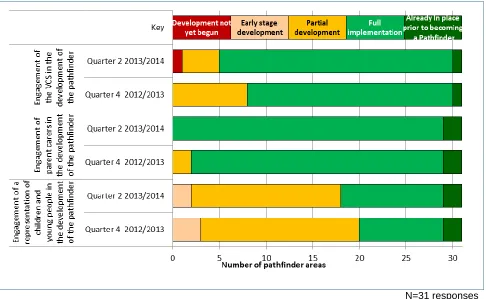
By the end of September 2013, all 31 areas had either reached full implementation or had engaged parent carers prior to the pathfinder, as shown in Figure 8. There had been some progress in engagement of the VCS, which had been fully implemented by 26 areas at the end of September.
[image:19.595.53.539.257.556.2]As before, the engagement of children and young people was less widespread. At the end of September 2013, only 13 of 31 areas had reached full implementation, which showed an increase of two more areas compared to the end of March 2013.
Figure 8 Progress engaging parent carers, children and young people and the VCS by the end of September 2013
N=31 responses Source: Pathfinder monitoring returns
C. Change management
20
21
Figure 9: Pathfinder progress developing change management at the end of September 2013
N=31 responses Source: Pathfinder monitoring returns
D. Development of local offer and market development
By the end of September 2013, the majority of areas (21) had reached partial
development of their local offer. In addition, eight areas reported having reached full implementation, implying an increase of six areas since March 2013. Two areas had reached full implementation both for consultation with the provider market and development of the local offer.
Figure 10 Pathfinder area progress developing the local offer and provider market at the end of September 2013
[image:21.595.52.542.532.760.2]22
Variations of self-assessed progress across pathfinder areas
[image:22.595.54.541.252.480.2]Figure 11 summarises responses to the 16 organisational engagement and cultural change elements of the CDF by each area (see Annex A). Twenty-four areas had reached full implementation or had already implemented 11 of the CDF elements, illustrating an improvement since March. By contrast, two of the pathfinder areas only considered themselves to have delivered against eight of the organisational engagement and cultural change elements, of which one was an area that had previously worked with another local authority.
Figure 11 Responses to the series of monitoring questions on organisational engagement and cultural change by the end of September 2013
N=31 responses Source: Pathfinder monitoring returns
Summary
Project governance structures were widely established by the end of September 2013, with project plans and objectives in place. In addition, all areas had engaged local authority education, children’s social care and the Parent Carer Forum in governance of the pathfinder.
Most pathfinder leads and managers had been sourced from education, or a combination of education and another service. This in part explains the 27 areas which had secured commitment from education to share resource. Commitment from social care to share resources was also high (26 areas). Commitment from health remained lower, despite an additional six areas that had secured heath commitment between March and September 2013.
23
pathfinder. Seventeen areas had secured funding for service provision from health, and nine areas had secured funding for development from social care.
All areas had engaged parent carers and 26 areas had engaged the VCS by the end of September, representing progress since March 2013. Progress remained slower in relation to the engagement of children and young people: only 13 areas had reached full implementation by the end of September.
There had been some progress in change management, although there was still some way to go. Compared to March, the majority of areas reported reaching full
implementation in developing a change management process, and just over half of all areas (17) had reached full implementation in delivering the change management process.
Consultation with the provider market and the development of the local offer remained less developed. Only two areas had reached full implementation for both. The majority of areas had reached partial development.
24
3: Engaging and involving families
The pathfinder approach not only requires areas to establish a new process for children and young people with SEN, but also to communicate this new approach to families and professionals. For those families recruited, it is also necessary to establish peer support, for both the parents and young people.
This chapter summarises areas’ progress with the engaging and involving families theme of the CDF, which covers:
E. Awareness-raising with families and young people
F. Peer Support.
E. Awareness-raising with families and young people
As shown in KEY FINDINGS
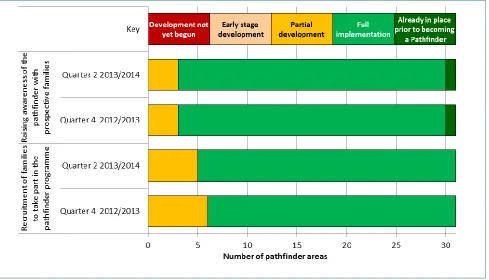
The majority of areas had reached full implementation of their work to raise awareness of the pathfinder with prospective families (28) and of the
recruitment of families to take part in the programme (26)
Sixteen areas had reached full implementation or already established peer support for parent carers by the end of September, which represented an increase of seven areas since March
Progress on delivery of peer support to children and young people as part of the pathfinder was more limited. Only three areas had reached full
25
26
Figure 12 Pathfinder area progress relating to awareness-raising with families by the end of September 2013
N=31 responses Source: Pathfinder monitoring returns
F. Peer support
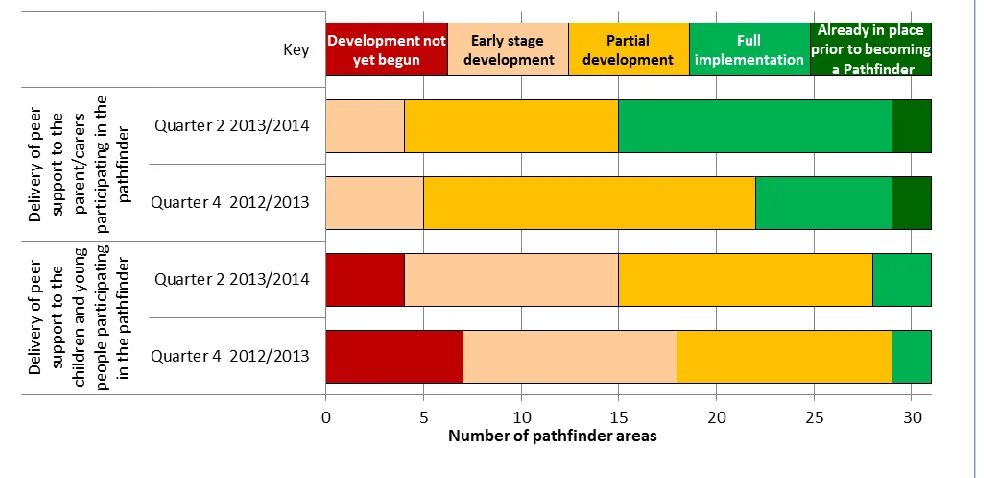
Progress in delivering peer support was mixed at the end of September 2013. Just over half (16) of areas had achieved full implementation in delivering peer support to parent carers by the end of September, which was an increase of seven areas since March. This may in part be due to the growing strength of a number of Parent Carer Forums working alongside the pathfinder in several areas.
Delivery of peer support to the children and young people involved in the pathfinder was noted as being a challenge by a number of areas. At the end of September progress was mixed, 13 areas had reached partial development and 11 areas were in the early stages of delivery. The limited progress reported may be due in part to the school holiday period in Quarter 2, which may have affected their ability to work with children and young
27
Figure 13 Pathfinder area progress relating to the delivery of peer support by the end of September 2013
N=31 responses Source: Pathfinder monitoring returns
Summary
Good progress had been made engaging and involving families by the end of September 2013. The majority of areas had fully implemented or already established awareness-raising of the pathfinder with families (28 of 31 areas) and recruited families to participate in the pathfinder (26 of 31 areas).
Implementation of peer support was more mixed. Sixteen areas had fully implemented peer support for parent carers, or already had existing structures in place. Peer support for children and young people was less prevalent still, and had only been fully
28
4: Setting up the infrastructure
Central to delivering the multi-agency approach necessitated by the pathfinder
programme is establishing the appropriate infrastructure to enable the delivery of EHC plans. Progress in setting up the infrastructure is covered in relation to:
G. Mapping of the coordinated assessment and plan pathway
H. Coordination and delivery of the pathfinder approach
I. Development of personal budgets
J. Development of IT resources
K. Safeguarding and risk management. KEY FINDINGS
The majority of areas (25) had reached full implementation in developing an assessment and plan pathway by the end of September 2013
Most areas assessed children or young people through bringing together a set of assessments from different agencies (24 of 31 areas) or in a single
assessment episode supplemented by later assessments on an ad hoc basis (20 of 31 areas)
Planning was normally conducted in a single event involving both professionals and the family (reported by 25 of 31 areas) or by a planning coordinator
creating the plan with the family and seeking the relevant professional input (25 of 31 areas)
Delivery of personal budgets remained limited amongst areas, especially in terms of developing a resource allocation system, where four areas had reached full implementation
Development of IT resources remained mixed in progress by the end of
September. The majority (23 of 31) had reached full implementation in gaining consent to share information from families and 21 areas had reached full implementation in establishing information-sharing between agencies
However, development of appropriate management information was less prevalent (eight areas had fully implemented or already had this in place), and few areas had an IT system capable of storing assessments and plans (five areas had fully implemented or already had this in place)
Approximately half of all areas (16) had reached full implementation in reviewing the relevant safeguarding procedures for the pathfinder approach. Fourteen areas had reached full implementation in communicating the
29
G: Mapping of the co-ordinated assessment and single plan
pathway
[image:29.595.55.538.208.372.2]Areas had continued to make progress in establishing the assessment and plan pathway by the end of September 2013. As shown in Figure 14 , 25 of the 31 areas had reached full implementation in developing an assessment and plan pathway, an increase of five since March 2013.
Figure 14 Pathfinder area progress mapping the assessment and plan pathway by the end of September 2013
N=31 responses Source: Pathfinder monitoring returns
Assessment
As shown in
Figure 15, most areas’ approach to assessment was based around bringing together assessments from relevant agencies (24 of 31 areas) or a single assessment episode supplemented by ad hoc specialist assessment (20 of 31 areas). Both imply a
coordinated assessment approach, bringing together professional inputs from the necessary agencies to feed into a single planning stage.
30
N=31 responses, Source: Pathfinder monitoring returns
Planning
[image:30.595.51.539.58.283.2] [image:30.595.51.538.515.726.2]Two common approaches to the planning pathway had emerged (
Figure 16). The majority of areas either held a single planning event between all relevant professionals and the family (25 of 31 areas), and/or a planning co-ordinator created the plan with the family initially, and then sought professional input from the necessary agencies (25 of 31 areas). By comparison, just seven areas reported using a multi-staged planning event (i.e. different stages of the planning process are undertaken at different times), implying that for the most part, planning was undertaken in a single event informed by multi-agency professionals.
Figure 16 Single planning stage of the pathway
31
H. Co-ordination and delivery of the EHC planning approach
[image:31.595.53.539.355.514.2]The majority of areas (23 of 31) had reached full implementation in relation to the co-ordination and delivery of the EHC planning approach, with the remaining areas reaching partial development. The number of areas that had not finalised their pathfinder approach was perhaps higher than expected. In part this can be explained by two of the seven areas at partial development being local authorities that had separated from working with other authorities and were still in the process of defining their approach.
Figure 17 Co-ordination and delivery of the pathfinder approach
N= 31 responses, Source: Pathfinder monitoring returns
I. Delivery of personal budgets
At the end of March 2013, most areas were at the initial stages of establishing personal budgets. There had been limited additional progress by the end of September (as shown in Figure 18 ). Three areas had reached full implementation across all three measures of support planning, development of a resource and funding mechanism and development of choice for management of personal budget funds. This meant that progress across delivery of personal budgets was largely focused in a few areas.
32
N=31 responses Source: Pathfinder monitoring returns
J. Development of IT resources
Development of IT resources covers both progress in gaining permission from
professionals and families to share information, and the development of infrastructure to capture and monitor information on the EHC planning process. At the end of September 2013, the majority of areas had reached full implementation in gaining consent from families for information-sharing (23), for information-sharing between agencies (21), and having implemented inter-agency information sharing protocols. This suggests that in the majority of areas information-sharing was supported by a formal process.
[image:32.595.50.539.56.346.2]At the end of March, most areas were still in the formative stages of establishing suitable IT infrastructure to support multi-agency working. By the end of September, eight areas had reached full implementation or already had in place appropriate management information, and 15 had reached partial development. Development of appropriate IT infrastructure remained the least developed element of the pathfinder infrastructure, with only five areas having reached full implementation or already having an appropriate system in place.
33
N=31 areas Source: Pathfinder monitoring returns
K Review of safeguarding and risk management procedures
[image:33.595.53.538.54.463.2]Review of safeguarding and risk management procedures as a result of pathfinder activity remained a less developed element of the pathfinder process in September, as it had in March. Just over half (16) of areas had reached full implementation in reviewing their safeguarding and risk management procedures or already had suitable procedures in place. One additional area had reached full implementation for communicating revised safeguarding procedures to providers and families since March.
34
N=31 areas Source: Pathfinder monitoring returns
Variations of self-assessed progress across pathfinder areas
The progress areas had made within the setting up the infrastructure, and the
safeguarding and risk management themes of the CDF is presented in Figure 20. Of the 31 areas, 10 had reached full implementation or had established processes prior to the pathfinder for 10 of the 14 elements within these two themes of the CDF. Conversely, five areas had only reached full implementation for two or less of these elements of the CDF.
[image:34.595.51.539.57.378.2]By comparison to positive responses about organisational engagement and cultural change (Figure 11), areas had made less progress in setting up the infrastructure and safeguarding theme. In part this is due to the organisational engagement and cultural change theme containing many of the formative stages of establishing the pathfinder approach. It also highlights that the pathfinders themselves recognise that they have some way still to go.
35
N=31 areas Source: Pathfinder monitoring returns
Summary
Some progress had been made in establishing the necessary infrastructure between March and the end September 2013 in preparing to take the first cohort of families through the EHC planning process. Twenty-five areas had fully implemented an
assessment and plan pathway at the end of quarter 2 of 2013/14, which represented an increase of five areas in six months. The assessment element of the pathway most commonly entailed bringing together a set of assessments from different agencies (reported by 24 of 31 areas) or a single assessment episode supplemented by ad hoc assessments (20 of 31 areas). Planning was executed in a single event attended by professionals and the family (reported in 25 areas) or through use of a planning co-ordinator creating the plan with the family and seeking relevant professional input (also 25 areas).
Areas had made limited progress in offering personal budgets. Just six areas had fully implemented a spectrum of choice for the management of personal budget funds, and four areas had established a resource allocation system.
Development of IT resources was mixed. While the majority of areas (23 of 31) had reached full implementation in gaining family consent to share information, and
information-sharing between agencies was already in place or fully implemented in 21 areas, management of this information was far less developed. Eight areas had in place or reached full implementation in developing appropriate management information and only five of the 31 areas had done so with an IT system capable of storing assessments and plans.
36
reviewing their safeguarding procedures in light of the pathfinder. Fourteen areas had reached full implementation in communicating the relevant safeguarding information to families or providers and 13 had communicated safeguarding procedures to
37
5. Updating the indicative costs of reform
The Impact Evaluation Research Report3analysed the costs associated with developing
and implementing the pathfinder approach across the 31 pathfinder areas over the first 18 months, examining in turn the:
Costs of developing the pathfinder approach – including the use of the DfE
grant funding, additional leveraged funding and in-kind staff time. These costs were captured through the financial monitoring returns
3
Craston, M. et al (2013) Impact Evaluation of the SEND Pathfinder Programme: Research Report
KEY FINDINGS
This chapter updates the costs of developing the pathfinder approach originally calculated for the Impact Evaluation Research Report. It includes two additional quarters of data (Q1 and Q2 of 2013/14)
All pathfinder authorities received minimum grant funding of £300,000 for development costs over the first two years of the programme. Slower than expected start-up of some pathfinders resulted in substantial under-spend in year 1, with differences of up to £48,200 between the funding allocation and actual costs. These pathfinders were able to apply for an uplift of their year 2 funding, and most took up the offer
The median estimated total development cost per area was £454,412 over the first two years of the pathfinder, including both financial and in-kind costs. However this varied substantially by area, from a minimum of £267,584 in one area to a maximum of £744,104 in another
The trajectory of financial costs varied by area. A number of areas appeared to ‘pause’ or slow down following the end of 2012/13 to reflect on their progress to that point, and then ramp up their activity again from Quarter 2 (July –
September) 2013/14
Overall, the proportion of financial and in-kind costs associated with
organisational engagement and cultural change was highest within the first six months of the programme. Meanwhile proportionate costs associated with the remaining themes of the CDF remained relatively stable across the duration of the programme
38
Costs of delivering the pathfinder approach – including the costs associated
with staff attending formal EHC meetings (including both assessment and planning meetings where relevant) and with delivering the key working role(s), (including all administrative, family-facing and liaison time). These costs were captured through the monitoring data and a staff work and satisfaction survey.
This chapter revisits the costs associated with developing the pathfinder approach, incorporating data from the first two full years of activity gathered through monitoring data. It does not revisit the costs associated with delivering the pathfinder approach: these costs will be revisited through separate thematic research in 2014.
Costs of developing the pathfinder approach
Funding and spend
The pathfinder application process4 set out an intention to issue areas with grant
payments of up to £150,000 (pro rata) per annum for an initial 18 months, from quarter 3 2011/12 until the end of quarter 4 2012/13. The subsequent 18 month extension of the pathfinder5 resulted in the allocation of further grant funding to pathfinder areas, bringing the total grant funding over the first two years of the programme to £300,000 (Table 1). The funding was intended to cover the development costs and not the cost of service provision.
It is important to note that the figures below (and throughout this chapter) exclude the pathfinder champion funding, which was provided to a subset of areas in 2013/14. This funding (and the associated spend) was excluded because it did not relate to the
[image:38.595.60.527.595.659.2]‘development’ of the pathfinder approach within an area, but rather to the sharing of best practice to inform the development of other areas’ approaches. Therefore, its inclusion in the analysis would lead to an over-estimate of the costs associated with developing a pathfinder approach in a local area.
Table 1 Departmental core grant funding allocation for the first two years of the pathfinder programme
Financial year 2011/12
(Q3-4) 2012/13 (Q1-4) 2013/14 (Q1-2) Total
DfE grant allocation per area £75,000 £150,000 £75,000 £300,000
Note: This excludes the champion funding which was provided to a subset of areas in 2013/14. It also does not reflect the £18,750 core grant funding provided to the Isles of Scilly in the first two quarters of 2013/14. Source: Department for Education
4
Department for Education (2011) Support and aspiration: A new approach to special educational needs and disability: Pathfinder Specification and Application Pack
5
39
The slower than expected start-up of some pathfinders resulted in substantial under-spend in year 1, with differences of up to £48,200 between the funding allocation and actual costs. These pathfinders were able to apply for an uplift of their year 2 funding, and most took up this offer. Table 2 sets out the average funding allocation (including both DfE grant funding allocation and additional funding leveraged by the areas) and the average pathfinder costs (or spend)6.
[image:39.595.56.526.271.428.2]A number of areas leveraged considerable amounts of additional funding from their local authority in 2013/14 to support the roll out of their approach. Overall, additional funding as a proportion of total funding increased from 1% in 2011/12 to 3% in 2012/13 and 13% in the first two quarters of 2013/14.
Table 2 Average funding allocation and spend over first two years of the pathfinder
2011/12 (Q3-4) 2012/13 (Q1-4) 2013/14 (Q1-2)
Funding allocation Actual spend Funding allocation Actual spend Funding allocation Actual spend
Mean £75,780 £64,901 £164,981 £154,262 £86,841 £64,195
Median £75,000 £73,176 £165,000 £160,510 £75,000 £64,953
Minimum £75,000 £26,800 £150,000 £94,621 £75,000 £10,530
Maximum £80,750 £78,774 £235,000 £202,500 £250,000 £112,000
Note: Funding allocation includes DfE grant and additional funding leveraged for the pathfinder. N=29 pathfinder areas7 Source: SQW monitoring data analysis
The trajectory of spend over time varied by area. Figure 22 shows the breadth and variation in the profile of spend by illustrating the spend profiles of a range of pathfinder areas, where each area is reflected by a coloured line. The profiles of spend from areas with the lowest, 7th lowest, 14th lowest, 21st lowest and highest spend by the end of Q2 2013/14 are included. A number of areas appeared to ‘pause’ or slow down following the end of 2012/13 to reflect on their approach to that point, before ramping up again from Quarter 2 (July – September) 2013/14. This is demonstrated by the line of the area with the 21st lowest spend.
6
This excludes staff time provided in kind to the pathfinder, which is discussed later.
7
The cost data analysis is based on 29 area monitoring responses from the 31 pathfinder local authorities. Two pathfinder areas have been excluded from the cost analysis; one because the quality of their cost data could not be verified; and another because their funding allocation was one quarter of the size of the other areas and thus inclusion of this data would have skewed the analysis. One consortium of two authorities initially pooled their grant funding but they have since begun to spend their allocations separately.
40
Figure 22 Profile of actual spend to September 2013 across a distribution of five of the pathfinder areas
Note: Actual spend recorded at the end of every quarter and the diagram joins up these points. The chart shows the profile of spend for five of the pathfinder areas from across the spectrum in terms of their level of spend. This includes the areas that by Q2 2013/14 had the lowest, 7th lowest, 14th lowest, 21st lowest and highest levels of actual spend, in order to demonstrate the variation in spend and profile of spend across areas. N=5 pathfinder areas Source: SQW monitoring data analysis
There was substantial variation in the extent to which individuals in pathfinder areas spent time on pathfinder activities above and beyond that funded through DfE or
additional funding (as described above). This is illustrated by the differences in Table 3, which shows that in the most recent quarter, pathfinder areas contributed a median of 312 days of in-kind time to deliver pathfinder activities, with a range across areas of between 13 and 971 days. These figures were largely similar to the data submitted during 2012/13, implying that pathfinder areas had continued to utilise the expertise of existing staff and professionals.
Table 3 Average in-kind staff days spent on pathfinder activities over first two years of the pathfinder
2011/12 (Q3-4) 2012/13 (Q1-4) 2013/14 (Q1-2)
Mean 178 days 690 days 364 days
Median 110 days 671 days 312 days
Minimum 0 days 9 days 13 days
Maximum 693 days 1,618 days 971 days
[image:40.595.62.525.647.763.2]41
Source: SQW monitoring data analysis
Figure 23 illustrates the proportion of financial and in-kind spend on each type of activity (split by the CDF themes) across the pathfinders. This shows that the proportion of all pathfinder financial and in-kind costs attributed to organisational engagement and cultural change decreased after the first six months of the pathfinder, but beyond this the
[image:41.595.55.540.203.688.2]financial and in-kind costs attributed to different types of activity did not vary substantially over the duration of the programme.
Figure 23 Financial and in kind costs by type of activity
N=29 pathfinder areas Source: SQW monitoring data analysis
42
and lowest area’s spend. The middle line in each box indicates the medianspend on that element, while the circle represents the mean average spend.
[image:42.595.53.527.252.671.2]Substantial pathfinder financial costs were attributed to cross-cutting spend, implying joint development and working within areas. Where costs were attributed to agencies they were predominantly incurred through education. However, some pathfinders also had substantial in-kind input from children’s social care, specialist health and adult social care. The VCS was also involved in each area, either through assigned pathfinder funding or provision of in-kind staff time.
Figure 24 Breakdown of costs from first 2 years of the pathfinder by CDF theme and by the service that incurred the cost
43
Estimating the costs of setting up the pathfinder approach
Deriving a daily staff cost for conversion of in-kind costs
To estimate the total costs associated with setting up the pathfinder approach we needed to convert in-kind staff contributions which were not formally funded to support
[image:43.595.67.526.191.359.2]development into financial costs. Table 4 sets out the unit costs of provision used.
Table 4 Unit costs of staff time
Hourly rate (including onset cost) Day rate (including onset cost)
Senior Manager (e.g. Head of Service) £25.03 £187.73
Junior Manager (e.g. Operational Manager) £24.03 £180.23
Clerical Worker (e.g. Administrator) £12.93 £97.13
Day rate used for unit cost calculations
(£187.73 * 0.2) + (£180.23 * 0.6) + (£97.13 * 0.2)
£22.01 £165.08
Notes: DfE derived hourly unit costs from Office for National Statistics, 2010, Annual Survey of Hours and Earnings (ASHE,)
http://www.ons.gov.uk/ons/publications/re-reference-tables.html?edition=tcm%3A77-227495 SQW converted the hourly rate into a day rate based upon the assumption of a 7.5 hours working day Source: Adapted from DfE
In-kind time was monetised on a weighted basis to reflect time inputs from across three levels of staff (heads of service, operational managers and administrators), who were all perceived to have contributed to support the development of the pathfinder approach. This weighting was based on an assumed 20:60:20 split between the three levels of staff respectively, which therefore amounts to a unit cost of £22.01 per hour and £165.08 per day.
Estimated costs of set up
44
Table 5 Overarching costs (first 2 years)
Mean Median Minimum Maximum
A In-kind staff days 1,232 1,039 40 2,789
B Financial expenditure £283,358 £284,827 £210,401 £389,500
C In-kind expenditure
(A * Derived day rate) £203,416 £171,436 £6,603 £460,375
Note: Figures rounded to include no decimal places N=29 pathfinder areas Source: SQW monitoring data analysis
The median estimated total cost per area was £454,4128 over the first two years of the pathfinder, including both financial and in-kind expenditure. However this varied substantially by area, from a minimum of £267,584 in one area to a maximum of
£744,104 in another.
Summary
This chapter updates the costs of developing the pathfinder approach originally
calculated for the Impact Evaluation Research Report. It includes two additional quarters of data (Q1 and Q2 of 2013/14)
The median estimated total development cost per area was £454,412 over the first two years of the pathfinder, including both financial and in-kind costs. However this varied substantially by area, from a minimum of £267,584 in one area to a maximum of £744,104 in another.
The trajectory of financial costs varied by area. A number of areas appeared to ‘pause’ or slow down following the end of 2012/13 to reflect on their progress to that point, and then ramp up their activity again from Quarter 2 (July – September) 2013/14
Overall, the proportion of financial and in-kind costs associated with organisational engagement and cultural change was highest within the first six months of the
programme. Meanwhile proportionate costs associated with the remaining themes of the CDF remained relatively stable across the duration of the programme
Substantial pathfinder financial costs were attributed to cross-cutting spend, implying joint development and working within areas. Costs attributed to agencies were most
commonly incurred through education.
8 This figure was derived as the median of each individual pathfinder area’s total financial and in-kind
45
Annex A: The Common Delivery Framework
The evaluation of the individual budgets pilot for families with disabled children illustrated the effectiveness of the Common Delivery Model (CDM)9, which provided a framework to inform and assess the development of the pilots. The CDM was revised for use in the pathfinder evaluation, where it has been termed the Common Delivery Framework (or the CDF).
The CDF (see Figure 25) has been developed to enable structured data collection and assessment of delivery and costs at different stages of the pathfinder process. It sets out a series of elements which it is anticipated each pathfinder will need to address as part of developing its local activity. Progress was baselined and has been being tracked and reported against the themes/elements of the CDF for the first two years of the
programme.
Figure 25 Scale against which progress was judged
9
More information can be found at
https://www.education.gov.uk/publications/standard/publicationDetail/Page1/DFE-RR145
THEME: ORGANISATIONAL ENGAGEMENT AND CULTURAL CHANGE
Element Progress measures
1 – ENGAGEMENT OF RELEVANT STAKEHOLDERS
Project Board/Governance structure A clear set of objectives have been agreed Development of a project plan
Commitment from social care to share resources to develop and deliver the pathfinder
Commitment from education to share resources to develop and deliver the pathfinder
Commitment from health to share resources to develop and deliver the pathfinder
Designated an overall lead(s) for the pathfinder
Engagement of the VCS in the development of the pathfinder Engagement of parent carers in the development of the
pathfinder
Engagement of a representation of children and young people in the development of the pathfinder
2 – RECRUITMENT OF DESIGNATED STAFF
Project development team
46
3 – CHANGE MANAGEMENT
Progress developing and delivering of change management process as part of the pathfinder
4 – MARKET DEVELOPMENT AND THE LOCAL OFFER
Consultation with provider market during the development of your pathfinder
Development of the local offer
THEME: ENGAGING AND INVOLVING FAMILIES
5 – AWARENESS RAISING WITH FAMILIES
Raising awareness with prospective families
Recruitment of families and young people to take part in the pathfinder programme
6 – PEER SUPPORT Delivery of peer support to the parent carers participating in the pathfinder
Delivery of peer support to the children and young people participating in the pathfinder
THEME: SETTING UP THE INFRASTRUCTURE
7 – MAPPING OF SINGLE
ASSESSMENT AND PLAN PATHWAY
Progress developing the assessment and single plan pathway
8 – DEVELOPMENT OF PERSONAL BUDGETS
Development and implementation of a resource and funding mechanism
Support planning
Development of a spectrum of choice for the management of PB funds
9 – COORDINATION AND DELIVERY OF THE PATHFINDER APPROACH
Progress on the coordination and delivery of the pathfinder approach (i.e. the single assessment and plan pathway)
10 –
DEVELOPMENT OF IT RESOURCES
Development of appropriate management information Development of appropriate IT application to store
assessment/plans
Development of inter-agency information sharing protocols Gaining family consent for information sharing
47
Source: SQW
THEME: SAFEGUARDING AND RISK MANAGEMENT
11 –
SAFEGUARDING
Review of the relevant safeguarding procedures to ensure they are appropriate for the pathfinder
Communication of the resultant safeguarding procedures to professionals
Communication of the resultant safeguarding procedures to families
48
Annex B: Work undertaken to inform this programme
report
Figure 26 provides a summary of the research that forms the basis of this report, which is described in more detail below.
Figure 26 Research undertaken to inform the December 2013 Report
Research Method Description
Monitoring Receipt of eight complete sets of monitoring submissions from all pathfinder areas at the end of each quarter for the first two years of the programme
Reviewed each set of monitoring submissions and undertook verification exercises with several areas in cases where data anomalies had been identified
Finalised each dataset and undertook an analysis of the data
The monitoring tool
The monitoring tool acted as the primary mechanism to gather consistent process and cost information from each of the pathfinder areas. Figure 27 presents a summary of the data that was collected and presented in this report.
Figure 27 Summary of the monitoring requirements
Monitoring
category Brief description
Financial and in-kind cost
information
This tool was designed to provide an assessment of the cost of set up and implementation of each pathfinder area. This includes annual collation of the:
Financial expenditure and in-kind resource required to deliver the pathfinder
Information on any additional sources of funding that is required to deliver the pathfinder
Self- reported progress
This tool was designed to provide a quarterly indication of the process-related development and delivery of each pathfinder site.
Progress is being measured against the pathfinder Common Delivery Framework (the CDF) which is described below in more detail. The CDF is made up of the following elements:
Organisational engagement and cultural change Engaging and involving families
Setting up the infrastructure
49 Monitoring
category Brief description
Progress was judged on a scale from ‘not yet begun’ through to ‘full implementation’ as shown below.
The tool provided an indication of the phasing used to develop and implement each element and the length of time it takes to set up.
Source: SQW
Data collection and analysis for the December 2013 report
This report presents an analysis of the quarter 2 2013/14 monitoring submissions from all pathfinder areas and compares this with the position reported by areas at the end of the first phase of the programme – quarter 4 2012/13. This included self-reported progress data and cost related data.
The data collection and analysis process was undertaken as follows:
A complete set of secure monitoring submissions were received in both early April 2013 and early October 2013
The data sets were cleaned and a verification exercise was undertaken. Anomalies were identified through a process involving:
checking whether areas had filled in all relevant fields of the monitoring tool
looking for anomalies by comparing responses – for instance where an area’s actual costs were particularly high or low compared to their grant, where an area appeared to have incurred no in kind costs, or where they appeared to have moved backwards (e.g. from having parent carers engaged in the governance of the pathfinder to not engaged)
reconciling ‘other’ responses into predefined categories as appropriate.
Anomalies were discussed with the individual areas by phone or email, and the data was then amended where appropriate
The data sets were finalised and a frequency based analysis was undertaken, which is presented in the tables and figures included in the report.
= Development
not yet begun =
Early stage development = Partial development = Full implementation =
Already in place prior to the
Pathfinder
Movement left to right within the diagrams indicates increasing
50
The analysis of the financial and in-kind cost information calculated descriptive statistics10 based on: the funding allocation (including DfE funding and additional leveraged funding); actual financial costs; staff days provided in-kind; and the difference between funding and financial costs. This enabled us to understand how the costs varied across areas. We then used the same techniques to analyse the breakdown of actual financial and in-kind costs by type of activity (split by the Common Delivery Framework themes11) and by service.
[image:50.595.83.532.282.478.2]Further to this, staff costs derived by DfE12 were used to estimate a monetary cost of in-kind staff days. This meant that it was possible to estimate the expenditure associated with the contributions of staff that were not formally funded to support development. Table 6 illustrates the unit costs used.
Table 6 Unit costs of provision
Hourly rate (including onset cost) Day rate (including onset cost)
Senior Manager (e.g. Head of Service) £25.03 £187.73
Junior Manager (e.g. Operational Manager) £24.03 £180.23
Clerical Worker (e.g. Administrator) £12.93 £97.13
Day rate used for unit cost calculations
(£187.73 * 0.2) + (£180.23 * 0.6) + (£97.13 * 0.2)
£22.01 £165.08
Notes: DfE derived hourly unit costs from Office for National Statistics, 2010, Annual Survey of Hours and Earnings (ASHE),
http://www.ons.gov.uk/ons/publications/re-reference-tables.html?edition=tcm%3A77-227495 SQW converted the hourly rate into a day rate based upon the assumption of a 7.5 hours working day Source: Adapted from DfE Evidence Pack
In-kind time was monetised on a weighted basis to reflect time inputs from across three levels of staff (heads of service, operational managers and administrators), who were all perceived to have contributed in-kind time to support the development of the pathfinder approach. This weighting was based on an estimated 20:60:20 split between the three levels of staff respectively, which therefore amounts to a unit cost of £22.01 per hour and £165.08 per day.
10
Descriptive statistics calculated included the mean, standard deviation, median, minimum, maximum and interquartile range.
11
The Common Delivery Framework (CDF) was developed to enable structured data collection around the delivery and costs at different stages of the pathfinder process. It set out a series of themes and elements that it was anticipated each pathfinder would need to address as part of developing its local activity.
12
51
52 © SQW [March 2014]
Reference: DFE- RR330
ISBN: 978-1-78105-311-9
The views expressed in this report are the authors’ and do not necessarily reflect those of the Department for Education.
Any enquiries regarding this publication should be sent to us at:
[email protected] or www.education.gov.uk/contactus