• No results found

SPEL Data for EU Agriculture, 1985 1995

N/A
N/A
Protected

Academic year: 2020

Share "SPEL Data for EU Agriculture, 1985 1995"

Copied!
316
0
0

Loading.... (view fulltext now)

Full text

(1)

2

eurostat

SPEL-DATEN FUR DIE LANDWIRTSCHAFT DER EU

SPEL-DATA FOR EU AGRICULTURE

DONNÉES SPEL POUR L'AGRICULTURE DE L'UE

1985-1995

(2)

eurostat

STATISTISCHES AMT DER EUROPAISCHEN GEMEINSCHAFTEN

STATISTICAL OFFICE OF THE EUROPEAN COMMUNITIES

OFFICE STATISTIQUE DES COMMUNAUTÉS EUROPÉENNES

L-2920 Luxembourg — Tél. (352) 43 01-1 — T é l e x COMEUR LU 3423

B-1049 Bruxelles, rue de la Loi 200 — Tél. (32-2) 299 11 11

Eurostat hat die Aufgabe, den

Informa-tionsbedarf der Kommission und aller am

Aufbau des Binnenmarktes Beteiligten

mit Hilfe des europäischen statistischen

Systems zu decken.

Um der Öffentlichkeit die große Menge an

verfügbaren Daten zugänglich zu machen

und Benutzern die Orientierung zu

erleichtern, werden zwei Arten von

Publi-kationen angeboten: Statistische

Doku-mente und Veröffentlichungen.

Statistische Dokumente sind für den

Fachmann konzipiert und enthalten das

ausführliche Datenmaterial:

Bezugs-daten, bei denen die Konzepte allgemein

bekannt, standardisiert und

wissenschaft-lich fundiert sind. Diese Daten werden in

einer sehr tiefen Gliederung dargeboten.

Die Statistischen Dokumente wenden

sich an Fachleute, die in der Lage sind,

selbständig die benötigten Daten aus der

Fülle des dargebotenen Materials

auszu-wählen. Diese Daten sind in gedruckter

Form und/oder auf Diskette,

Magnet-band, CD-ROM verfügbar. Statistische

Dokumente unterscheiden sich auch

optisch von anderen Veröffentlichungen

durch den mit einer stilisierten Graphik

versehenen weißen Einband.

Veröffentlichungen wenden sich an eine

ganz bestimmte Zielgruppe, wie zum

Beispiel an den Bildungsbereich oder an

Entscheidungsträger in Politik und

Ver-waltung. Sie enthalten ausgewählte und

auf die Bedürfnisse einer Zielgruppe

abgestellte und kommentierte

Informa-tionen. Eurostat übernimmt hier also eine

Art Beraterrolle.

Für einen breiteren Benutzerkreis gibt

Eurostat Jahrbücher und periodische

Veröffentlichungen heraus. Diese

enthal-ten statistische Ergebnisse für eine erste

Analyse sowie Hinweise auf weiteres

Datenmaterial für vertiefende

Unter-suchungen. Diese Veröffentlichungen

werden in gedruckter Form und in

Daten-banken angeboten, die in Menütechnik

zugänglich sind.

Um Benutzern die Datensuche zu

erleich-tern, hat Eurostat Themenkreise, d. h.

eine Untergliederung nach Sachgebieten,

eingeführt. Daneben sind sowohl die

Statistischen Dokumente als auch die

Veröffentlichungen in bestimmte Reihen,

wie zum Beispiel „Jahrbücher",

„Kon-junktur", „Methoden", untergliedert, um

den Zugriff auf die statistischen

Informa-tionen zu erleichtern.

Y. Franchet

Generaldirektor

It is Eurostat's responsibility to use the

European statistical system to meet the

requirements of the Commission and all

parties involved in the development of the

single market.

To ensure that the vast quantity of

ac-cessible data is made widely available,

and to help each user make proper use of

this information, Eurostat has set up two

main categories of document: statistical

documents and publications.

The statistical document is aimed at

spe-cialists and provides the most complete

sets of data: reference data where the

methodology Is well-established,

stand-ardized, uniform and scientific. These

data are presented in great detail. The

statistical document is intended for

ex-perts who are capable of using their own

means to seek out what they require. The

information is provided on paper and/or

on diskette, magnetic tape, CD-ROM. The

white cover sheet bears a stylized motif

which distinguishes the statistical

docu-ment from other publications.

The publications proper tend to be

com-piled for a well-defined and targeted

public, such as educational circles or

political and administrative

decision-makers. The information in these

docu-ments is selected, sorted and annotated

to suit the target public. In this instance,

therefore, Eurostat works in an advisory

capacity.

Where the readership is wider and less

well-defined, Eurostat provides the

infor-mation required for an initial analysis,

such as yearbooks and periodicals which

contain data permitting more in-depth

studies. These publications are available

on paper or in videotext databases.

To help the user focus his research,

Eurostat has created 'themes', i.e. subject

classifications. The statistical documents

and publications are listed by series: e.g.

yearbooks, short-term trends or

method-ology in order to facilitate access to the

statistical data.

Y. Franchet

Director-General

Pour établir, évaluer ou apprécier les

dif-férentes politiques communautaires, la

Commission européenne a besoin

d'infor-mations.

Eurostat a pour mission, à travers le

sys-tème statistique européen, de répondre

aux besoins de la Commission et de

l'en-semble des personnes impliquées dans

le développement du marché unique.

Pour mettre à la disposition de tous

l'im-portante quantité de données accessibles

et faire en sorte que chacun puisse

s'orienter correctement dans cet

ensem-ble, deux grandes catégories de

docu-ments ont été créées: les docudocu-ments

statistiques et les publications.

Le document statistique s'adresse aux

spécialistes. Il fournit les données les plus

complètes: données de référence où la

méthodologie est bien connue,

standar-disée, normalisée et scientifique. Ces

données sont présentées à un niveau très

détaillé. Le document statistique est

des-tiné aux experts capables de rechercher,

par leurs propres moyens, les données

requises. Les informations sont alors

disponibles sur papier et/ou sur disquette,

bande magnétique, CD-ROM. La

couver-ture blanche ornée d'un graphisme stylisé

démarque le document statistique des

autres publications.

Les publications proprement dites

peu-vent, elles, être réalisées pour un public

bien déterminé, ciblé, par exemple

l'enseignement ou les décideurs

politi-ques ou administratifs. Des informations

sélectionnées, triées et commentées en

fonction de ce public lui sont apportées.

Eurostat joue, dès lors, le rôle de

conseil-ler.

Dans le cas d'un public plus large, moins

défini, Eurostat procure des éléments

nécessaires à une première analyse, les

annuaires et les périodiques, dans

les-quels figurent les renseignements

adé-quats pour approfondir l'étude. Ces

publications sont présentées sur papier

ou dans des banques de données de type

vidéotex.

Pour aider l'utilisateur à s'orienter dans

ses recherches, Eurostat a créé les

thèmes, c'est-à-dire une classification

par sujet. Les documents statistiques et

les publications sont répertoriés par

série — par exemple, annuaire,

conjonc-ture, méthodologie — afin de faciliter

l'accès aux informations statistiques.

(3)

SPEL-DATEN FÜR DIE LANDWIRTSCHAFT DER EU

SPEL-DATA FOR EU AGRICULTURE

DONNÉES SPEL POUR L'AGRICULTURE DE L'UE

1985-1995

Themenkreis / Theme / Thème

Land­ und Forstwirtschaft, Fischerei / Agriculture, forestry and fisheries / Agriculture, sylviculture et pêche

Reihe / Series / Série

Konten und Erhebungen / Accounts and surveys / Comptes et enquêtes

(4)

Bibliographische Daten befinden sich am Ende der Veröffentlichung.

Cataloguing data can be found at the end of this publication.

Une fiche bibliographique figure à la fin de l'ouvrage.

Für alle Informationen über diese Veröffentlichung wenden Sie sich bitte an:

For all information concerning this publication, contact:

Pour toute information concernant cette publication, s'adresser à:

Eurostat — Luxembourg — Tel. (352) 43 01-32040

Luxembourg: Office des publications officielles des Communautés européennes, 1996

ISBN 92-827-5787-0

© EGKS-EG-EAG, Brüssel · Luxemburg, 1996

Nachdruck — ausgenommen zu kommerziellen Zwecken — mit Quellenangabe gestattet.

© ECSC-EC-EAEC, Brussels · Luxembourg, 1996

Reproduction is authorized, except for commercial purposes, provided the source is acknowledged.

©CECA-CE-CEEA, Bruxelles · Luxembourg, 1996

Reproduction autorisée, sauf à des fins commerciales, moyennant mention de la source.

Printed in Belgium

(5)

Inhaltsverzeichnis

Verwendete Abkürzungen 5

Glossarium in drei Sprachen 9

1. Einleitung 17

1.1. Inhalt der Veröffentlichung 17

1.2. Allgemeine Merkmale des SPEL-Ansatzes 18

1.3. Basissystem 19

1.4. Kurzfristprognose- und Simulationssystem 19

2. Zusammenfassung der Ergebnisse 21

3. Sektorale Entwicklungen in der Europäischen Union und den Mitgliedstaaten 35

3.1. Sektorale Wertschöpfung 37

3.2. Bruttoproduktion und Vorleistungseinsatz 47

3.2.1. Werte zu laufenden Preisen 49

3.2.2. Werte zu konstanten Preisen 57

3.2.3. Durchschnittspreise (Unit values) 65

4. Produktion, Vorleistungseinsatz und Wertschöpfung nach Produktionsaktivitäten in

der Europäischen Union und ihren Mitgliedstaaten 73

4.1. Getreide 75

4.2. Hülsenfrüchte 91

4.3. Kartoffeln 105

4.4. Zuckerrüben 121

4.5. Ölsaaten 135

4.6. Oliven zur Ölgewinnung 149

4.7. Gemüse 157

4.8. Obst 173

4.9. Wein 189

4.10. Milchkühe 201

4.11. Mast von erwachsenen männlichen Rindern und von Kälbern 217

4.12. Schweinemast 233

4.13. Geflügelmast 249

4.14. Legehennen 265

4.15. Schafe- und Ziegen zu Mast 281

(6)

Table of contents

Abbreviations used 7

Glossarium in three languages 9

1. Introduction 23

1.1. Contents of the publication 23

1.2. General characteristics of the SPEL approach 24

1.3. Base System 24

1.4. Short-term Forecast and Simulation System 25

2. Summary of the results 26

3. Sectoral developments in the European Community and its Member States 35

3.1. Sectoral value-added 37

3.2. Gross output and intermediate consumption 47

3.2.1. Values at current prices 49

3.2.2. Values at constant prices 57

3.2.3. Unit values 65

4. Output, intermediate consumption and value-added by production activities in the

European Union and its Member States 73

4.1. Cereals 75

4.2. Pulses 91

4.3. Potatoes 105

4.4. Sugar beet 121

4.5. Oilseeds 135

4.6. Olives for oil 149

4.7. Vegetables 157

4.8. Fruit 173

4.9. Wine 189

4.10. Dairy cows 201

4.11. Male adult cattle and calves for fattening 217

4.12. Pigs for fattening 233

4.13. Poultry for fattening 249

4.14. Laying hens 265

4.15. Sheep and goats for fattening 281

(7)

Table des matières

Abréviations employées 8

Glossaire en trois langues 9

1. Introduction 29

1.1. Contenu de la publication 29

1.2. Caractéristiques générales de l'approche SPEL 30

1.3. Système de base 30

1.4. Système de prévision et de simulation à court terme 31

2. Présentation récapitulative des résultats 32

3. Développements sectoriels dans l'Union européenne et dans ses Etats membres 35

3.1. Valeur ajoutée sectorielle 37

3.2. Production brute et consommation intermédiaire 47

3.2.1. Valeursen prix courants 49

3.2.2. Valeurs en prix constants 57

3.2.3. Valeurs unitaires 65

4. Production, consommation intermédiaire et valeur ajoutée par activité de production

dans l'Union européenne et ses Etats membres 73

4.1. Céréales 75

4.2. Légumes secs 91

4.3. Pommes de terre 105

4.4. Betteraves sucrières 121

4.5. Oléagineux 135

4.6. Olives pour huile 149

4.7. Légumes 157

4.8. Fruits 173

4.9. Vin 189

4.10. Vaches laitières 201

4.11. Bovins adultes mâles et veaux à l'engraissement 217

4.12. Porcins à l'engraissement 233

4.13. Volaille à l'engraissement 249

4.14. Poules pondeuses 265

4.15. Ovins et caprins à l'engraissement 281

(8)

Verwendete Abkürzungen

ABTA

BFR

BIP

BL

BM

BS

BWS

D11

D16

DK

DKR

DM

DR

E

ECU

ESC

EUR 12

F

FF

GAP

GR

ha

hd

HFL

I

IRL

IRL

JAE

khd

KLIT

LGR

Mrd.

NL

NW

NWS

Ρ

PTA

SFSS

SPEL(/EU)

UK

UKL

Activity­based Table of Account (=aktivitätsdifferenzierte Gesamtrechnungstabelle)

Belgischer Franken

Bruttoinlandprodukt

Belgien & Luxemburg

Basismodell

Basissystem

Bruttowertschöpfung

Bundesrepublik Deutschland, Gebietsstand vor dem 3.10.1990

Bundesrepublik Deutschland, Gebietsstand nach dem 3.10.1990

Dänemark

Dänische Krone

Deutsche Mark

Drachme

Spanien

Europäische Währungseinheit

Portugiesischer Escudo

Europäische Union

Frankreich

Französischer Franken

Gemeinsame Agrarpolitik

Griechenland

Hektar

Köpfe

Holländischer Gulden

Italien

Irisches Pfund

Irland

Jahresarbeitseinheit

1000 Köpfe

1000 italienische Lira

Landwirtschaftliche Gesamtrechnung

Milliarden

Niederlande

Nationale Währung

Nettowertschöpfung

Portugal

Spanische Peseta

Kurzfristprognose­ und Simulationssystem

Sektorales Produktions­ und Einkommensmodell der Landwirtschaft (der Europäischen

Union)

(9)

Abbreviations used

ABTA

AWU

BFR

BL

BM

BS

CAP

D11

D16

DK

DKR

DM

DR

E

EAA

ECU

ESC

EUR 12

F

FF

GDP

GR

GVA

ha

hd

HFL

I

intermed.

IRL

IRL

khd

KLIT

mio

m. p.

NC

NL

NVA

Ρ

PTA

SFSS

SPEL(/EU)

UK

UKL

Activity-based Table of Account

Annual work unit

Belgian franc

Belgium & Luxembourg

Base Model

Base System

Common Agricultural Policy

Federal Republic of Germany, territory before 3.10.1990

Federal Republic of Germany, territory after 3.10.1990

Denmark

Danish crown

German mark

Greek drachma

Spain

Economic Accounts for Agriculture

European currency unit

Portuguese escudo

European Union

France

French franc

Gross domestic product

Greece

Gross value added

Hectare

head

Dutch guilder

Italy

intermediate

Ireland

Irish pound

1000 heads

1000 Italian lira

million

market prices

National currency

Netherlands

Net value added

Portugal

Spanish Peseta

Short-term Forecast and Simulation System

Sectoral Production and Income Model for Agriculture (of the

United Kingdom

Pound sterling

(10)

Abréviations employées

ABTA

Activity­based Table of Account (=tableau de répartition des comptes par activité)

BFR

Franc belge

BL

Belgique & Luxembourg

BM

Modèle de base

BS

Système de base

CEA

Comptes économiques de l'agriculture

D11

République Fédérale Allemande, territoire avant le 3.10.1990

D16

République Fédérale Allemande, territoire après le 3.10.1990

DK

Danemark

DKR

Couronne danoise

DM

Mark allemand

DR

Dragme grecque

E

Espagne

ECU

Unité monétaire européenne

ESC

Escudo portugais

EUR 12

Union européenne

F

France

FF

Franc française

GR

Grèce

ha

Hectare

HFL

Florin néerlandais

I

Italie

IRL

Irlande

IRL

Livre irlandaise

KLIT

1000 Lires italienne

MN

Monnaie nationale

NL

Pays­Bas

Ρ

Portugal

PAC

Politique Agricole Commune

PIB

Produit intérieur brut

PTA

Peseta espagnole

SFSS

Système de prévision et de simulation à court terme

SPEL/(EU) Modèle de la production et du revenu du secteur agricole (de l'Union européenne)

UK

Royaume­Uni

UKL

Livre sterling

(11)

Glossarium in drei Sprachen

Glossarium in three languages

(12)

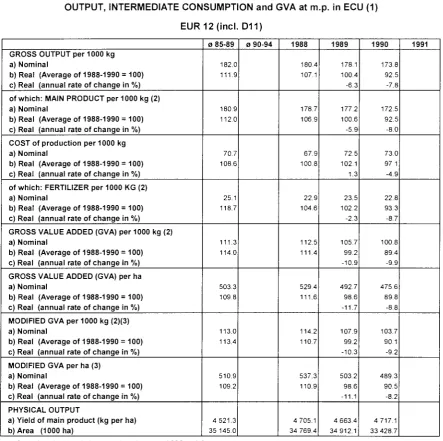
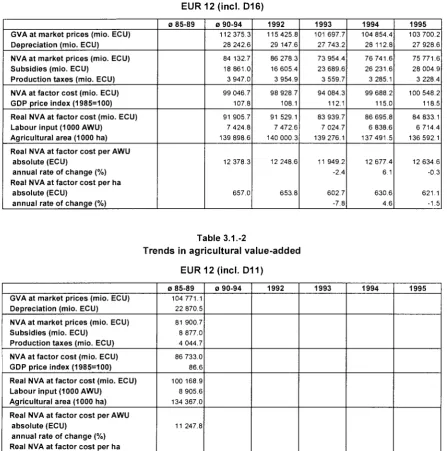
Tabellen in Kapitel 3.1. - Tables of chapter 3.1. - Tableaux du chapitre 3.1.

Tabellentitel

Entwicklung der

landwirtschaftlichen

Wertschöpfung

Zeilenbeschreibungen

BWS zu Marktpreisen

Abschreibungen

NWS zu Marktpreisen

Subventionen

Produktionssteuern

NWS zu Faktorkosten

BIP-Preisindex

Reale NWS zu Faktorkosten

Arbeitseinsatz

Landwirtschaftliche Fläche

Reale NWS zu Faktorkosten

je JAE

Reale NWS zu Faktorkosten

pro ha

Absolut

Jährliche Wachstumsrate

Table-heading

Trends in agricultural

value-added

Row descriptions

GVA at market prices

Depreciation

NVA at market prices

Subsidies

Production taxes

NVA at factor cost

GDP price index

Real NVA at factor cost

Labour input

Agricultural area

Real NVA at factor cost per

AWU

Real NVA at factor cost per

ha

Absolute

Annual rate of change

Titre de tableau

Evolution de la Valeur

Ajoutée agricole

Description des lignes

VAB aux prix du marché

Amortissements

VAN aux prix du marché

Subventions

Impôts liés à la production

VAN au coût des facteurs

Indice des prix du PIB

VAN réelle au coût des

facteurs

Main-d'oeuvre agricole

Superficie agricole

VAN réelle au coût des

facteurs par UTA

VAN réelle au coût des

facteurs par ha

Absolue

Taux de variation annuel

(13)

Tabellen in Kapitel 3.2. - Tables of chapter 3.2. - Tableaux du chapitre 3.2.

Tabellentitel

Erzeugung und

Vorleistungseinsatz zu

laufenden Preisen

Erzeugung und

Vorleistungseinsatz zu

konstanten Preisen von 1990

Durchschnittspreise für

Erzeugnisse und

Vorleistungen

Tabellenuntertitel

Bruttokonzept SPEL:

jährliche Wachstumsrate

Zeilenbeschreibungen

PFLANZLICHE

ERZEUGUNG

Gesamte pflanzliche

Erzeugung

Getreide (außer Reis)

Hülsenfrüchte

Kartoffeln

Zuckerrüben

Ölsaaten

Oliven zur ölgewinnung

Obst und Gemüse

Wein

Sonstige pflanzliche

Erzeugnisse

Table-heading

Output values and

intermediate consumption at

current prices

Output values and

intermediate consumption at

constant prices 1990

Unit values in output and

intermediate consumption

Sub-heading

Gross concept SPEL: annual

rate of change

Row descriptions

CROP PRODUCTION

Total crop production

Cereals (excl. rice)

Pulses

Potatoes

Sugar beet

Oilseeds

Olives for oil

Fruit and vegetables

Wine

Other crop products

Titre de tableau

Production et consommation

intermédiaire aux prix

courants

Production et consommation

intermédiaire aux prix

constants de 1990

Valeurs unitaires de la

production et de la

consommation intermédiaire

Sous-titre de tableau

Concept brut SPEL: taux de

variation annuel

Description des lignes

PRODUCTION VEGETALE

Production brute végétale

totale

Céréales

Légumes secs

Pommes de terre

Betteraves sucrières

Oléagineux

Olives pour huile

Fruits et légumes

Vin

Autres productions végétales

(14)

Zeilenbeschreibungen

TIERISCHE ERZEUGUNG

Gesamte tierische Erzeugung

Milch

Rind- und Kalbfleisch

Schweinefleisch,

Geflügelfleisch und Eier

Sonstige tierische

Erzeugnisse

VORLEISTUNGEN

Gesamte Vorleistungen

Düngemittel

Sonstiger spezifischer

Vorleistungsaufwand in der

pflanzlichen Erzeugung

Futtermittel

Sonstiger spezifischer

Aufwand in der tierischen

Erzeugung

Sonstige Vorleistungen

Row descriptions

ANIMAL PRODUCTION

Total animal products

Milk

Beef and veal

Pigmeat, poultry and eggs

Other animal products

INTERMED.

CONSUMPTION

Total input items

Fertilizer

Other specific crop inputs

Feedingstuffs

Other specific animal inputs

Other input items

Description des lignes

PRODUCTION ANIMALE

Production animale totale

Lait

Bovins et veaux

Porcs, vollailes et oeufs

Autres productions animales

CONSOMMATIONS

INTERMEDIAIRES

Charges totales

Engrais

Autres charges spécifiques

aux productions végétales

Aliments pour animaux

Autres charges spécifiques

aux production animales

Autres charges

(15)

Tabellen in Kapitel 4 - Tables of chapter 4 - Tableaux du chapitre 4

Tabellentitel

Getreide (außer Reis)

Hülsenfrüchte

Kartoffeln

Zuckerrüben

Ölsaaten

Oliven zur ölgewinnung

Gemüse

Obst

Wein

Milchkühe

Mast von erwachsenen

männlichen Rindern und von

Kälbern

Schweinemast

Geflügelmast

Legehennen

Schafe und Ziegen zur Mast

Tabellenuntertitel

Produktion,

Vorleistungseinsatz und BWS

zu Marktpreisen in NW(1)

Table-heading

Cereals (excl. rice)

Pulses

Potatoes

Sugar beet

Oilseeds

Olives for oil

Vegetables

Fruit

Wine

Dairy cows

Male adult cattle and calves

for fattening

Pigs for fattening

Poultry for fattening

Laying hens

Sheep and goats for fattening

Sub-heading

Output, intermediate

consumption and GVA at m.

p. in NC (1)

Titre de tableau

Céréales

Légumes secs

Pommes de terre

Betteraves sucrières

Oléagineux

Olives pour huile

Légumes

Fruits

Vin

Vaches laitières

Bovins adultes mâles et veaux

à l'engraissement

Porcins à l'engraissement

Volaille à l'engraissement

Poules pondeuses

Ovins et caprins à

l'engraissement

Sous-titre de tableau

Production, consommation

intermédiaire et Valeur

Ajoutée brute aux prix du

marché en MN (1)

(16)

Zeilenbeschreibungen

BRUTTOPRODUKTION je

1000 kg

davon: HAUPTPRODUKT je

1000 kg (2)

PRODUKTIONSKOSTEN je

1000 kg

davon: DÜNGEMITTEL je

1000 kg (2)

BRUTTOWERTSCHÖPFUNG

(BWS)je1000kg(2)

BRUTTOWERTSCHÖPFUNG

(BWS) je ha (2)

MODIFIZIERTE BWS je 1000

kg (2)(3)

MODIFIZIERTE BWS per ha

a) Nominal

b) Real (Durchschnitt

1991-1993 = 100)

b) Real (jährliche

Wachstumsraten in %)

PHYSISCHE ERZEUGUNG

a) Ertrag des Hauptproduktes

(kg je ha)

b) Fläche (1000 ha)

Fußnoten

(1) Reale Werte mit Hilfe des

BIP-Preisindex als

Deflator berechnet

(2) Je 1000 kg des

Hauptprodukts

(3) Beinhaltet Subventionen

der GAP-Reform 1992

Row descriptions

GROSS OUTPUT per 1000

kg

of which: MAIN PRODUCT

per 1000 kg (2)

COST of production per

1000 kg

of which: FERTILIZER per

1000 kg (2)

GROSS VALUE ADDED

(GVA) per 1000 kg (2)

GROSS VALUE ADDED per

ha

MODIFIED GVA per 1000 kg

(2)(3)

MODIFIED GVA per ha

a) Nominal

b) Real (Average of

1991-1993 = 100)

c) Real (annual rate of

change in %)

PHYSICAL OUTPUT

a) Yield of main product (kg

per ha)

b) Area (1000 ha)

Footnotes

(1) Figures in real terms

calculated by using price

index of GDP as deflator

(2) Per 1000 kg of main

product

(3) Includes subsidies related

to the 1992 reform of the

CAP

Description des lignes

PRODUCTION BRUTE par

1000 kg

dont : PRODUIT PRINCIPAL

par 1000 kg (2)

COÛT de production par

1000 kg

dont: ENGRAIS par 1000 kg

(2)

VALEUR AJOUTÉE BRUTE

(VAB) par 1000 kg (2)

VALEUR AJOUTÉE BRUTE

par ha

VALEUR AJOUTÉE BRUTE

MODIFIÉE par 1000 kg (2)(3)

VALEUR AJOUTÉE BRUTE

MODIFIÉE par ha

a) Nominale

b) Réelle (Moyenne de

1991-1993 = 100)

c) Réelle (taux annuel de

variation en %)

PRODUCTION PHYSIQUE

a) Rendement de produit

principal (kg par ha)

b) Superficie (1000 ha)

Notes de base de page

(1) Les données en terme

réelle sont déflatées sur la

base de l'indice des prix

du PIB

(2) Par 1000 kg de produit

principal

(3) Y compris les subventions

relative à la réforme de la

PAC de 1992

(17)

Tabellen in Kapitel 5. - Tables of chapter 5. - Tableaux du chapitre 5.

Tabellentitel

Pflanzenschutz- und

Düngemitteleinsatz je ha

Zeilenbeschreibungen

PFLANZENSCHUTZ

(1990er Preise in NW)

MINERALISCHE

DÜNGE-MITTEL (1992=100) (1)

MINERALISCHE

STICKSTOFFDÜNGER (kg)

Gesamte landwirtschaftliche

Fläche

Ackerland

Getreide

Sonstige Ackerkulturen

Dauerkulturen

Gras /Weideland

Fußnoten

(1) Volumenindex in 1992er

Preisen

Table-heading

Plant protection and fertilizer

input per ha

Row descriptions

PLANT PROTECTION

(1990 prices in NC)

MINERAL FERTILIZER

(1992=100) (1)

MINERAL NITROGEN

FERTILIZER (kg)

Total agricultural area

Arable land

Cereals

Other crops on arable land

Permanent crops

Grass/grazings

Footnotes

(1) Volume index at 1992

prices

Titre de tableau

Protection des cultures et

charges d'engrais par ha

Description des lignes

PROTECTION DES

CULTURES (MN prix de 1990)

ENGRAIS MINÉRAUX

(1992=100) (1)

ENGRAIS MINÉRAUX

AZOTÉS (kg)

Superficie agricole

Superficie arable

Céréales

Autres végétaux sur superficie

arable

Cultures permanentes

Herbes, prairies

Notes de bas de page

(1) Indice de volumes aux prix

de 1992

(18)
(19)

1. Einleitung

1.1. Inhalt der Veröffentlichung

In der vorliegenden Veröffentlichung werden verschiedene Aspekte von Entwicklungen im

landwirtschaftlichen Sektor behandelt, die zwischen 1985 und 1995 in der Europäischen Union und

ihren Mitgliedstaaten

1

eingetreten sind. Die in der Veröffentlichung enthaltenen Tabellen wurden

anhand der SPEL/EU-Daten (Aktualisierung von November 1995) zusammengestellt. Die

SPEL/EU-Daten geben im Rahmen eines prozeßanalytisches Ansatzes Aufschluß über die

Output-Entstehung und Input-Verwendung in der Landwirtschaft. Sie tragen dem intersektoralen

Output- und Input-Strom zwischen dem landwirtschaftlichen und nichtlandwirtschaftlichen Sektor

ebenso Rechnung wie dem intrasektoralen Output- und Input-Strom zwischen den einzelnen

landwirtschaftlichen Produktionsaktivitäten. Ferner enthalten sie Informationen über die

landwirtschaftliche Bruttowertschöpfung zu Marktpreisen aufgeschlüsselt nach Produktionszweigen.

In Kapitel 1.2. werden die grundlegenden Merkmale des SPEL-Ansatzes erläutert; die Kapitel 1.3.

und 1.4. geben einen Überblick über die Module des Modells, anhand der die

SPEL/EU-Daten erstellt wurden: das Basissystem (BS) und das Kurzfristprognose- und Simulationssystem

(SFSS)

2

.

Kapitel 2 enthält eine zusammenfassende Analyse sektoraler Trends in der Europäischen Union

anhand der Daten, die in den Tabellen von Kapitel 3 bis 5 enthalten sind.

Kapitel 3 bietet eine Übersicht über die Entwicklung der sektoralen Wertschöpfungskomponenten.

Es gibt Aufschluß über die Änderung der Bruttoproduktion und des Vorleistungseinsatzes anhand

der Veränderungsraten der Werte, Volumina und "Unit Values" (Durchschnittspreise) differenziert

nach Produktgruppen oder Inputpositionen.

In Kapitel 4 werden die wichtigsten landwirtschaftlichen Produktionsaktivitäten bzw. Gruppen von

Produktionsaktivitäten behandelt. Dargestellt werden die Entwicklungen bei den Produktionswerten,

dem Vorleistungseinsatz und der Bruttowertschöpfung zu Marktpreisen in den einzelnen

Produktionszweigen. Die Berechnung einer "modifizierten Bruttowertschöpfung", die Schätzungen

der Subventionen umfaßt, die im Rahmen der 1992 beschlossenen Reform der Gemeinsamen

Agrarpolitik eingeführt wurden oder hiervon betroffen sind

3

, ergänzt die Daten über die

Wertschöpfung.

In Kapitel 5 werden abschließend ausgewählte Daten über den Vorleistungseinsatz dargestellt, die

für umweltrelevante Fragestellungen von Interesse sein können. Dabei geht es um den

Pflanzenschutz- und Düngemitteleinsatz je Hektar.

Die Tabellen in dieser Veröffentlichung wurden anhand von standardisierten Auswertungsroutinen

für die SPEL/EU-Daten erzeugt. Die SPEL/EU-Daten sind im Hinblick auf Produktionsaktivitäten,

Produkt- und Inputpositionen sehr viel differenzierter als die Tabellen in der vorliegenden

Veröffentlichung. Der gesamte Satz von SPEL/EU-Daten für den Zeitraum 1973-1995 steht in der

Datenbank NewCronos von Eurostat zur Verfügung und kann externen Benutzern zusammen mit

Die Daten beziehen sich auf das Gebiet der Europäischen Union vor dem 1. Januar 1995 (EUR 12). Die Ergebnisse für

Deutschland beziehen sich bis 1990 auf die alten Bundesländer und ab 1991 auf die alten und die neuen

Bundesländer. Die Ergebnisse auf der Ebene EUR 12 wurden durch Aggregation ermittelt.

Detaillierte methodische Anmerkungen enthält die Veröffentlichung "SPEL System - Methodological Documentation

(Rev. 1) - Vol. 1: Basics, BS, SFSS", die von Eurostat im Januar 1995 veröfftlicht wurde..

Ausgleichszahlungen je Hektar für Getreide, Ölsaaten und Eiweißpflanzen, Prämie für männliche Rinder und

Mutterkühe, Schaf- und Ziegenprämie.

(20)

einem Softwarepaket (CUBX.WIN) zugänglich gemacht werden, das den Benutzern die Abfrage der

Daten ermöglicht. Von Seiten Eurostats erfolgt eine regelmäßige Aktualisierung und Überprüfung.

1.2. Allgemeine Merkmale des SPEL-Ansatzes

Das SPEL-System dient der Beobachtung der aktuellen Lage im Agrarsektor, Ex-post-Analysen

sektoraler Entwicklungen sowie kurz- und mittelfristigen Prognosen und Simulationen der

Auswirkungen alternativer agrarpolitischer Maßnahmen.

Allen SPEL-Modulen liegt der prozeßanalytische Gesamtrechnungsansatz zugrunde:

• Der prozeßanalytische Ansatz stellt eine Unterteilung des Agrarsektors in Produktions- und

Verwendungsaktivitäten dar. Im Rahmen dieses Ansatzes werden produktionsbezogene

Interaktionen innerhalb des Agrarsektors (intrasektorale Ströme) sowie zwischen der

Landwirtschaft und der Nichtlandwirtschaft (intersektorale Ströme) untersucht.

• Dieser Ansatz bietet eine detaillierte Untergliederung der Agrarproduktion in neunundvierzig

Produktionsaktivitäten, sechzig Produktpositionen und dreiunddreißig Vorleistungspositionen.

Die Darstellung der Produkt- und Inputströme wird durch fünfzehn intrasektorale

Verwendungsaktivitäten und eine intersektorale Verwendungsaktivität (Verkäufe/Käufe) ergänzt.

• Durch die Übereinstimmung mit dem Gesamtrechnungsansatz wird die Konsistenz hinsichtlich

physischer und monetärer zyklischer Zusammenhänge gewährleistet und die Vergleichbarkeit

der Daten und Modellergebnisse mit den in der Landwirtschaftlichen Gesamtrechnung (LGR)

verwendeten Definitionen sichergestellt.

Aus dem oben dargestellten Ansatz ergibt sich für jedes dargestellte Jahr und jeden Mitgliedstaat

eine "aktivitätsdifferenzierte Gesamtrechnungstabelle" (ABTA=Activity-based Table of Accounts)

4

.

Eine ABTA schlüsselt den landwirtschaftlichen Produktionsprozess in Ertrags- und

Inputkoeffizienten sowie Anbaufläche und Viehbestand auf. Da in der ABTA ferner die wichtigen

intrasektoralen Produktströme zwischen Produktionsaktivitäten und innerhalb einzelner

Produktionsaktivitäten (z. B. Jungtiere oder Futtermittel) berücksichtigt werden, liefert sie

annähernd realistische Bruttoproduktionswerte. Nach der Aggregation über die

Produktionsaktivitäten ist die Summe der nicht konsolidierten (Brutto-) Ströme des SPEL mit der

Summe der konsolidierten (Netto-) Ströme der LGR, die den Endproduktionswert enthält, identisch.

Die sich daraus ergebende sektorale Bruttowertschöpfung zu Marktpreisen des SPEL stimmt daher

mit den Definitionen der LGR überein.

Eine "Zusätzliche Nachfragekomponente", die die physischen Produktströme von der

Outputenstehung bis zum Endverbrauch verfolgt, ergänzt die angebotsorientierte ABTA. Dabei wird

der Verbrauch der unverarbeiteten landwirtschaftlichen Produkte außerhalb des

landwirtschaftlichen Sektors in verschiedene Verwendungsaktivitäten aufgegliedert: menschlicher

Verbrauch, Futtermittel, Saatgut, industrielle Verwendung, Verarbeitung, Bestandsveränderungen,

Verluste und Ausfuhren. Ferner werden die Versorgungsbilanzen der unverarbeiteten Produkte

(z.B. Raps) mit dem inländischen Aufkommen von Vearbeitungsprodukten (z.B. Rapsöl) über

"Verarbeitungsaktivitäten" verknüpft.

Ein weiteres wesentliches Merkmal des SPEL-Ansatzes besteht darin, daß die Menge statistischer

Daten nicht als endgültig angesehen wird. Die Gleichungssysteme der Module des

SPEL/EU-Modells umfassen mehrere Konsistenzüberprüfungen. Diese sind Ausgangspunkte für kritische

Untersuchungen der Datenbank, die in enger Zusammenarbeit zwischen den Modellbauern und

den Statistikern von Eurostat und aus den Mitgliedstaaten durchgeführt werden.

4
Die ABTA für die Europäische Union insgesamt werden durch Aggregation der ABTA der Mitgliedstaaten berechnet.

(21)

1.3. Basissystem

Das Basissystem erzeugt die SPEL/EU-Daten für den Ex-post-Zeitraum (für die vorliegende

Veröffentlichung die Daten bis 1994). Hierzu kombiniert es verschiedene Informationsquellen:

amtliche Agrarstatistik (hauptsächlich aus den Datenbanken von Eurostat), Daten auf der

Grundlage von Betriebsstichproben, technische und betriebswirtschaftliche Daten.

Das BS erstellt die ABTA und die Zusätzliche Nachfragekomponente jedoch nicht direkt auf der

Grundlage dieser Zeitreihen, da die Unzulänglichkeiten des statistischen Materials eine vorherige

systematische Datenaufbereitung notwendig machen (hauptsächlich Ergänzung fehlender Daten).

Nach Abschluß der Datenaufbereitung integriert das Basismodell (BM) die verschiedenen Arten

(aufbereiteter) Daten zur Erstellung der ABTA und der Zusätzlichen Nachfragekomponente. Die

Input- und Outputkoeffizienten, der Umfang der Produktionsaktivitäten und die Input- und

Outputpreise werden durch rekursive und iterative Ansätze abgeleitet. Klar umrissene

Identitätssysteme und Überprüfungsverfahren stellen die Konsistenz der Ergebnisse sicher.

Die Ergebnisse des Basissystems können für Ex-post-Analysen der Entwicklungen von Produktion

und Vorleistungseinsatz, Produktivitäten, Preisen und Einkommen herangezogen werden. Noch

wichtiger ist jedoch, daß die Ergebnisse des BS Grundlage von kurz- und mittelfristigen Prognosen

und Simulationen sind.

1.4. Kurzfristprognose- und Simulationssystem

Das Kurzfristprognose- und Simulationssystem wurde zur Aktualisierung der SPEL/EU-Daten für

das Jahr 1995 herangezogen.

Bei der Aktualisierung dient das SFSS zur Schließung der statistischen Datenlücke zwischen dem

laufenden Jahr und den für das Vorjahr und das laufende Jahr verfügbaren statistischen Daten.

Beispielsweise wurden durch die "routinemäßige" Anwendung des SFSS im Herbst 1995 die

SPEL/EU-Daten für 1995 erstellt (Diagnose der aktuellen Situation).

Ferner kann das SFSS für Ex-ante-Prognosen und -Simulationen bis zu einem Jahr angewendet

werden. Prognosen, Simulationen und Aktualisierungen mit dem SFSS erfolgen im Rahmen der

ABTA. Normalerweise werden folgende Arbeitsschritte durchgeführt:

• Frühzeitig vorliegende statistische Daten und trendgestützte ökonometrische Analysen der

Outputkoeffizienten, der Umfange der Produktionsaktivitäten, der Erzeuger- und

Vorleistungspreise, der Marktverwendungsaktivitäten und makroökonomischer Variablen

(Wechselkurse, BIP-Deflator usw.) sind die Ausgangspunkte für Kurzfristprognosen. Im Rahmen

des Kurzfristmodells werden diese Informationen verknüpft und konsistente ABTA erstellt. Die

Einkommenskomponenten der LGR sind die zentralen sich daraus ergebenden Variablen. Die in

diesem Stadium erstellten Prognosen werden als Systemvorschläge bezeichnet.

Im Rahmen des zweiten Schrittes werden die Systemvorschläge Experten zur Beurteilung

vorgelegt (z. B. Beamten von Eurostat, die über Fachkenntnisse auf den jeweiligen Gebieten

verfügen). Die Experten können anhand vorliegender Daten (z. B. aufgrund besonderer

Erhebungen, Fallstudien, Frühindikatoren für die Witterungsverhältnisse) oder anhand ihrer

eigenen Beurteilung Verbesserungsvorschläge unterbreiten. Die Expertenvorschläge werden in

das System eingearbeitet.

Nach Berücksichtigung der Expertenvorschläge erstellt das Kurzfristmodell die endgültige

Prognose im Rahmen der Definitionen der ABTA.

(22)

Aus den vorstehenden methodischen Anmerkungen dürfte klar werden, daß die wichtigsten

Variablen für das Kurzfristmodell exogener Art sind. Endogen werden im Rahmen des SFSS nur

diejenigen (begrenzten) Produkt- und Faktorsubstitutionen abgebildet, die kurzfrist möglich sind

(z.B. zwischen verschiedenen Futtermittelkategorien).

(23)

2. Zusammenfassung der Ergebnisse

Die jüngsten agrarsektoralen Entwicklungen in der Europäischen Union (EUR 12) vollziehen sich

unter den Veränderungen der agrarpolitischen Rahmenbedingungen, die mit der 1992

beschlossenen Reform der Gemeinsamen Agrarpolitik (GAP) eingetreten sind. Diese sind

gekennzeichnet durch den ausgeprägten Rückgang der Stützungspreise, den Übergang zu einem

stärker auf direkten, weniger produktionsgebundenen Subventionen basierenden System der

Einkommensstützung sowie die Verstärkung der finanziellen Anreize zur Produktionsbegrenzung

(Flächenstillegung).

Vor diesem Hintergrund zeichnet sich für die Landwirtschaft der Europäischen Union in der 1. Hälfte

der 90er Jahre eine im Vergleich zur 2. Hälfte der 80er Jahre positive Entwicklung der

landwirtschaftlichen Einkommen ab: Die reale

Nettowertschöpfung (NWS) zu Faktorkosten je

Jahresarbeitseinheit

liegt im Durchschnitt der Jahre 1990-94 um etwa +10,1 % höher als im

Zeitraum 1985-89. Die Vergleichbarkeit der Ergebnisse zwischen diesen beiden Zeiträumen ist

allerdings durch die Wiedervereinigung Deutschlands eingeschränkt; der positive Trend ist jedoch

auch bei der Betrachtung der Ergebnisse der einzelnen Mitgliedstaaten erkennbar: Zuwächse in

Spanien (+25,1%), Irland (+21,7%), Frankreich (+16,4%), Vereinigtes Königreich (+13,0%),

Portugal (+12,6%), Griechenland (+12,0%), Deutschland (+11,1%) und Belgien/Luxemburg

(+6,7 %). Leichte Rückgänge werden beobachtet in Italien (-2,5 %), Dänemark (-3,0 %) und den

Niederlanden (-3,5%). Die Prognose für 1995 zeigt eine gegenüber dem Vorjahr nahezu

unveränderte reale NWS zu Faktorkosten je Jahresarbeitseinheit auf EUR 12-Ebene.

Der nach der GAP-Reform zwischen 1992 und 1995 zu beobachtende Rückgang der nominalen

Bruttowertschöpfung (BWS) zu Marktpreisen in EUR 12 um -11,8 Mrd. ECU wird durch den Anstieg

der Subventionen um nominal +11,4 Mrd. ECU ausgeglichen. Dennoch ist in der 1. Hälfte der 90er

Jahre ein Absinken der realen NWS zu Faktorkosten zu beobachten. Die positive Entwicklung der

Realeinkommen je Jahresarbeitseinheit resultiert damit aus der sich fortsetzenden Minderung des

Arbeitseinsatzes.

Den am stärksten von der GAP-Reform betroffenen Produktbereich bilden die pflanzlichen

Erzeugnisse, deren aggregierter Bruttoproduktionswert zu laufenden Preisen für EUR 12 in den

Jahren 1992 und 1993 um -6,2 % und -8,7 % sinkt und in 1994 und 1995 um +2,2 % und +0,3 %

ansteigt. Ausschlaggebend für diese Veränderungen sind vor allem die Preisbewegungen: so sinkt

der durchschnittliche Unit value (Durchschnittspreis) in 1992 und 1993 um -7,8% und -5,5%,

während er 1994 - vor allem bedingt durch den Anstieg bei den Kartoffelpreisen - um +3,4 % und in

1995 nochmals um +1,5% ansteigt. In der tierischen Produktion fällt die Veränderung des

Bruttoproduktionswertes zu laufenden Preisen moderater aus: +0,5% in 1992, -3,6% in 1993,

+2,1 % in 1994 und -2,2 % in 1995. Beim Vorleistungseinsatz zu laufenden Preisen ergeben sich

insgesamt leichte Einsparungen. Diese sind bei Düngemitteln in den Jahren 1992 und 1993 mit

-7,1 % und -8,1 % besonders stark ausgeprägt und sowohl auf Preis- als auch auf

Volumenrückgänge zurückzuführen. In den Jahren 1994 und 1995 steigen die Düngemittelkosten

jedoch wieder um +5,7 % und +1,1 % an. Dieser Anstieg ist im wesentlichen durch höhere Preise

für Düngemittel bedingt.

Einen näheren Einblick in die durch die Reform der GAP verursachten Veränderungen in der

Produktion, im Vorleistungseinsatz und der Wertschöpfungsgrößen bietet die Betrachtung nach

Produktionszweigen (Produktionsaktivitäten bzw. Gruppen von Produktionsaktivitäten), wie sie in

Kapitel 4 dieser Veröffentlichung ausführlich vorgenommen wird. Im folgenden sind die Ergebnisse

für die am stärksten betroffenen Produktionszweige der Landwirtschaft für EUR 12

zusammengefaßt:

(24)

Bei

Getreide

sinkt die durchschnittliche BWS zu Marktpreisen je Hektar von rd. 430 ECU in

1992 auf rd. 290 ECU in 1995. Addiert man jedoch die mit der GAP-Reform eingeführten

Subventionen hinzu (Berechnung der "modifizierten BWS") ergibt sich bis 1995 ein Anstieg auf

rd. 590 ECU je Hektar. Dies bedeutet eine Zunahme der hektarbezogenen modifizierten BWS

um real +22 % gegenüber 1992. Bei stagnierenden Hektarerträgen sinkt die Anbaufläche von

35,2 auf 32,7 Millionen ha.

• Bei

Hülsenfrüchten

wird der Rückgang der hektarbezogenen BWS zu Marktpreisen zwischen

1992 und 1995 nicht in vollem Umfange durch die direkten Subventionen ausgeglichen. Die

modifizierte BWS sinkt daher in diesem Zeitraum um real -35 %. Die Anbaufläche steigt bei

stagnierenden Hektarerträgen von 1,7 auf 1,8 Millionen ha an.

• Bei

Ölsaaten

erfolgt der Preiseinschnitt bereits im Jahr 1992 und verursacht einen erheblichen

Rückgang der hektarbezogenen BWS zu Marktpreisen. Dieser Rückgang wird jedoch durch den

Anstieg der direkten Subventionen ausgeglichen. Hinsichtlich der Anbaufläche und der

Hektarerträge ergeben sich im Gefolge der GAP-Reform keine deutlichen Veränderungen.

• In der

Mast von männlichen Rindern und Kälbern

ist bei stabilen Erlöspreisen ein Anstieg der

direkten Subventionen zu verzeichnen. Dies führt dazu, daß die modifizierte BWS je

geschlachtetem Tier im Zeitraum 1992-1995 um real +18% ansteigt. Die Zahl der

Schlachtungen geht von 21,3 Millionen auf 18,4 Millionen Tiere zurück, was möglicherweise auf

die mit der GAP-Reform eingeführte Koppelung von Subventionszahlungen und

Extensivierungsmaßnahmen zurückzuführen ist.

Abschließend bietet diese Veröffentlichung mit den Übersichten über den

hektarbezogenen

Pflanzenschutzmittel- und Düngemitteleinsatz

(Kapitel 5) einen Anknüpfungspunkt für die

Diskussion umweltrelevanter Aspekte der landwirtschaftlichen Produktion und der GAP-Reform.

Hinsichtlich des Pflanzenschutzmitteleinsatzes läßt sich für EUR 12 zusammenfassend sagen, daß

der hektarbezogene Umfang des Pflanzenschutzmitteleinsatzes im Zeitraum 1992-1995 eine

rückläufige Tendenz aufweist: je Hektar landwirtschaftlicher Fläche sinkt die Ausbringungsmenge

von Pflanzenschutzmitteln (zu Preisen von 1990) um insgesamt -9%. Ein differenzierteres Bild

ergibt dabei die Betrachtung nach einzelnen Produktionszweigen: während bei den Dauerkulturen

ein Anstieg der Pflanzenschutzintensität um +7 % zu verzeichnen ist, sinkt sie bei Ackerkulturen um

-14 % (darunter bei Getreide um -5 %). Der Einsatz von Düngemitteln je Hektar Fläche weist in der

1. Hälfte der 90er Jahre keine eindeutige Entwicklungsrichtung auf.

(25)

1. Introduction

1.1. Contents of the publication

This publication focuses on various aspects of agricultural sector developments during the period

1985-1995 in the European Union and its Member States

5

. The tables presented in this publication

are computed from the SPEL/EU-Data (actualization from November 1995). The SPEL/EU-Data

describe agricultural output generation and input use within the framework of an activity-based

approach. They take into account the intersectoral output and input flow between agriculture and

non-agriculture as well as the intrasectoral output and input flow between agricultural production

activities. At the same time they also comprise information on agricultural gross value added at

market prices broken down by production branches.

Chapter 1.2 explains the basic characteristics of the SPEL approach, while chapters 1.3 and 1.4

give short overviews of those modules of the SPEL System that have generated the

SPEL/EU-Data: the Base System (BS) and the Short-term Forecast and Simulation System (SFSS)

6

.

Chapter 2 presents a summary analysis of sectoral trends in the European Union. It is based on the

data presented in the tables of chapters 3 to 5.

Chapter 3 gives an overview of the development of the sectoral value-added components. It shows

the change in gross output and intermediate consumption in terms of change rates of values,

volumes and unit values differentiated by groups of product or input items.

Chapter 4 focuses on the main agricultural production activities or groups of production activities. It

provides a picture of trends in output values, intermediate consumption and gross value added at

market prices in the different production branches. The calculation of a "modified gross value

added", which includes estimates of those subsidies introduced or affected by the 1992 reform of

the Common Agricultural Policy

7

, supplements the information on value added.

Chapter 5 concludes the publication with the presentation of selected data on intermediate input

use, which may be of interest in environmental questions. It focuses on plant protection and fertilizer

input per hectare.

The tables in this publication have been computed by standardized exploitation routines for the

SPELVEU-Data. The SPEL/EU-Data show a much deeper differentiation with respect to production

activities, product and input items than the tables presented in this publication. The whole set of

SPEL/EU-Data for the period 1973-1995 is available in Eurostat's NewCronos databank and can be

distributed to external users together with a software package (CUBX.WIN) that enables users to

extract the data. It is regularly updated and checked by Eurostat.

The data refer to the territory of the European Union as before 1 January 1995 (EUR 12). The results for Germany

comprise the old Bundesländer up to 1990 and from 1991 onwards the old and new Bundesländer. Results at EUR 12

level are arrived at by aggregation.

For detailed methodological notes, the reader is referred to "SPEL System Methodological Documentation (Rev. 1)

-Vol. 1 : Basics, BS, SFSS" which has been published by Eurostat in January 1995.

Per-hectare compensatory payments for cereals, oilseeds and pulses, beef and suckler cow premiums, sheep and

goats premiums

(26)

1.2. General characteristics of the SPEL approach

The SPEL System is designed for monitoring the present situation in the agricultural sector, for

ex-post analyses of sectoral developments and for short-term and medium-term forecasts and policy

simulations of the effects of alternative agricultural policies.

Common to all modules of SPEL is the activity-based accounting approach:

• The activity-based approach constitutes a division of the agricultural sector into production and

use activities. It traces production interactions within the agricultural sector (intrasectoral flows)

and between agriculture and non-agriculture (intersectoral flows).

• It provides a detailed breakdown of agricultural production and distinguishes between forty-nine

production activities, sixty product items and thirty-three variable input items. Fifteen

intrasectoral use activities and one intersectoral use activity (sales/purchases) complete the

representation of product and input flows.

• The compliance with the accounting-approach guarantees consistency with respect to physical

and monetary cyclical links, and ensures the comparability of data and model results with the

definitions used in the Economic Accounts for Agriculture (EAA).

The approach described above results for each represented year and Member State in what is

called an "Activity-based Table of Account (ABTA)"

8

. An ABTA provides a detailed breakdown of

the agricultural production processes into yield and input coefficients as well as cultivated area and

herd size. By also taking into account the important intrasectoral product flows between production

activities and within single production activities (e.g. young animals or feedingstuffs), it presents

approximately realistic gross output values. After the aggregation of the production activity data, the

sum of the non-consolidated (gross) flows of SPEL is identical with the sum of the consolidated

(net) flows of the EAA, which contains the final output value. The resulting sectoral gross value

added at market prices of SPEL therefore complies with the definitions of the EAA.

An "Additional Demand Component" that depicts the flows of products from their origin to their final

consumption supplements the supply-oriented ABTA. It breaks down the use of the raw (primary)

agricultural products outside the agricultural sector into different use activities: human consumption,

animal feed, seed use, industrial use, processing, stock changes, losses and exports. In addition, it

links the supply-balance sheets of the raw products (e.g. rape seed) to the domestic resources of

the processed products (e.g. rape oil) via "processing" activities.

A further important characteristic of the SPEL approach is that it does not take the set of statistical

data as final. The identity systems of the modules of the SPEL/EU-model comprise several

consistency checks. These are starting-points for critical investigations of the database, which are

carried out in close co-operation between the model builders and the statisticians of Eurostat and

the Member States.

1.3. Base System

The Base System generates the SPEL/EU-Data for the ex-post period (here the data up to 1994).

For this, it combines different sources of information: official agricultural statistics (mainly from the

databases of Eurostat), farm sample data, technical and management data.

However, the BS does not directly specify the ABTA and Additional Demand Component on the

basis of these data. The shortcomings of statistical material make systematic data preparation work

necessary (mainly completion of missing data).

The ABTAs for the European Union as a whole are calculated by an aggregation over the Member States' ABTAs.

(27)

Once the data preparation steps are completed, the Base Model (BM) integrates the different types

of (prepared) data in order to constitute the ABTA and Additional Demand Component. It derives

the sets of input and output coefficients, activity levels and input and output prices by recursive and

iterative approaches. Well-defined identity systems and checking procedures ensure the

consistency of the results.

The results of the Base System can be used for ex-post analyses of trends in output and

intermediate consumption, productivities, prices and incomes. More importantly, however, the

results of BS are the basis for short- and medium-term forecast and simulations.

1.4. Short-term Forecast and Simulation System

The Short-term Forecast and Simulation System has been used to generate the update of the

SPEL/EU-Data for the year 1995.

In the update work, SFSS serves as a means of bridging the statistical gap between the current

year and the statistical information available for the previous and current year. For example, the

"routine" application of SFSS in the autumn of 1995 has generated the SPEL/EU-Data for 1995

(diagnosis of the current situation).

In addition, SFSS can also be applied to produce ex-ante projections and simulations for up to one

year.

Projections, simulations and updates with SFSS are carried out in the framework of the ABTA.

Normally the following worksteps are obeyed:

• Early available statistical data and trend-based econometric analyses for output coefficients,

production activity levels, producer and purchase prices, market use activities and

macroeconomic variables (exchange rates, GDP-deflator, etc) are the starting-points for

short-term forecasts. The short-short-term model combines this information and produces consistent

ABTAs. The EAA income components are the central resultant variables. The forecasts

produced during this stage are called system proposals.

• The second step comprises judgements on the system proposals by specialists (e.g. by Eurostat

officials with expertise in the relevant fields). The specialists can make suggestions for

improvements on the basis of available data (e.g. from special surveys, case studies, early

indicators for the weather conditions) or on the basis of their own assessments. These expert

proposals are entered into the system.

• Once the expert proposals are taken into account, the short-term model produces the definitive

forecast in the definitions of the ABTA.

From the above methodological remarks it should be clear that the most important variables are

exogenous for the short-term model. Endogenously, SFSS depicts only those (limited) substitutions

of products and factors which are feasible for the short-term (e.g. between different feed

categories).

(28)

2. Summary of the results

Recent trends in the agricultural sector of the European Union have occurred against the

background of changes in agricultural policy which were introduced following the decisions taken in

1992 to reform the Common Agricultural Policy (CAP). These changes essentially involve a marked

reduction in support prices, the transition to an income support system based on subsidies that are

more direct and less linked to production and on greater financial incentives for limiting production

(set-aside).

Against this background, a positive trend in agricultural income for the European Union (EUR 12)

was observed for the first half of the 1990s compared with the second half of the 1980s;

real net

value added (NVA) at factor cost per annual work unit

was about +10.1% higher on average

over the period 1990-94 than it was between 1985 and 1989. The comparison of the income levels

between the two periods show the positive trend described above for many of the Member States.

In the case of Germany the comparability is limited by the reunification of the country. There were

increases in Spain (+25.1 %), Ireland (+21.7%), France (+16.4%), United Kingdom (+13.0%),

Portugal (+12.6%), Greece (+12.0%), Germany (+11.1%) and Belgium/Luxembourg

(+6.7 %).Decreases were recorded for Italy (-2.5 %), Denmark (-3.0 %) and the Netherlands

(-3.5%). The forecast for 1995 shows a real NVA at factor cost per annual work unit that - at

EUR 12 level - has barely changed.

The sharp fall of -11.8 billion ECU recorded for gross value added (GVA) at market prices in

nominal terms for EUR 12 between 1992 and 1995, the years following CAP reform, was

compensated by the increase in subsidies of +11.4 billion ECU in nominal terms. However, in real

terms, there was a fall in NVA at factor cost during the first half of the 1990s. The positive trend in

real incomes per annual work unit was therefore the result of the continual reduction in the volume

of agricultural labour input.

Crop products were the most severely affected by the reform of the CAP, as its aggregate gross

output value at current prices fell by -6.2 % and -8.7 % in 1992 and 1993 for EUR 12 as a whole

and rose by +2.2 % and +0.3 % in 1994 and 1995. The principal reason for these changes was

price movements; the average unit value fell by -7.8 % in 1992 and by -5.5 % in 1993, though it

increased by +3.4 % in 1994, mainly as a result of the increase in potato prices. A further increase

of the average unit value by +1.5 % has been forecast for 1995. The changes in the gross output

value of animal products at current prices were more moderate: +0.5 % in 1992, -3.6 % in 1993,

+2.1 % in 1994 and -2.2 % in 1995. On average, there were slight falls in the value of intermediate

consumption items at current prices. This was especially evident for fertilizers, which saw falls of

-7.1 % in 1992 and -8.1 % in 1993, as a result of reductions in both prices and volumes. However,

in 1994 and 1995 fertilizer costs rose by +5.7 % and +1.1 %. This increase was mainly caused by

higher prices for fertilizers.

Analyses of the individual production branches (production activities or groups of production

activities), which are given in detail in chapter 4 of this publication, enable a better understanding of

the changes in output, in the utilization of intermediate consumption items and in the aggregates of

value-added, due to the reform of the CAP. A summary of the results for the agricultural production

branches most affected at the EUR 12 level is given below.

• For

cereals,

the average GVA at market prices per hectare fell from around 430 ECU in 1992 to

about 290 ECU in 1995. However, adding the subsidies introduced under the CAP reform

(calculating the "modified GVA") led to the average rising to about 590 ECU per hectare in 1995.

This means that adjusted GVA per hectare increased by +22 % in real terms compared with

1992. There was little change in yields per hectare and the area under cultivation declined from

35.2 to 32.7 million ha.

(29)

• In the case of

pulses,

direct subsidies were not able to offset fully the fall in GVA at market

prices per hectare between 1992 and 1995. Over this period, modified GVA fell by -35 % in real

terms. The area under cultivation rose from 1.7 to 1.8 million ha, with little change in yields per

hectare.

• For

oilseeds,

prices began to fall as early as 1992, leading to a considerable reduction in GVA

at market prices per hectare. However, this fall was offset by the increase in direct subsidies.

There were no noticeable changes in the area under cultivation and yields per hectare following

CAP reform.

• As regards

male adult cattle and calves for fattening,

there was an increase in direct

subsidies together with stable average unit values. This produced an increase of +18 % in real

modified GVA per slaughtered animal in the period 1992-1995. The number of animals

slaughtered declined from 21.3 million to 18.4 million, which might have resulted from the effect

of subsidy payments linked to extensification measures introduced by CAP reform.

Lastly, the tables on the volumes of intermediate consumption used per hectare concerning

plant

protection products and fertilizers,

which figure in chapter 5 of this publication, offer a starting

point for a discussion of aspects of agricultural production and CAP reforms that are important for

the environment. In summary form, it can be mentioned that there was a downward trend in the

quantities of plant protection products used per hectare in the period 1992-1995 for EUR 12 as a

whole; the use of plant protection products per hectare of area under cultivation (at 1990 prices)

saw an overall fall of-9 %. Analyses of the production branches, however, gives a disparate picture;

whilst there was an increase in the intensity of utilization of plant protection products for permanent

crops (+7 %), there was a clear fail (-14 %) for arable crops (among this, -5 % for cereals). The

utilization of fertilizers per hectare does not show a clear trend for the 1 st half of the 1990s.

(30)

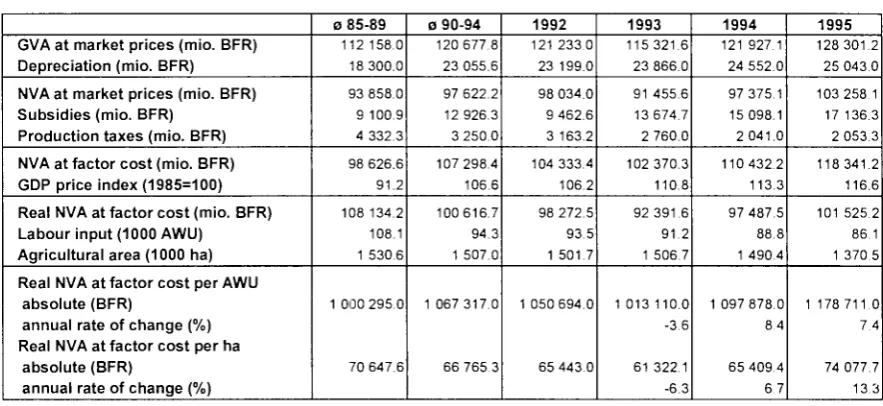
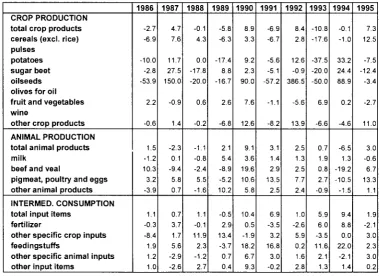
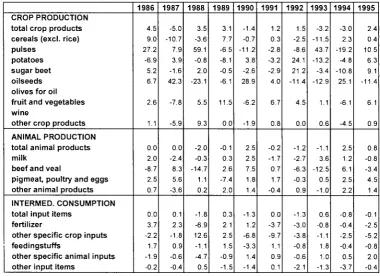
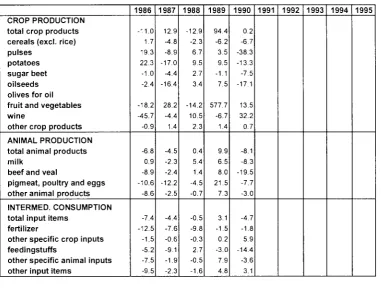
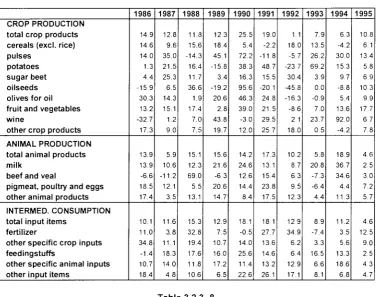
Figure

Table 3.1.-2
Table 3.1.-3
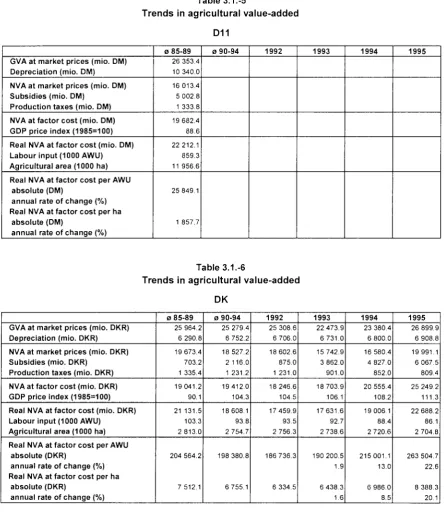
Table 3.1.-5
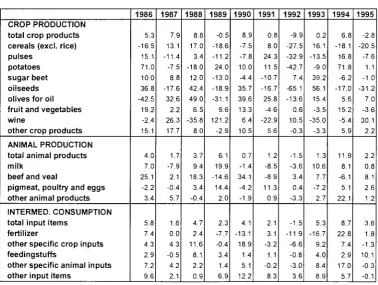
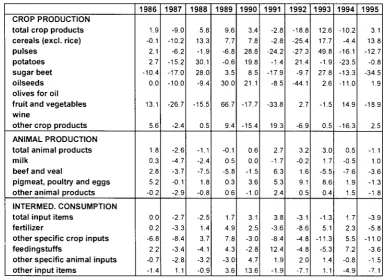
Table 3.2.1.-7
+7

References

Related documents

≥ Select “Off” when the TV is connected to this unit via HDMI AV OUT terminal, and this unit is also connected to other devices, such as an amplifier/receiver via an DIGITAL AUDIO

Facet joint arthropathy - osteophyte formation and distortion of joint alignment MRI Axial T2 L3-L4 disk Psoas Paraspinal muscles Psoas Paraspinal NP AF MRI Axial T2 PACS, BIDMC

Pressing the MENU button while in the Media Browser mode will access the Picture, Sound and Settings menu options.. Pressing the MENU button again will exit from

Handling and cleaning the screen surface/ cabinet of the TV set Be sure to unplug the mains lead connected to the TV set from mains socket before cleaning. To avoid

This finding is in line with the managerial influence hypothesis and the busy board hypothesis because in companies with a high number of direct links, the

Recording Data for New or Revised Course (Record only new or changed course information.) Course prefix (3 letters) Course Number (3 Digits) Effective Term (Example:

The Department of Health, Physical Education, Recreation and Dance offers a Master of Science in Education in Health and Physical Education and a Master of Science in

CREW (with expansion and 11960-EXP ONLY, down position, unlabeled): Pilot and copilot have ac- cess to aircraft radios, and hear Music input to PM1200.. Passengers do not